1/x If you've been following the shipping news, you might have heard of the Drewry World Container Index and/or the Shanghai Containerized Freight Index. What are they? A small 🧵 

2/x Container shipping is one of the most volatile industries globally. Freight rates (how much you pay to ship a container) can fluctuate dramatically due to changes in supply and demand, fuel prices, geopolitical events, as well as seasonal peaks and economic cycles.

3/x Before proper indices existed, rate information was opaque. Shippers and carriers negotiated rates privately, often through brokers, with very little public visibility. This made it difficult to know if you were getting a fair price and/or plan your budget and contracts.

4/x As global trade exploded through containerization (especially from the 1990s onward), the need for transparency, benchmarking, and risk management tools grew significantly. Enter the Drewry WCI (World Container Index).

5/x Drewry is a London-based maritime research and consulting firm. To address shippers' and carriers' desire for index-linked contracts instead of fixed-price long-term contracts, they developed the WCI in 2006.
6/x The WCI is a composite index that tracks spot container freight rates on the world’s major East-West trade routes. It is published weekly. The index is measured in USD per 40ft container (FEU) and focuses on spot market rates across 8 major trade routes.
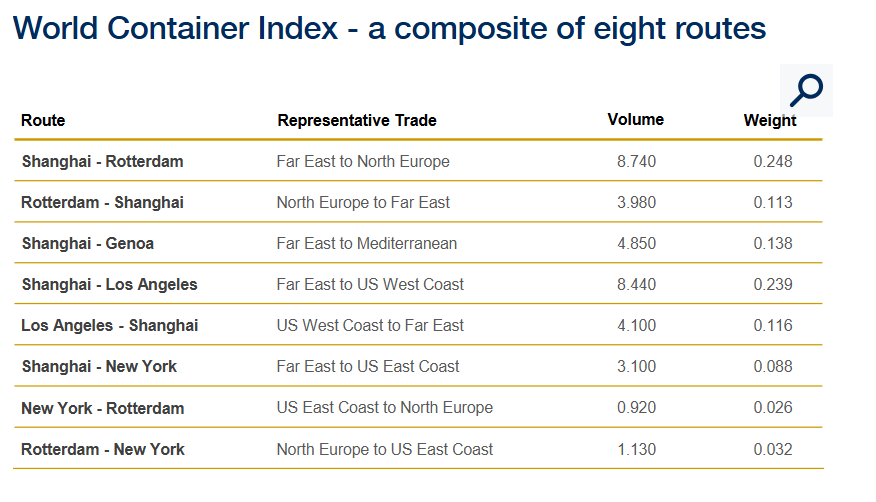
7/x Drewry analysts collect and assess spot freight rates from multiple sources (shippers, freight forwarders, and carriers) on these routes. These 8 routes are then weighted by trade volume to create the composite WCI.

8/x As you can see, the DWCI has risen sharply over the last week because of sharp increases on the Asia to Europe and US routes. Why? The peak season has arrived earlier this year, driving freight prices up. Why has the season arrived earlier? Companies are front-loading

9/x On the US routes, this has to do with expected tariff changes in July (The U.S. government’s 90-day pause on global reciprocal tariffs is set to expire on July 9th, with the pause for China ending on August 12th) and additional cargo requested because of the FIFA World Cup.
10/x On the Europe trade, they are expecting bunker fuel adjustments. Also, potential new Red Sea diversions are prompting importers to order now to ensure their cargo is in stock for major events like Amazon Prime Day and TikTok mid-year promos. 🤷♂️

11/x So the Drewrey WCI is a world index. It gives you a global picture across the most important trade lanes (more stable and widely used in contracts). But then we also have the SCFI - Shanghai Containerized Freight Index.

12/x The SCFI is a benchmark that tracks spot freight rates for containerized exports from the port of Shanghai to major global destinations. The Chinese government (through the Shanghai Shipping Exchange, or SSE) created the SCFI in 2005 and officially launched it in 2009.

13/x The SCFI reflects weekly spot (short-term, transactional) freight rates on exports from Shanghai. It captures the all-in price for booking space on the spot market.
14/x The SCFI is a weighted average of individual route indices covering 15 major export routes from Shanghai to base ports in key regions. The ports of destination are the base ports of the route, e.g. Mediterranean Sea➡️Barcelona/Valencia/Genoa/Naples,
15/x Europe➡️Hamburg/Rotterdam/Antwerp/Felixstowe/Le Havre, USWC➡️Los Angeles/Long Beach/Oakland, USEC➡️New York/Savannah/Norfolk/Charleston, West Japan➡️Osaka/Kobe, East Japan➡️Tokyo/Yokohama

16/x Every week, the SSE surveys a voluntary panel of reputable participants, typically around 20 liner shipping companies (carriers) and 17 shippers/freight forwarders/NVOCCs (Non-Vessel Operating Common Carrier)
17/x Then an Individual Route Rate is calculated as the arithmetic mean of the panel submissions for that route. A Composite Index is calculated: A weighted average of the Individual Route Rates, indexed so that October 16, 2009 = 1,000 points.
18/x Each route has a fixed weighting that reflects its relative importance in Shanghai’s export container trade. The base date is October 16, 2009, and the index was set at 1,000. The SCFI is an index without a unit (so it is NOT USD/TEU or FEU)

19/x The SCFI is sensitive to market conditions because it uses only spot rates and is published weekly. It reacts quickly to shifts in supply and demand, changes in capacity, fluctuations in fuel prices, and any disruptions.
20/x Also here, you can see that the SCFI has risen sharply in the last week(s). The reasons are the same as for the D-WCI.

• • •
Missing some Tweet in this thread? You can try to
force a refresh