The worst case of pandemic death inflation was 1918.
Wellcome Trust claim 100 million people died from Spanish Flu.
That is an impossible number.
Here is why. 🧵
Wellcome Trust claim 100 million people died from Spanish Flu.
That is an impossible number.
Here is why. 🧵

Let's start with some numbers that people agree with.
There were 1.8 billion people on the planet.
A third were infected.
That is ~600 million infections.
There were 1.8 billion people on the planet.
A third were infected.
That is ~600 million infections.

That gives us the problem in a nutshell.
The Wellcome Trust are claiming 1 in 6 people infected died.
That is 17%.
The evidence suggests that is out by at least ten fold.
The Wellcome Trust are claiming 1 in 6 people infected died.
That is 17%.
The evidence suggests that is out by at least ten fold.
Most measures of mortality were based on hospital fatality rates which likely exaggerate the estimate.
The consensus from every reasonable measure is that 1-3% of the infected died. ncbi.nlm.nih.gov/pmc/articles/P…
The consensus from every reasonable measure is that 1-3% of the infected died. ncbi.nlm.nih.gov/pmc/articles/P…
The US estimated 675k deaths from a population of 103 million.
That means 0.65% of the total population died.
If a third had been infected that works out at a 2% mortality rate.
That means 0.65% of the total population died.
If a third had been infected that works out at a 2% mortality rate.
By taking the death rate in USA and assuming that other countries died at a higher rate a modelled global estimate of mortality reached in 1920s was 21 million.
If 1% of 600 million died that would be 6 million.
At 2% it would be 12 million.
At 3% it would be 18 million.
If 1% of 600 million died that would be 6 million.
At 2% it would be 12 million.
At 3% it would be 18 million.
The higher figures all depend on the idea that mortality was higher in places like Japan and China.
The evidence shows that it was far lower.
pubmed.ncbi.nlm.nih.gov/17379558/#:~:t….
jstor.org/stable/132645
The evidence shows that it was far lower.
pubmed.ncbi.nlm.nih.gov/17379558/#:~:t….
jstor.org/stable/132645
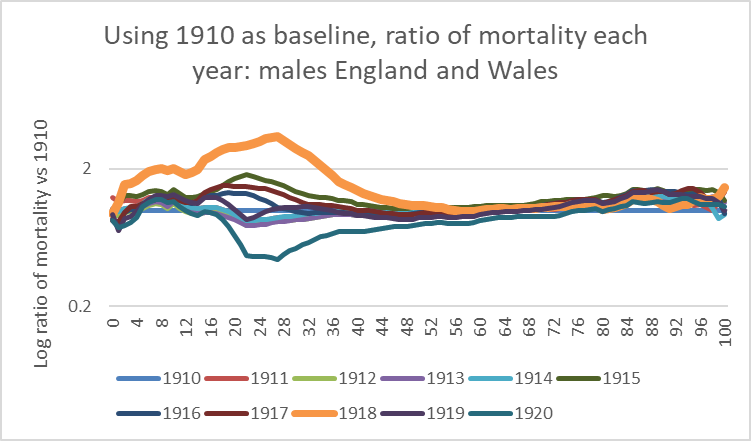
Importantly, there was more than one way to die from Spanish Flu.
Older people died with an influenza like illness, secondary bacterial infection with frailty as a predictor.
But
the big proportional excess was not in older people:
Older people died with an influenza like illness, secondary bacterial infection with frailty as a predictor.
But
the big proportional excess was not in older people:
https://x.com/ClareCraigPath/status/2019445954189926522?s=20
Young people did not die of an influenza-like illness.
They died with heavy, red haemorrhagic lungs after having a distinctive purple face rash - a heliotrope rash - and severe fever.
The ones dying were young enough to serve in the army - or their families.
They died with heavy, red haemorrhagic lungs after having a distinctive purple face rash - a heliotrope rash - and severe fever.
The ones dying were young enough to serve in the army - or their families.
That pathological picture is not influenza.
Some have said it is the pathology of phosgene gas which was used at the front.
That might explain why the propaganda around spanish flu peaked in 1914 and then plateaued.
Some have said it is the pathology of phosgene gas which was used at the front.
That might explain why the propaganda around spanish flu peaked in 1914 and then plateaued.
https://x.com/ClareCraigPath/status/2055200089010745488?s=20
However, there is no explanation for how that gas could have killed people away from the frontline.
Another explanation is aspirin toxicity.
Aspirin was once made from willow bark - or was simply given by chewing the bark neat.
But it was synthethised from coal tar by then.
Another explanation is aspirin toxicity.
Aspirin was once made from willow bark - or was simply given by chewing the bark neat.
But it was synthethised from coal tar by then.
Bayer had the patent on coal tar aspirin.
But there was a war on.
Numerous pharmaceutical companies started producing it, and marketing it, at scale.
Aspirin was the saviour drug of the day.
But there was a war on.
Numerous pharmaceutical companies started producing it, and marketing it, at scale.
Aspirin was the saviour drug of the day.
And the pathology of aspirin toxicity is an exact match for aspirin.
hartuk.substack.com/p/1918-pandemi…
hartuk.substack.com/p/1918-pandemi…

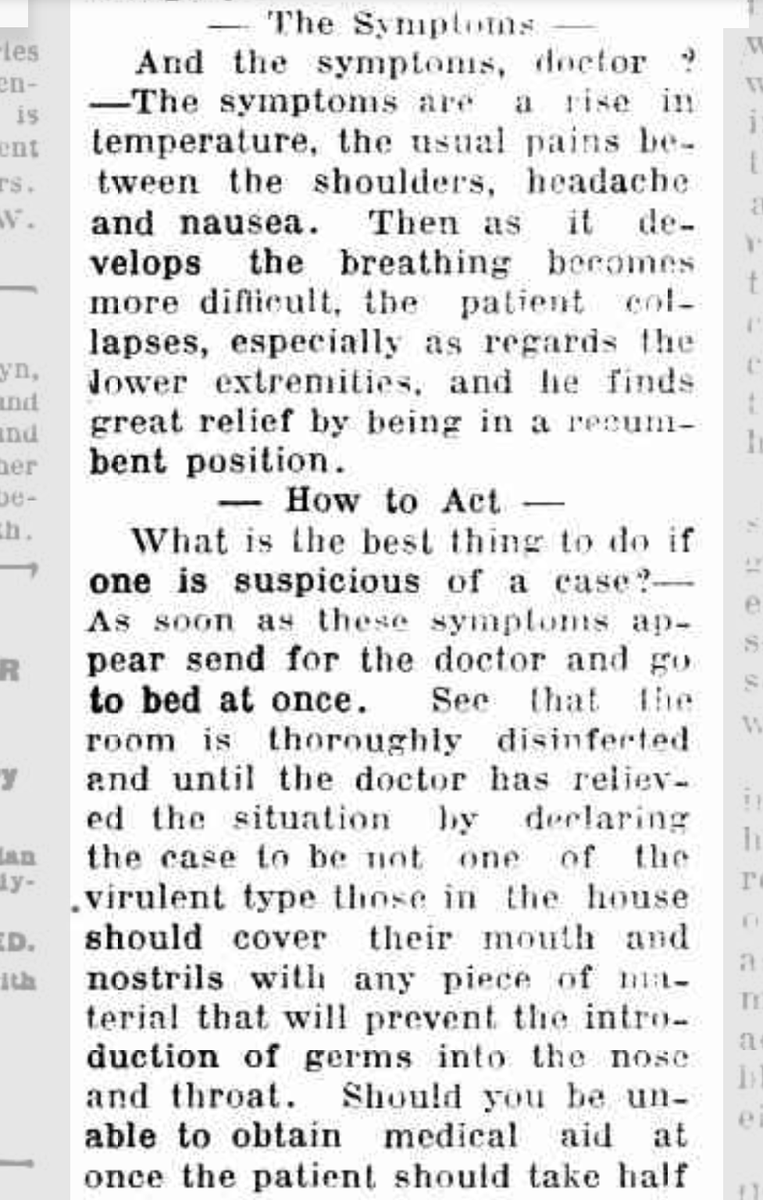
The Victorians were understandably paranoid about dying.
The would tell each other to take straight to bed and call a doctor for essentially any symptom.
trove.nla.gov.au/newspaper/arti…
The would tell each other to take straight to bed and call a doctor for essentially any symptom.
trove.nla.gov.au/newspaper/arti…
The same pattern of fear and a positive feedback loop with use of a synthetic new drug caused the "Russian Flu" of 1889-1892:
hartuk.substack.com/p/the-forgotte…
hartuk.substack.com/p/the-forgotte…
There was a new pathology killing young people.
It likely killed around ~10 million people.
Death inflation has made that into 100 million.
But underlying it all was fear and a positive feedback loop where aspirin produced a fever which was treated with more aspirin.
It likely killed around ~10 million people.
Death inflation has made that into 100 million.
But underlying it all was fear and a positive feedback loop where aspirin produced a fever which was treated with more aspirin.
• • •
Missing some Tweet in this thread? You can try to
force a refresh