A Nigerian think tank committed to finding practical solutions to urgent national challenges.
Email: info@agorapolicy.org
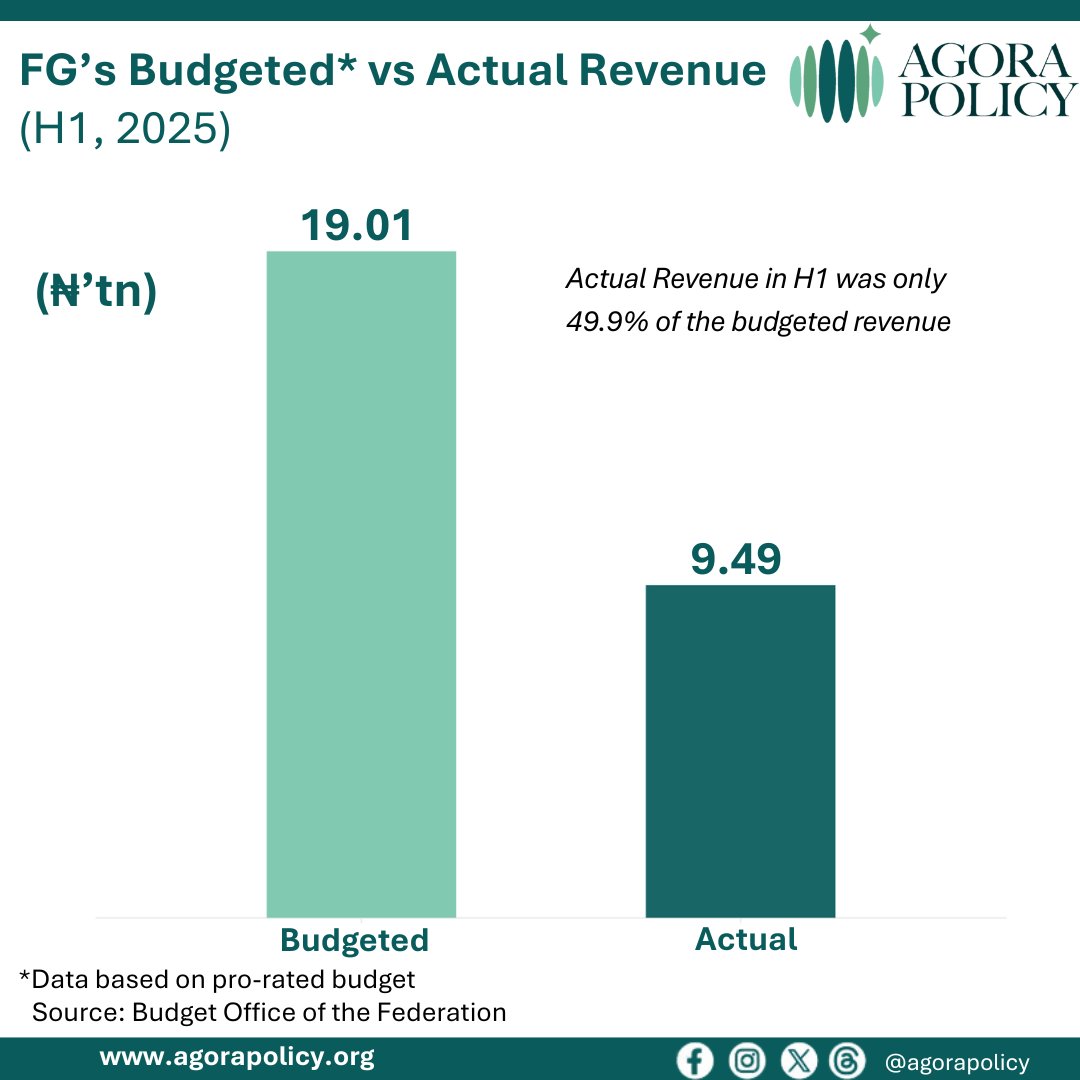
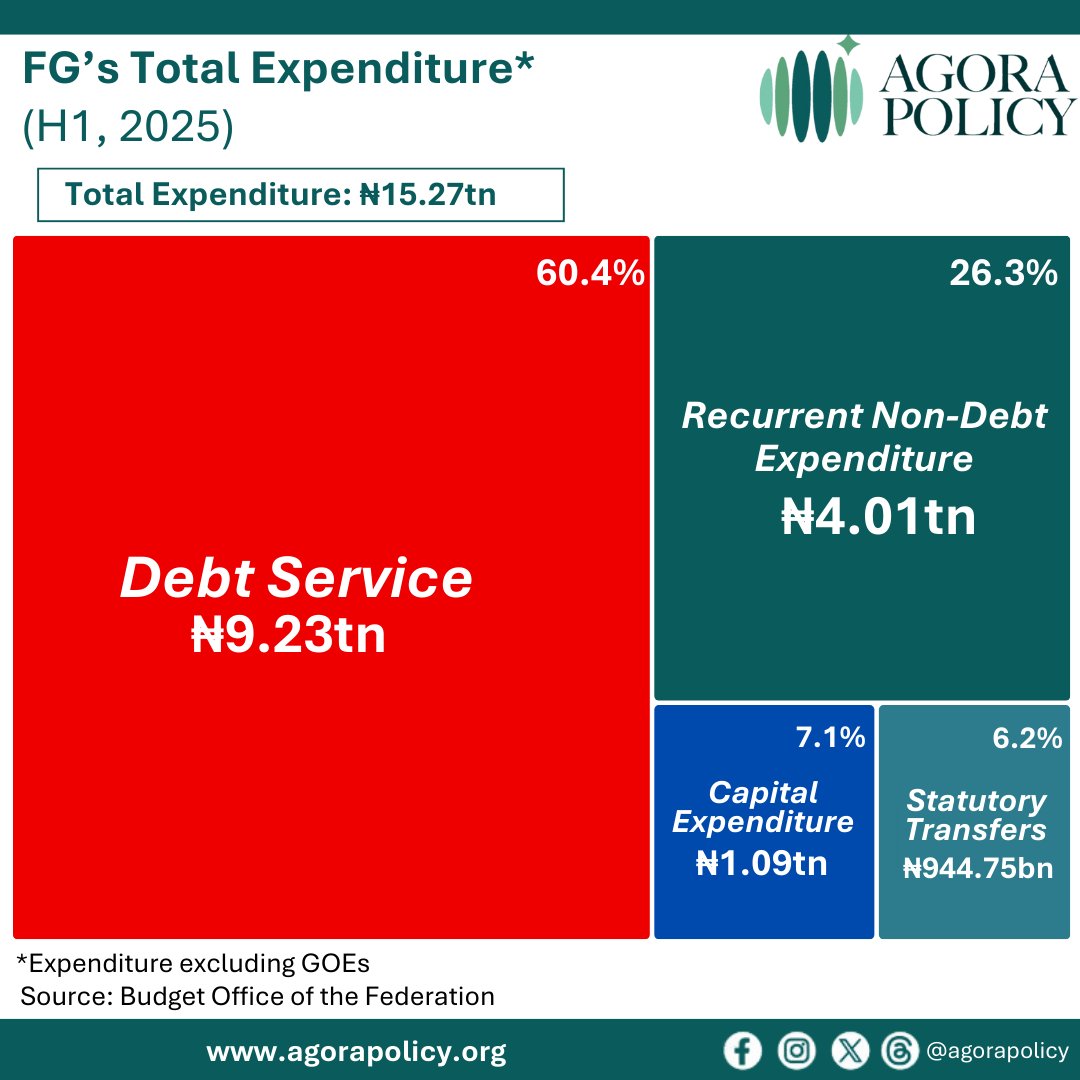
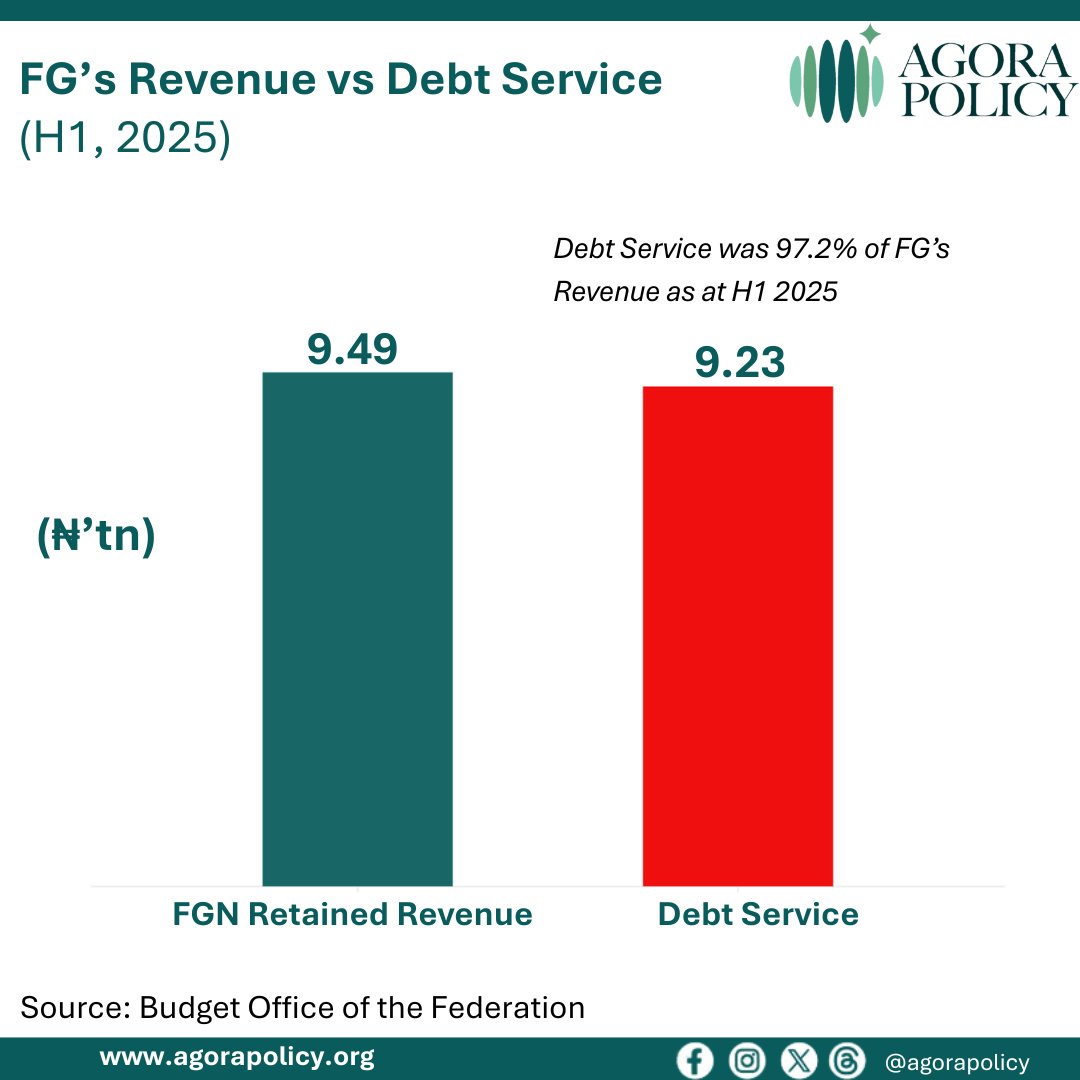 Oil revenue contributed 36.2% (₦3.43tn) to FG’s retained revenue in the first half of 2025 while non-oil revenue made up 35.6%% (₦3.38tn). Meanwhile, debt service was the highest expenditure item for FG at ₦9.23tn, accounting for 60.4% of total expenditure.
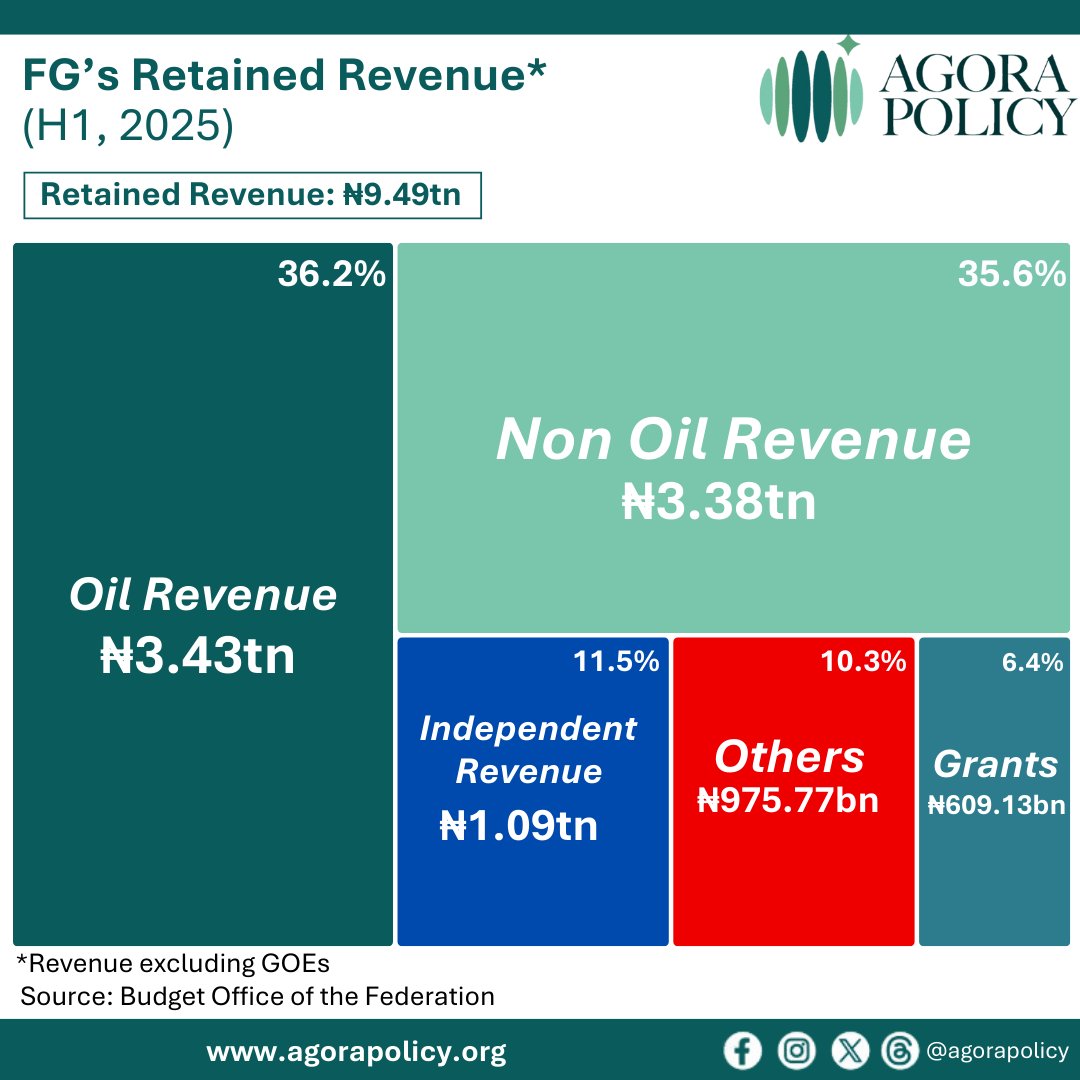
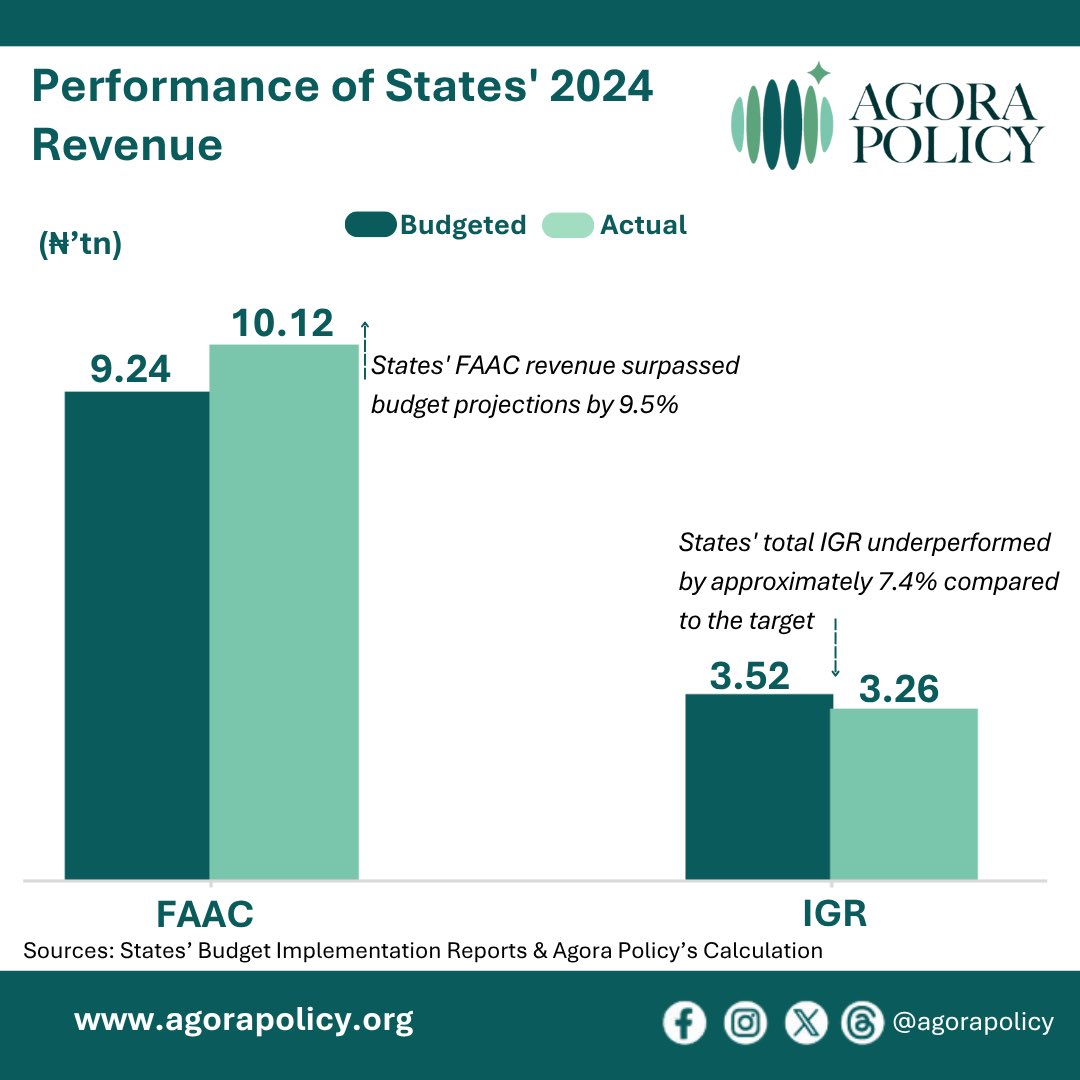
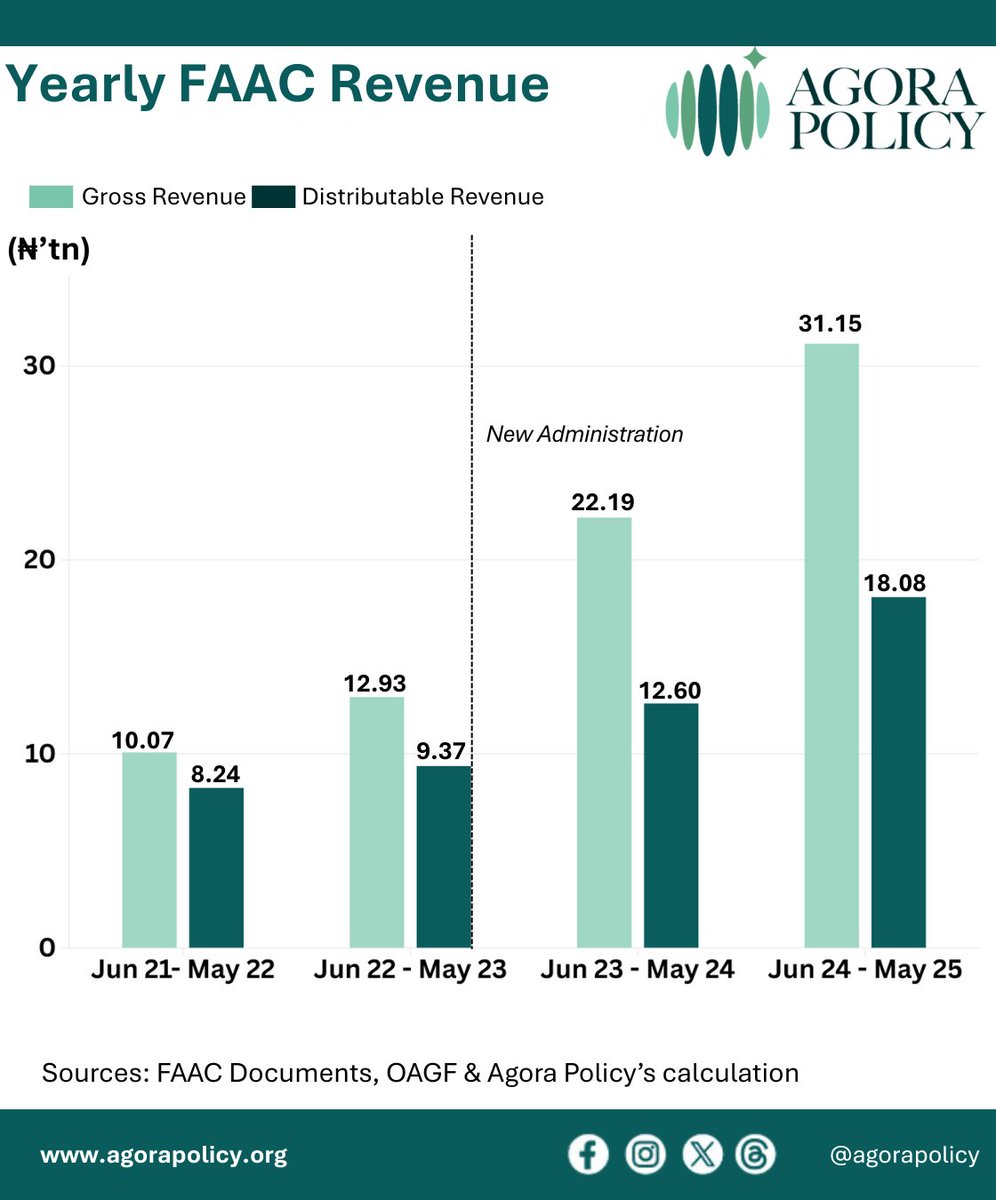
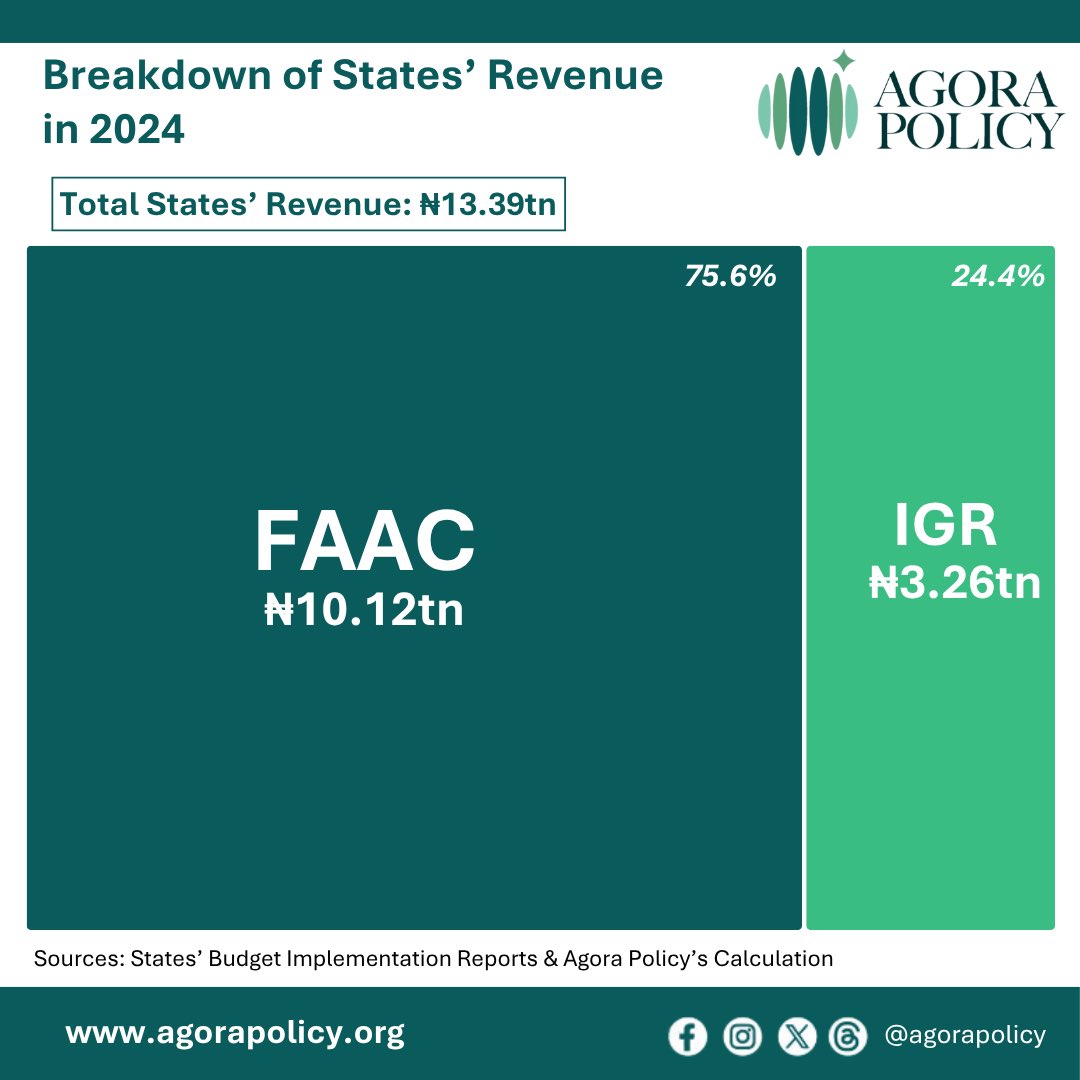 Nigeria’s 36 states generated ₦13.39tn in revenue, surpassing the ₦12.76tn target by 4.9%, largely due to higher FAAC allocations. However, they underperformed on internally generated revenue (IGR), falling 7.4% below target.
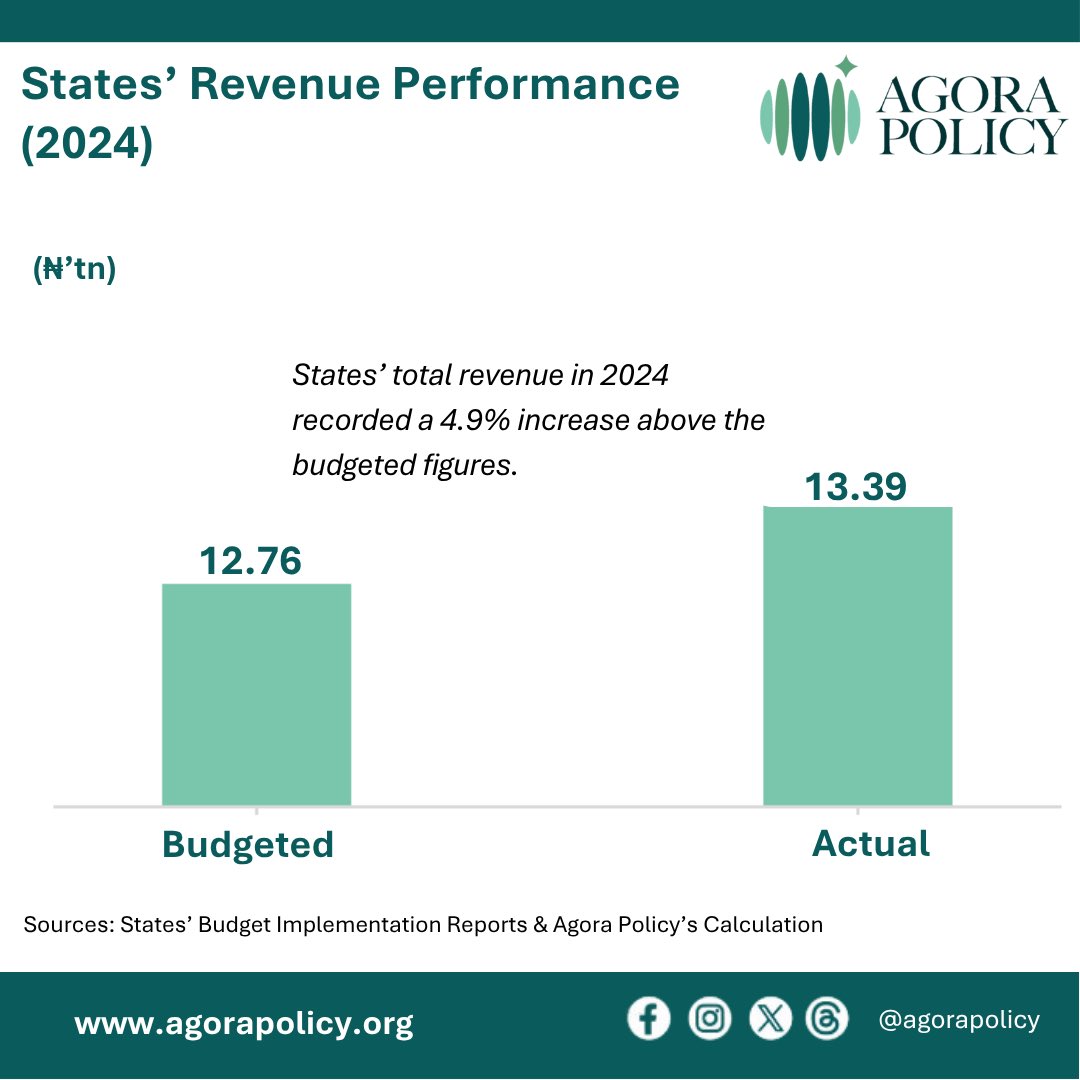
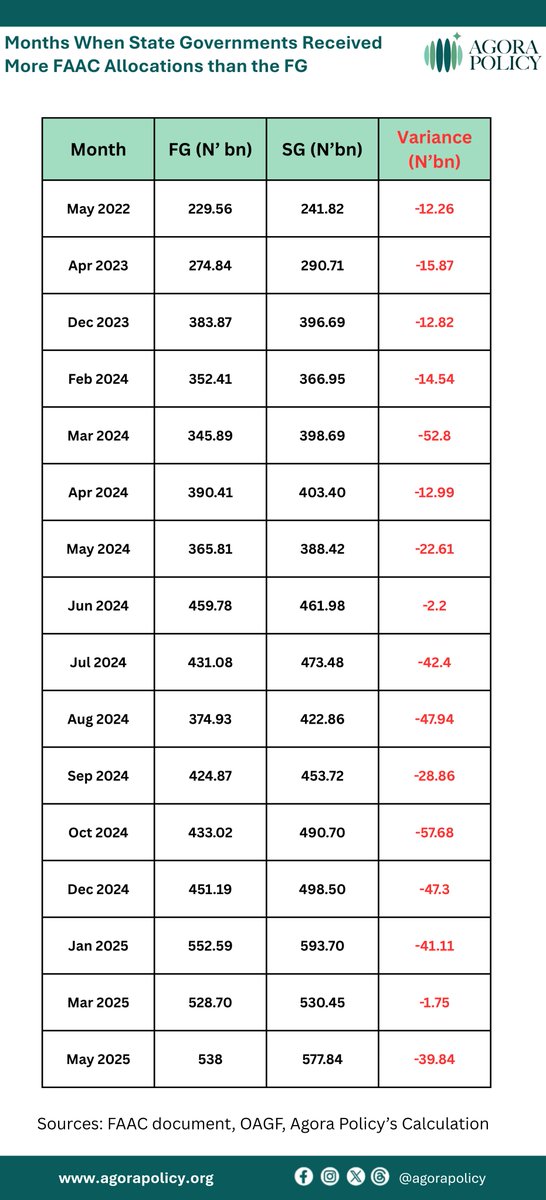
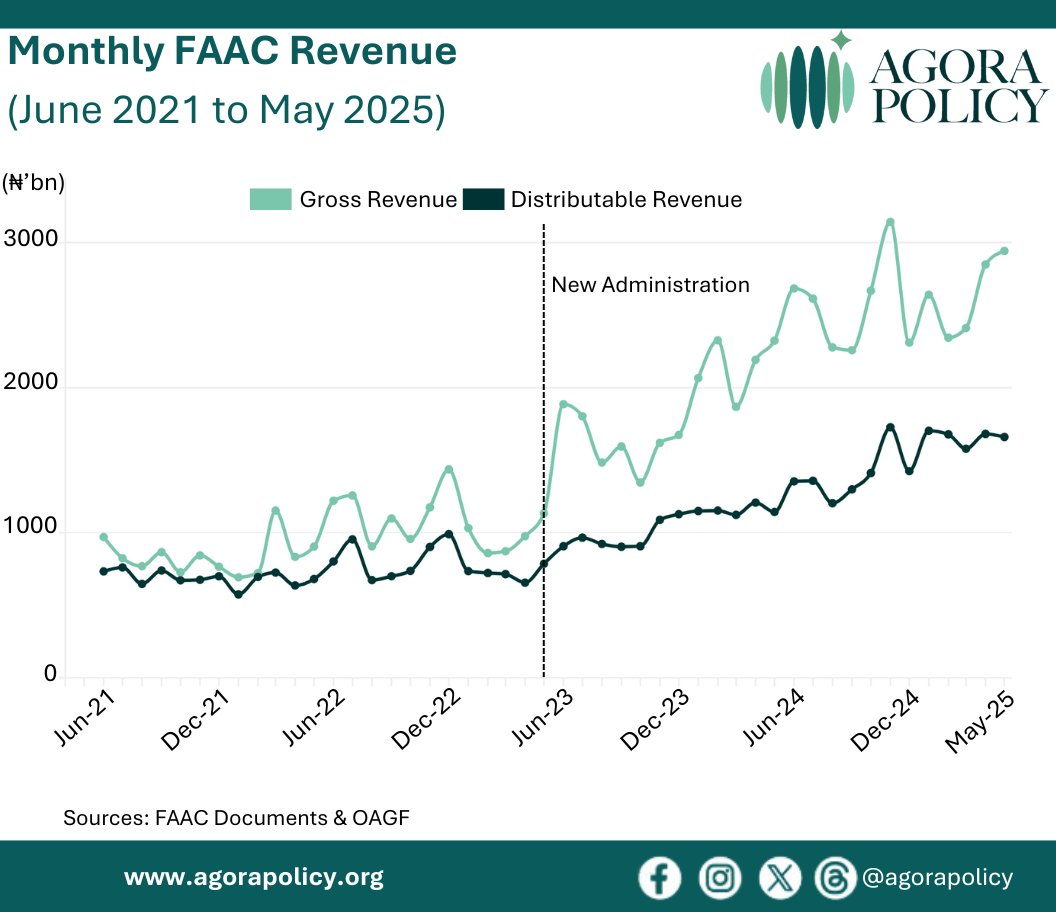
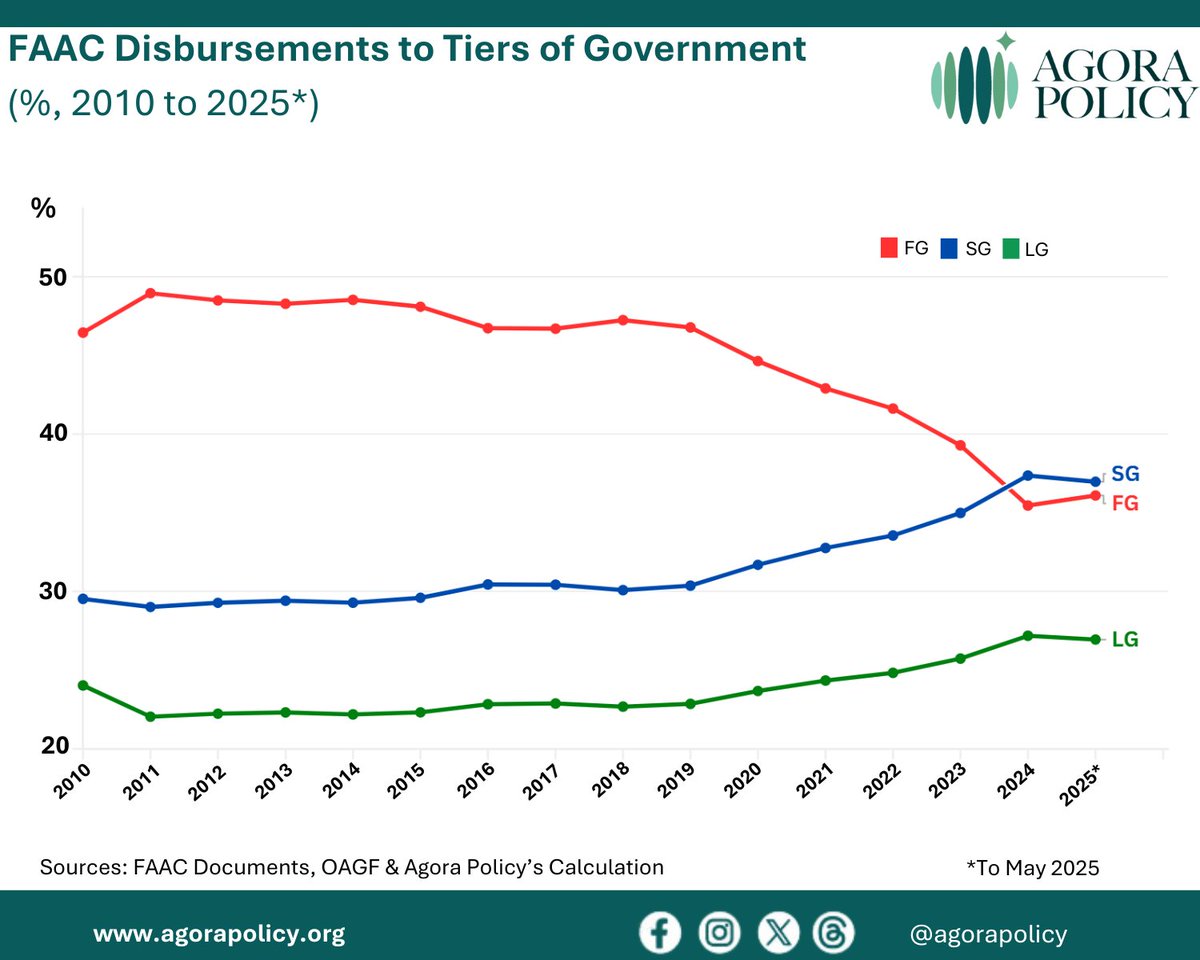 Between June 2020 and May 2023, the states received more FAAC allocations than the FG in only two months (May 2022 and April 2023). However, the FG got lower allocations than the states in 14 months between June 2023 and May 2025.
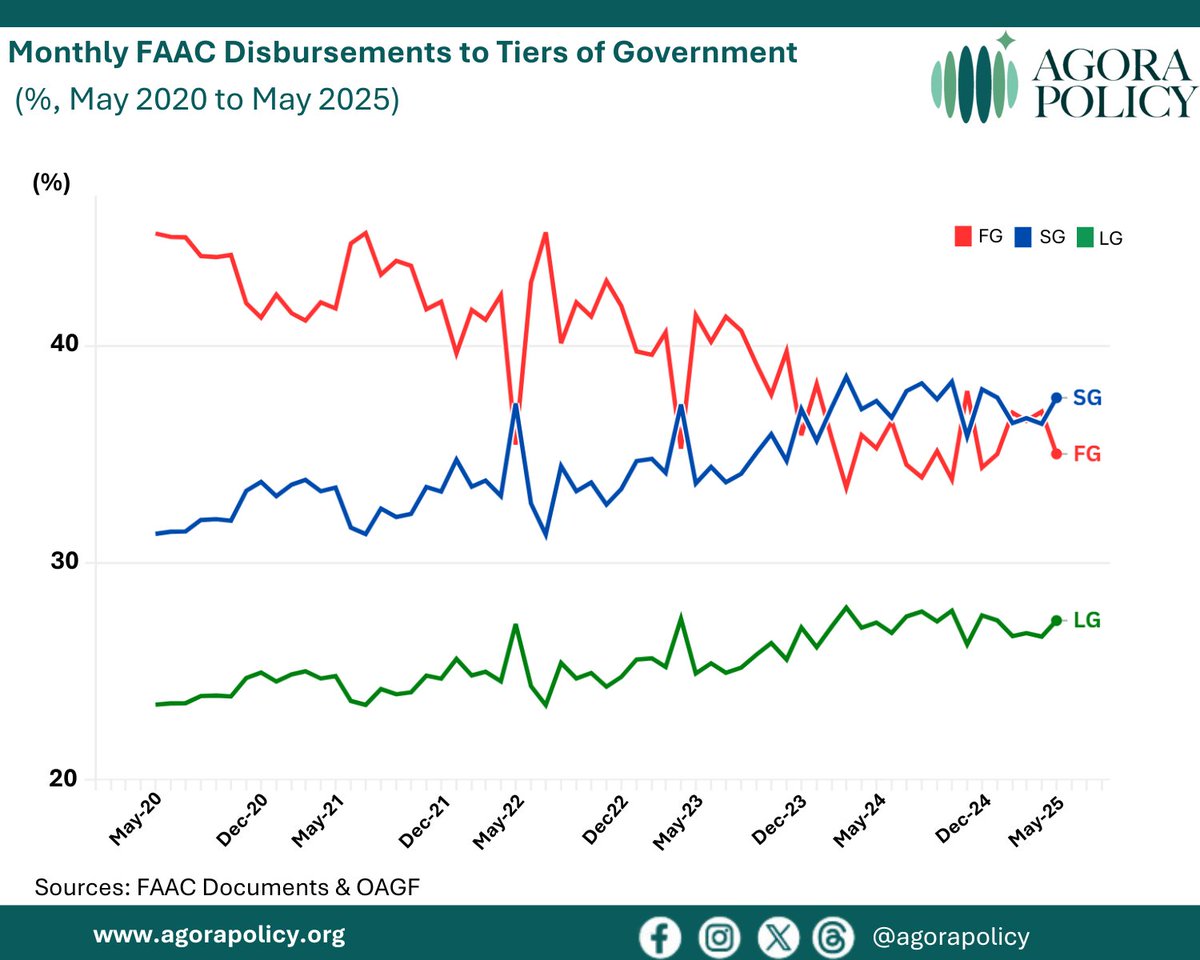
 This compares the sources of Gross FAAC revenue over the period of 4 years.
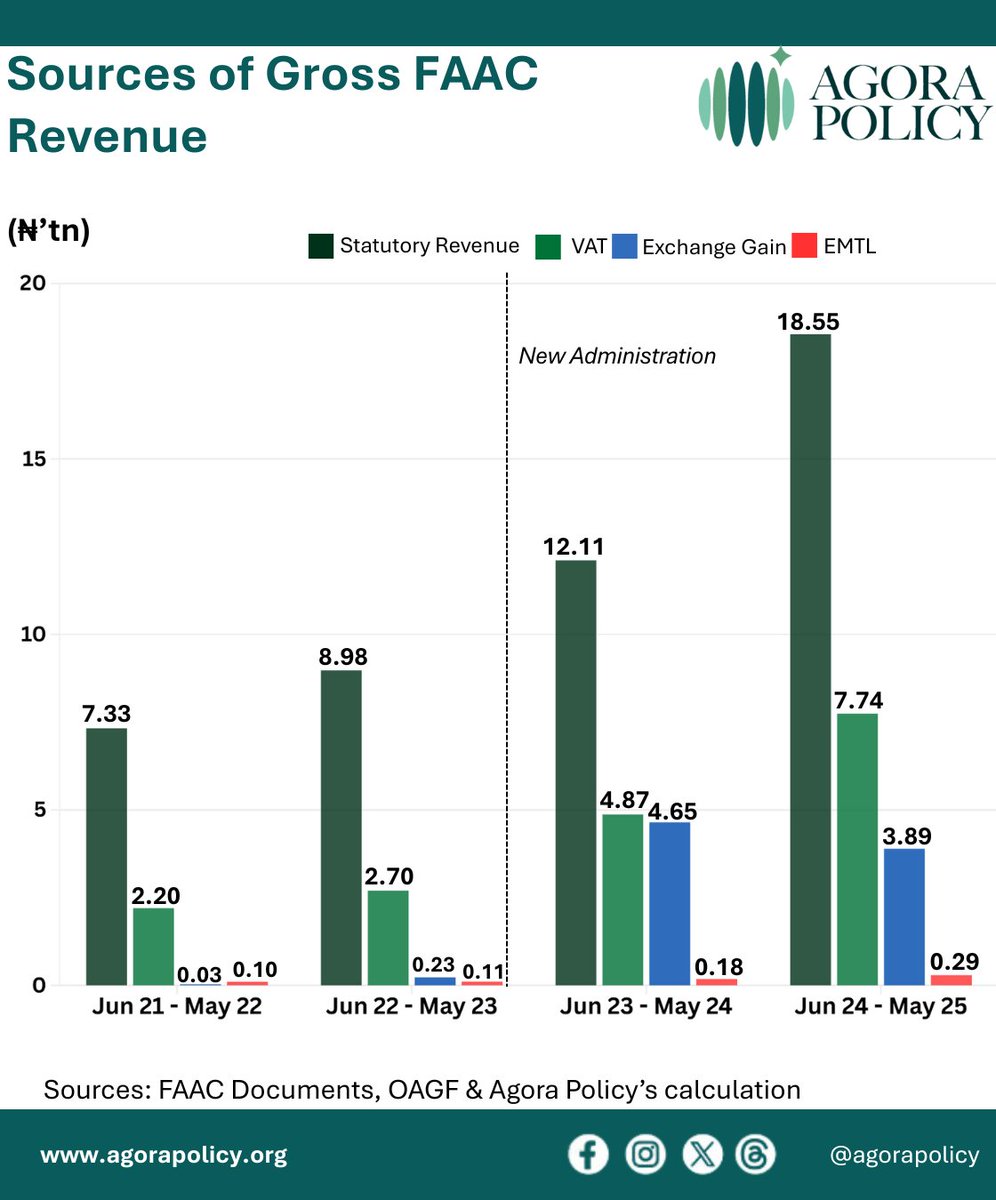
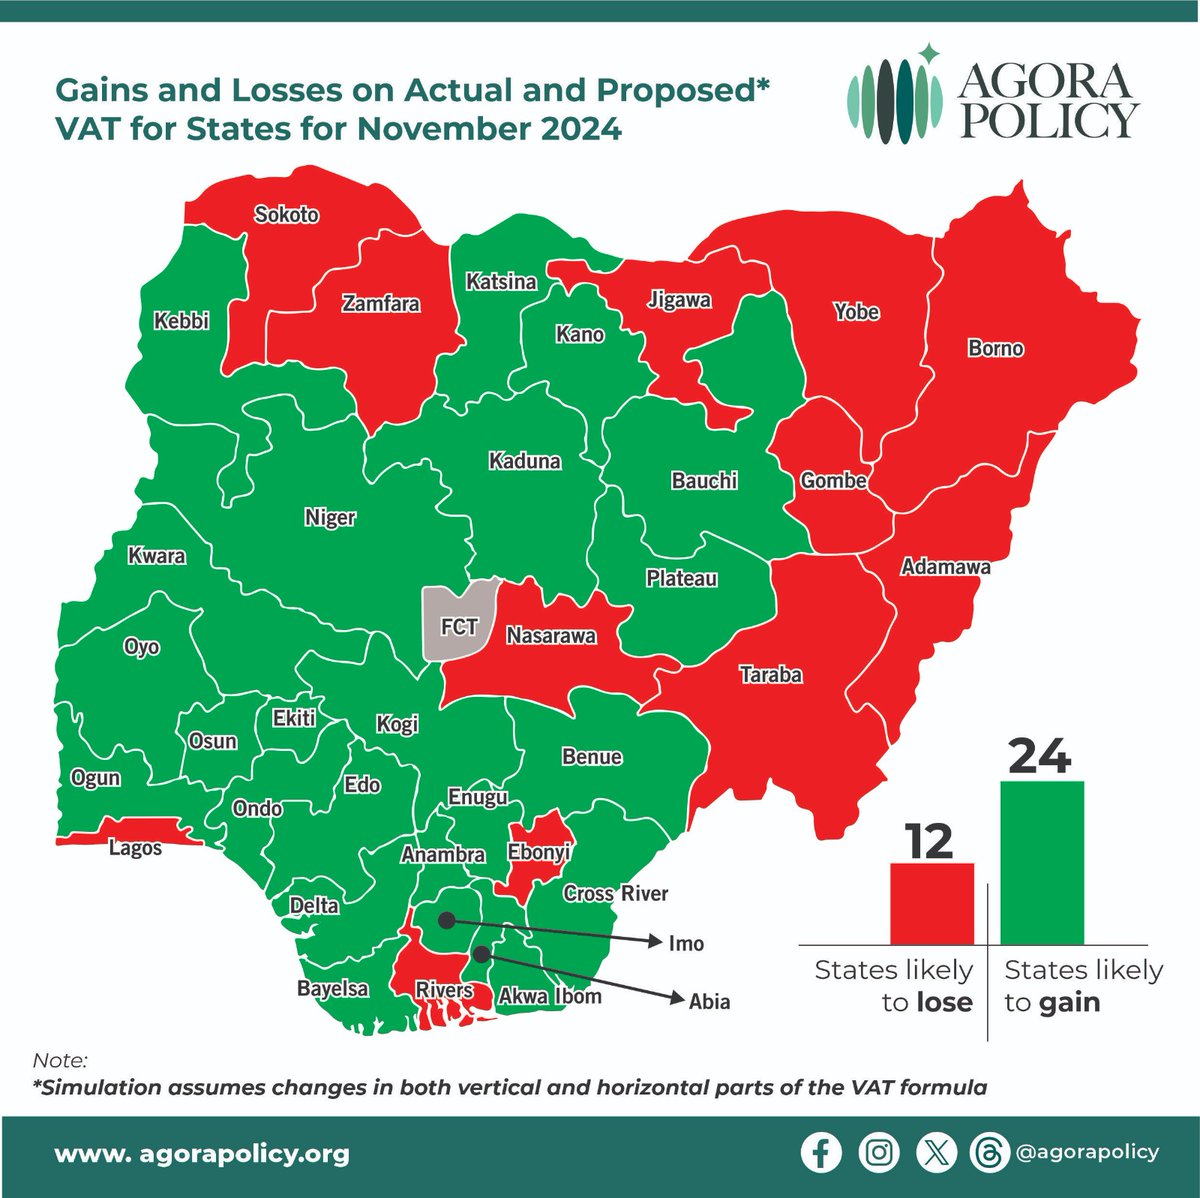
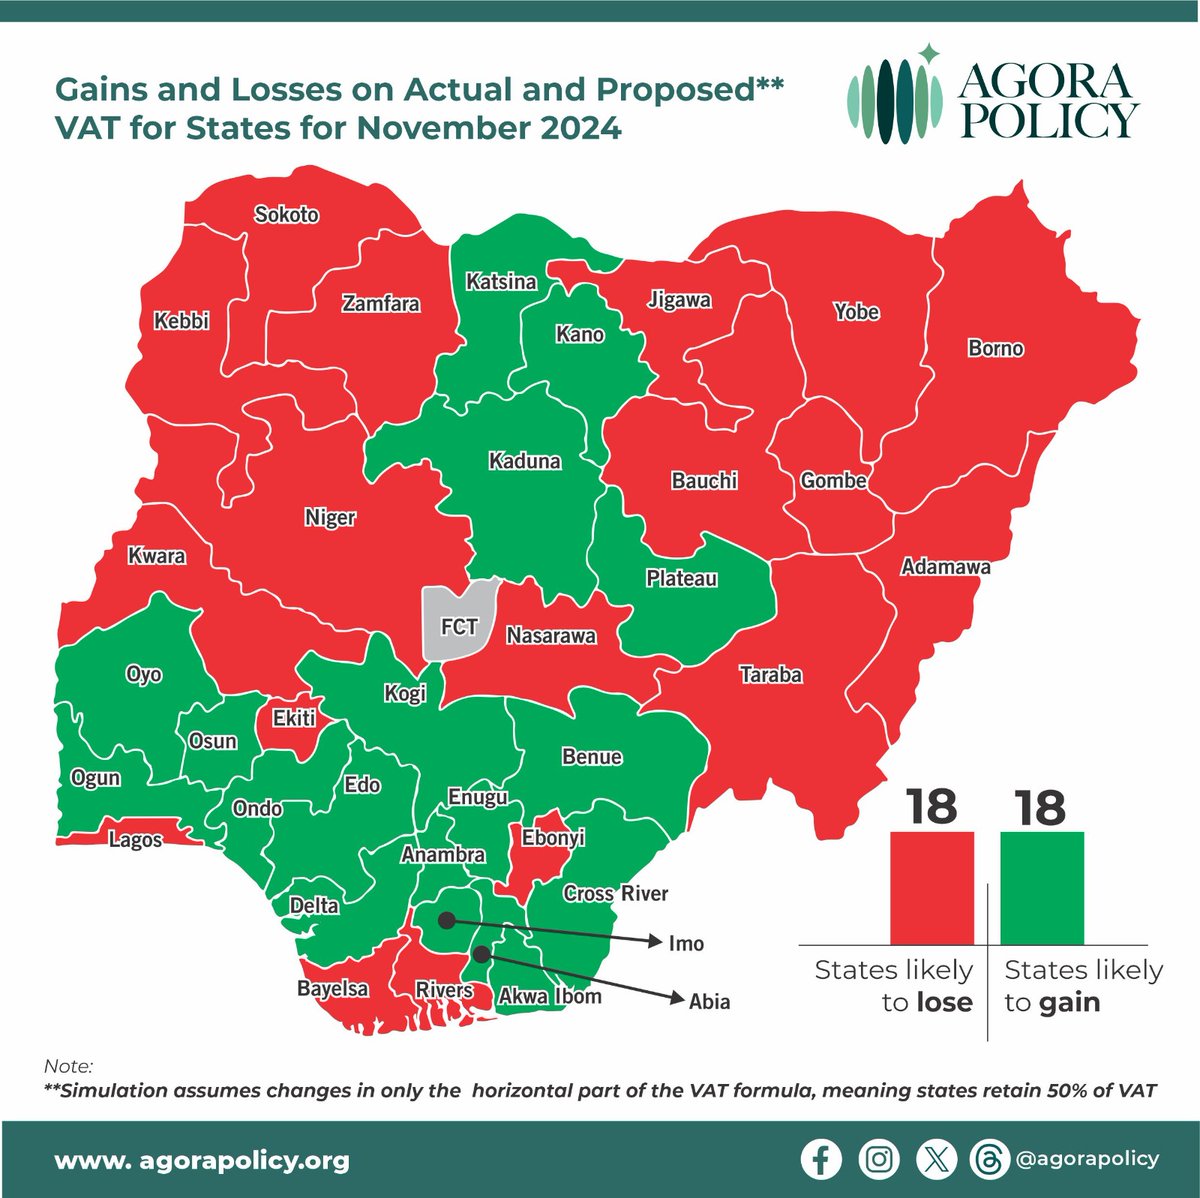 In addition to changes in the horizontal part of the formula, the first scenario assumes change in the vertical part too, meaning states' share of VAT would have gone from 50% to 55%.
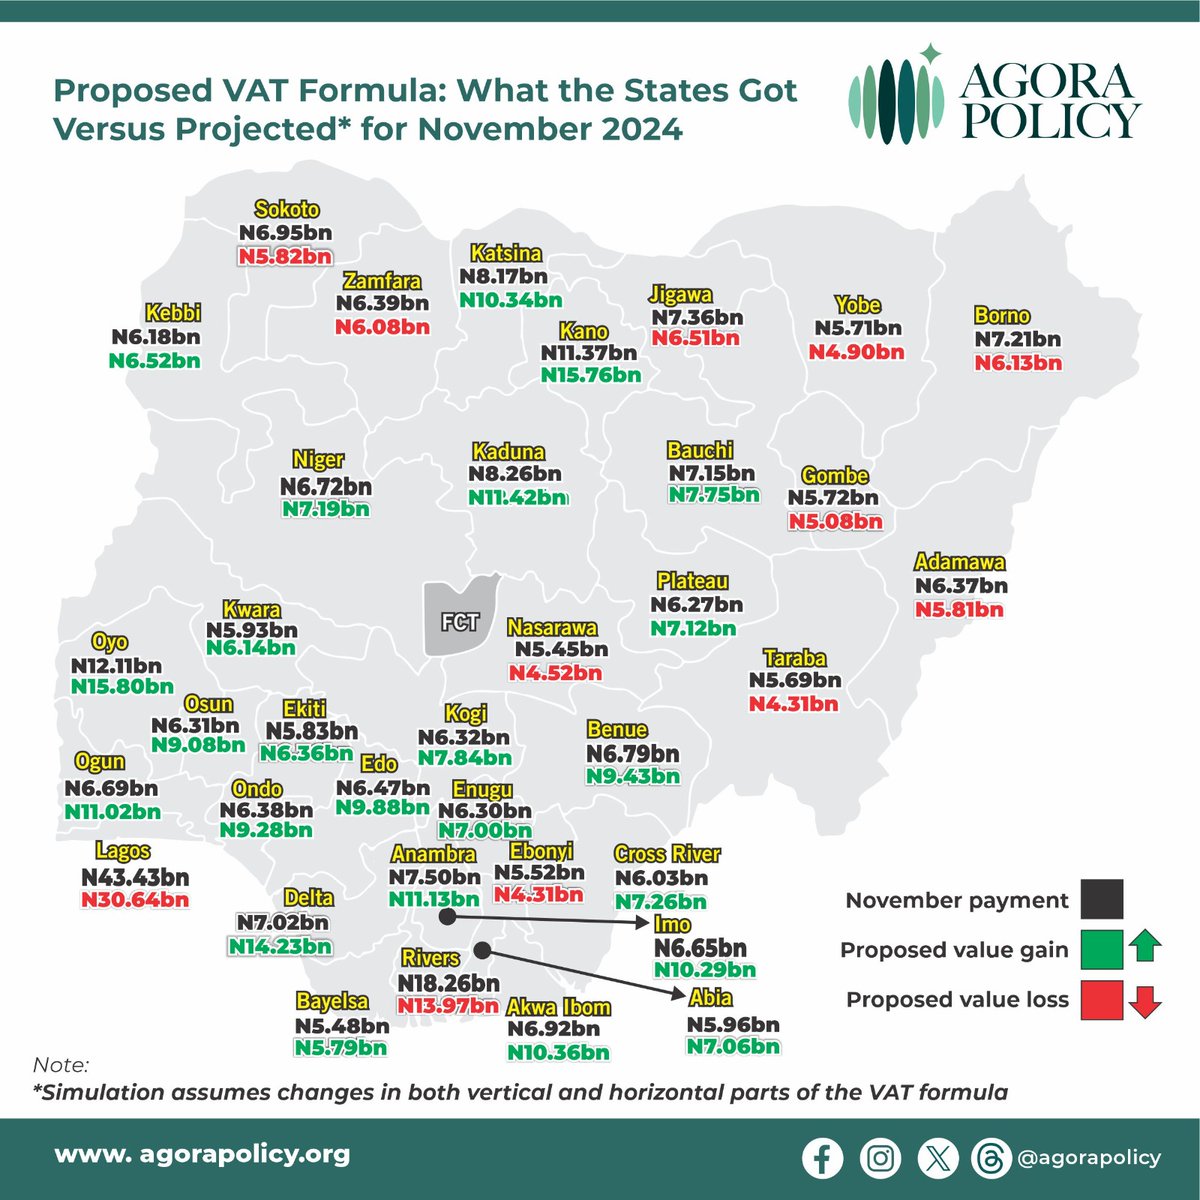
 However, the picture is more even in terms of allocation.
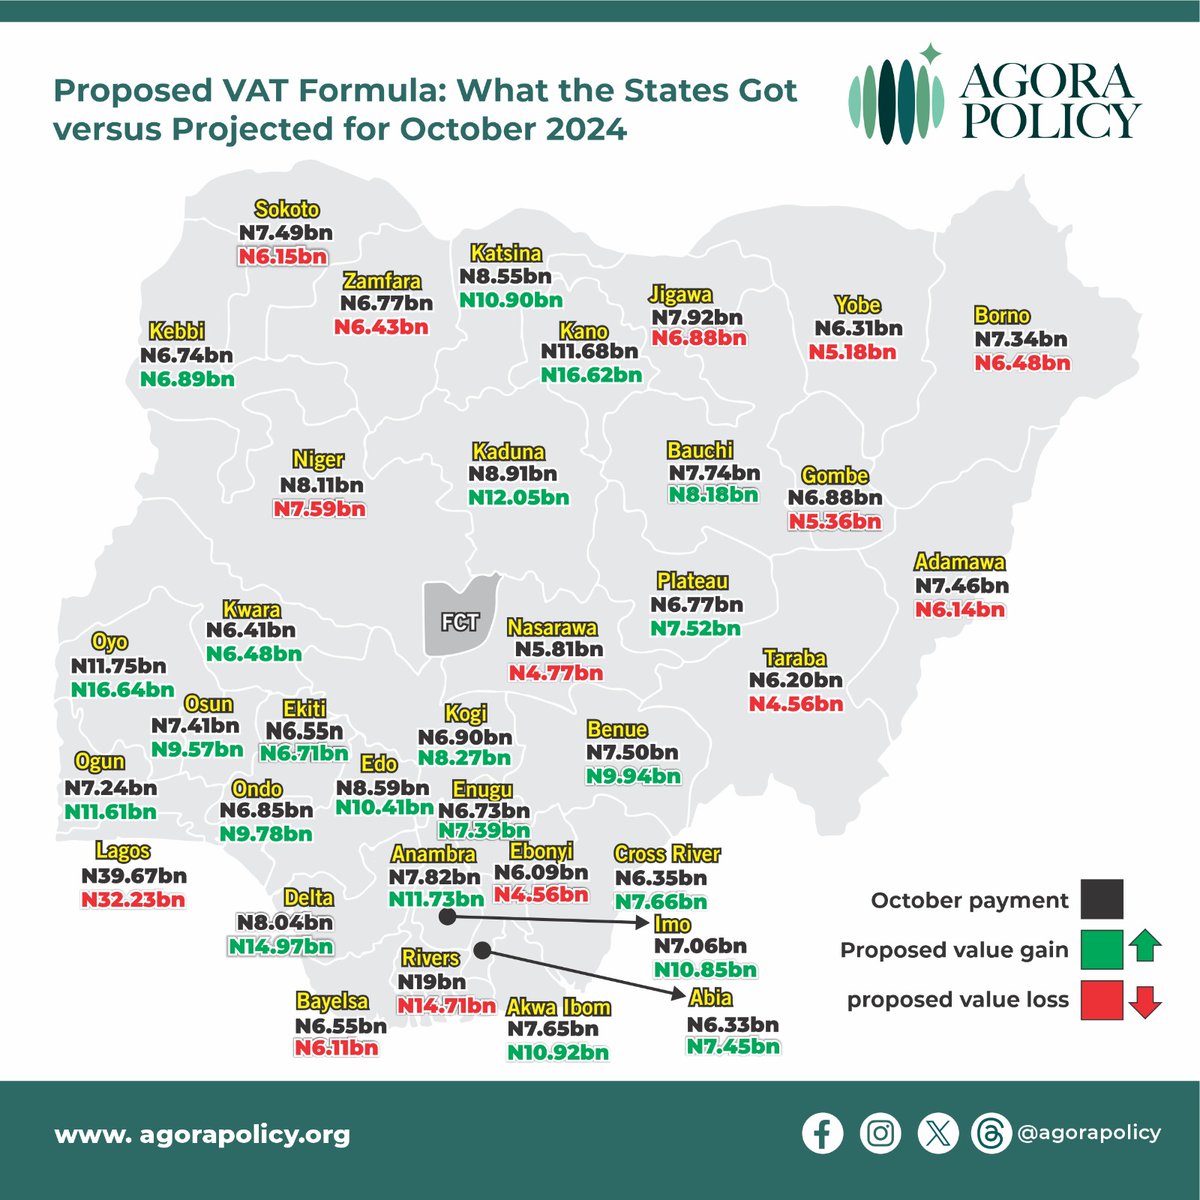 3. The gain ranges from N6.93b (Delta) to N74m (Kwara) while the loss is from -N7.44b (Lagos) to -N344m (Zamfara).
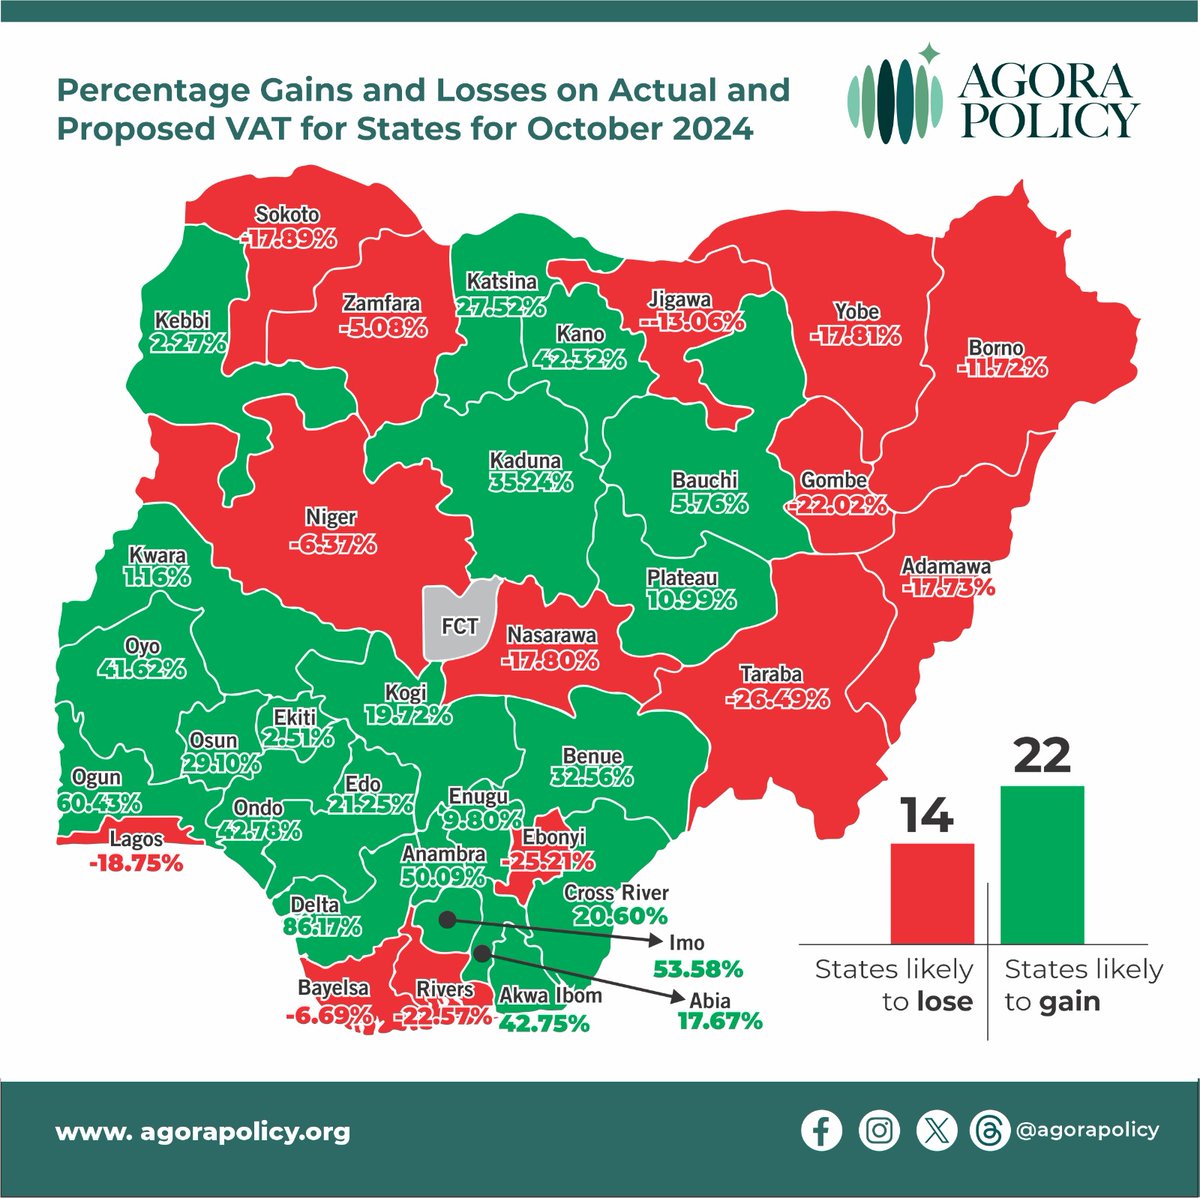
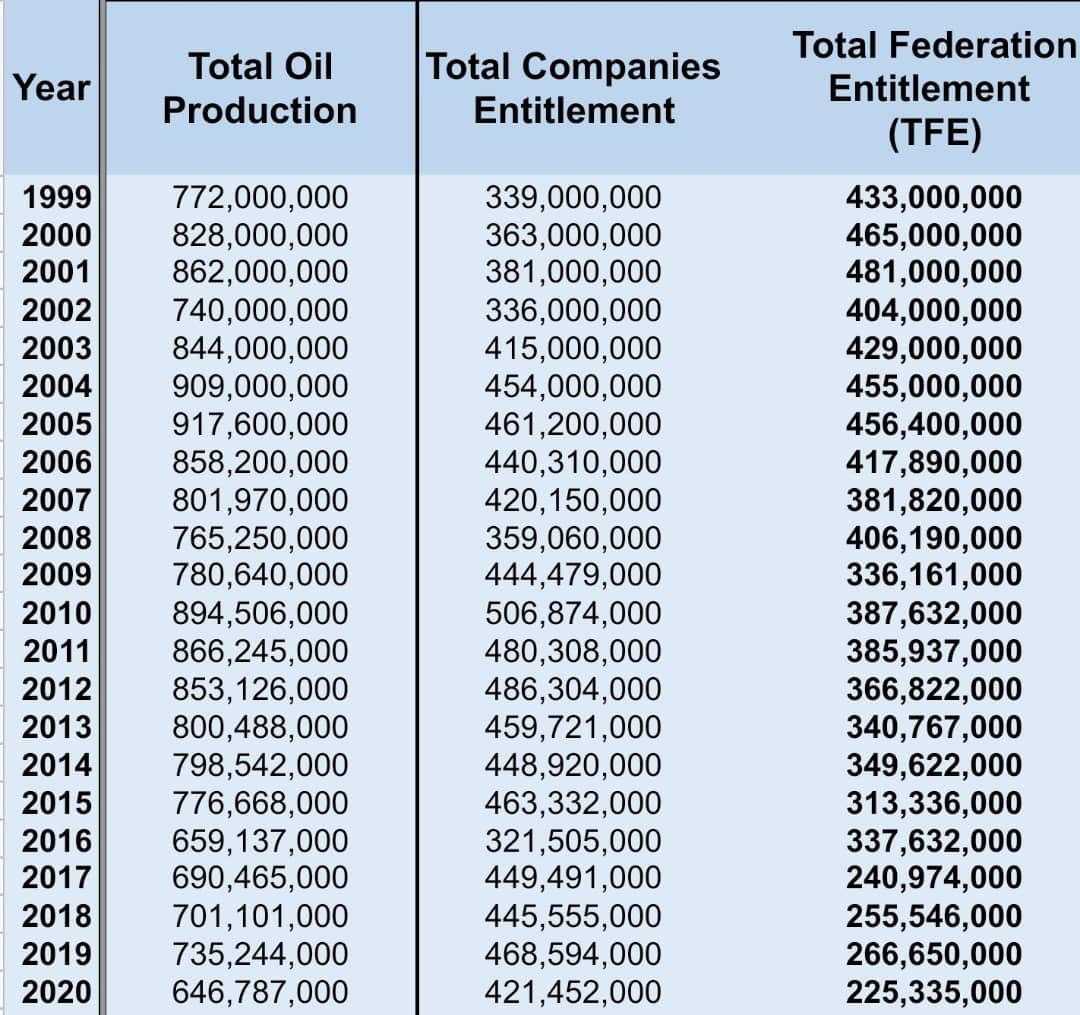
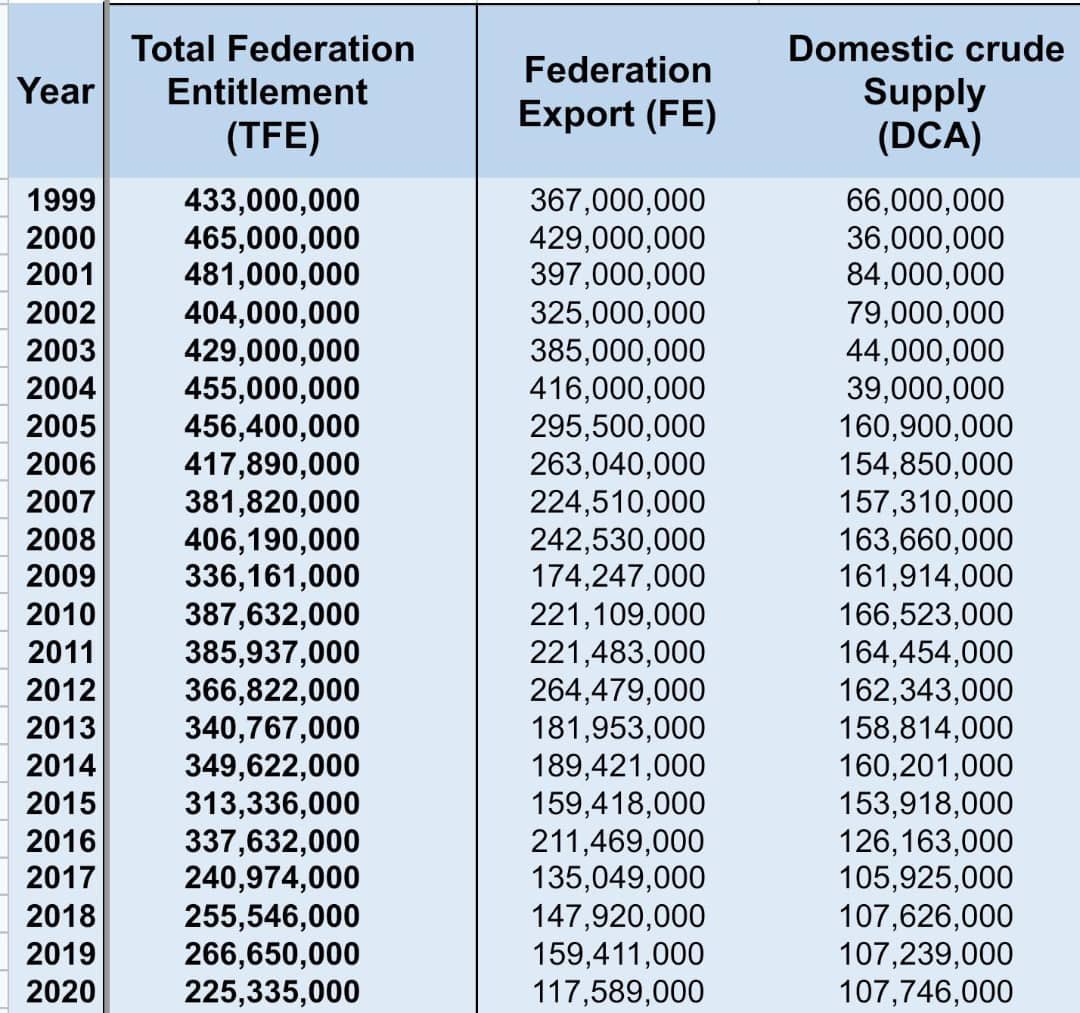
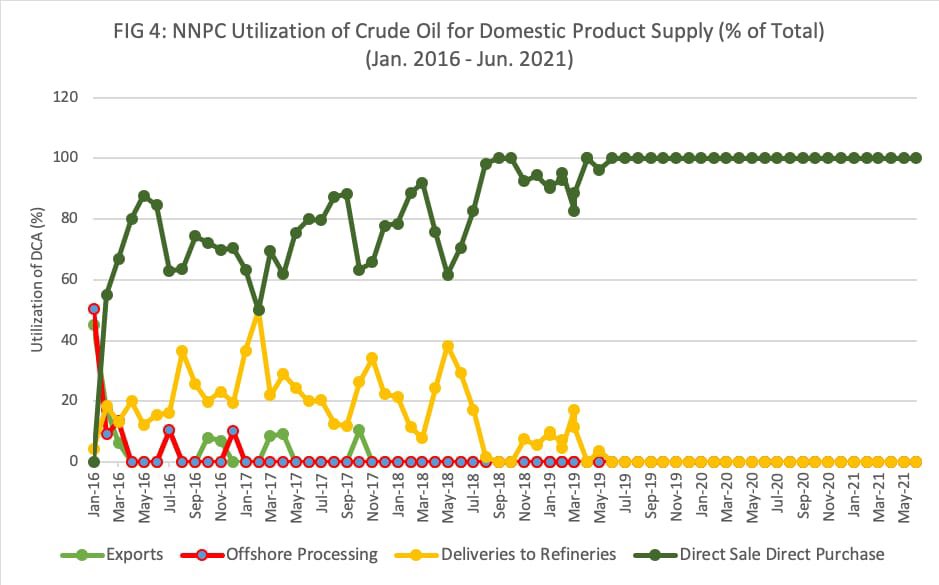 📌 First, some context. Federation's share of oil produced in Nigeria has always been portioned into two: Federation Export (FE) and Domestic Crude Allocation (DCA). FE fetches dollars for the country while DCA is paid for in Naira.