Andrew M. Webb Profile picture
Machine learning R&D | I make maths/science animations | 𝗧𝗼𝗽 π˜π˜„π—²π—²π˜π˜€: https://t.co/6gJsSCJ9yK
Feb 11, 2021 β€’ 7 tweets β€’ 2 min read
A different take on visualizing Simpson's paradox, which (to me) makes it easier to see what's going on

Each group's histogram moves to the left, but the groups change in relative size so that the overall mean moves to the right 1/5 This is the more usual kind of visualization. The relationship is:
- the vertical axis (dependent variable) becomes the horizontal axis of the animation
- the horizontal axis (independent variable) becomes time in the animation

2/5

(Image source: commons.wikimedia.org/wiki/File:Simp…)
Apr 27, 2020 β€’ 16 tweets β€’ 4 min read
Almost none of the probability mass of a high-dimensional multivariate Gaussian is near the mean. Most of the probability mass lies in a narrow shell. 1/ The horizontal axis is the number of dimensions, k. Sample z from a k-dimensional Gaussian with covariance I/k (where I is the kΓ—k identity matrix). The vertical axis shows the probability that the magnitude |z|≀0.95 (blue), |z|>1.05 (green), or in between (orange) 2/
Apr 1, 2020 β€’ 25 tweets β€’ 7 min read
I'm having trouble concentrating on science animations right now, so instead here are some screenshots from my favourite document on the planet.

These are taken from a 'work in progress' document from Pepsi's 2008 rebrand. Every figure is as incomprehensible as this one. 1/23 
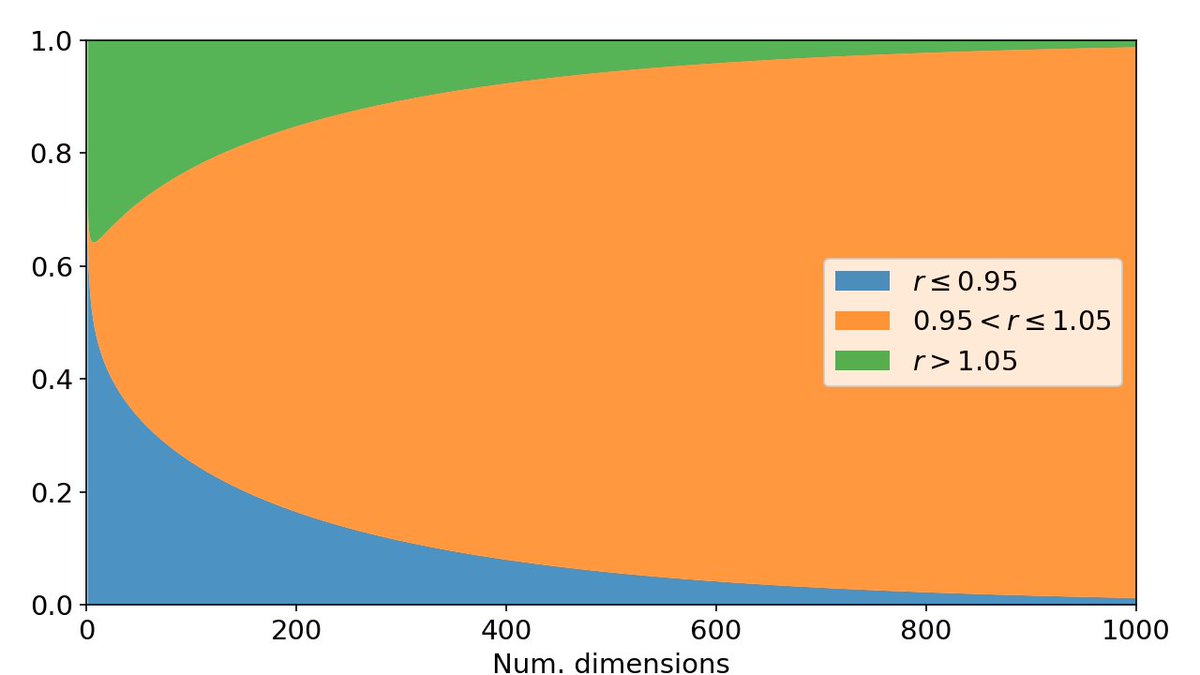
"The investment in our DNA leads to breakthrough innovation and allows us to move out of the traditional linear system and into the future." 2/
Mar 7, 2020 β€’ 7 tweets β€’ 3 min read
A rock paper scissors automaton: green with at least 3 blue neighbours becomes blue, likewise blue becomes red, red becomes green. Initialized randomly. The edges wrap around at the top/bottom and left/right. 1/ The same, but a transition requires at least 4 neighbours. The dynamics are completely different 2/
Feb 4, 2020 β€’ 23 tweets β€’ 5 min read
The names of 100 prisoners are put in 100 boxes. One at a time, privately, each prisoner opens and closes 50 boxes. They are set free if *everyone* finds their own name. Strategy can be discussed beforehand, but otherwise there's no communication. What's the best strategy? 1/23 Clarifying: when a prisoner is opening boxes, the others can't see. He can't tell them what he saw, move names, or tamper. Names are unique. The boxes/names aren't moved in between prisoners. Everyone is released if everyone finds their own name, otherwise no one is 2/
Jan 2, 2020 β€’ 5 tweets β€’ 1 min read
To count an animal population if you can't catch them all: capture some, mark them, release, and capture again. The ratio of new vs already seen tells you something about the total number. Shown here is iterated mark-and-recapture with a Bayesian updates to belief about pop size The left side shows a crude simulation of animals moving around, which are periodically captured. Colour indicates number of times captured. Right side is a distribution describing belief over the population size.
Oct 16, 2019 β€’ 12 tweets β€’ 3 min read
Particle filters are general algorithms for inferring the state of a system with noisy dynamics and noisy measurements. Here's an example with a robot in a circular room. Red=true robot, blue=guesses, occasional red line=noisy range sensor measurement. Details in thread 1/ A particle filter (PF) does the same job as a Kalman filter (KF). Generally: you have a system in an unknown state, evolving over time according to some known dynamics + noise, and you occasionally get noisy sensor data. The task is to infer the current state 2/
Oct 12, 2019 β€’ 21 tweets β€’ 10 min read
So in @sirajraval's livestream yesterday he mentioned his 'recent neural qubit paper'. I've found that huge chunks of it are plagiarised from a paper by Nathan Killoran, Seth Lloyd, and co-authors. E.g., in the attached images, red is Siraj, green is original 
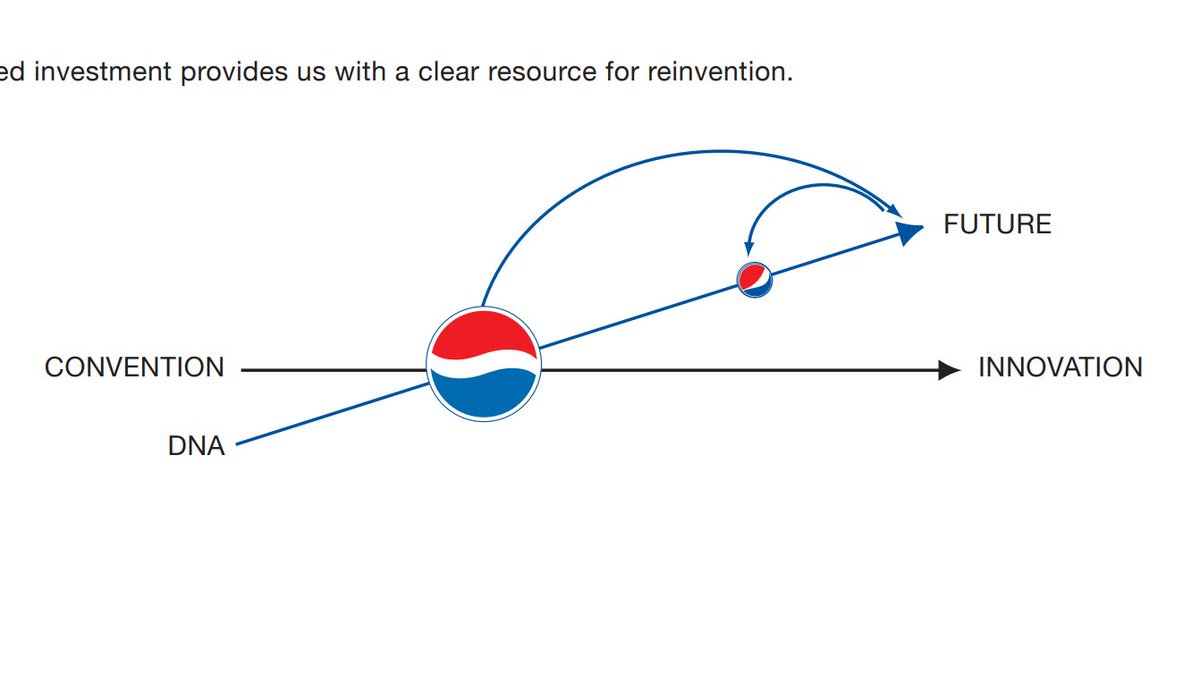
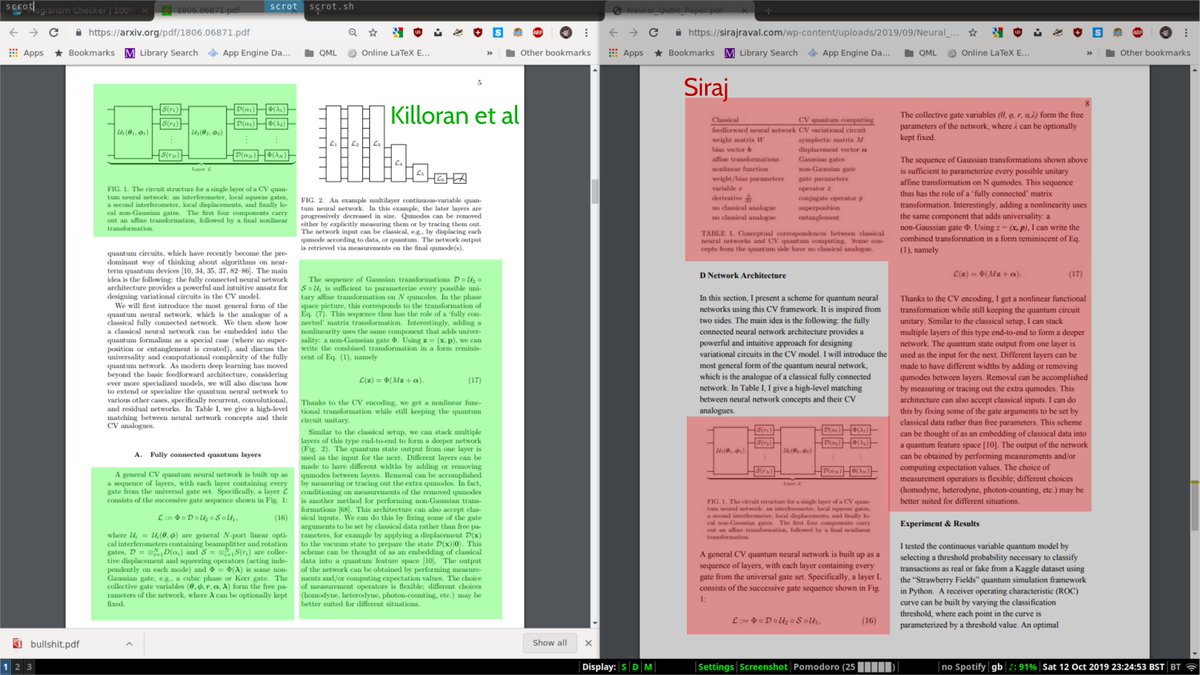
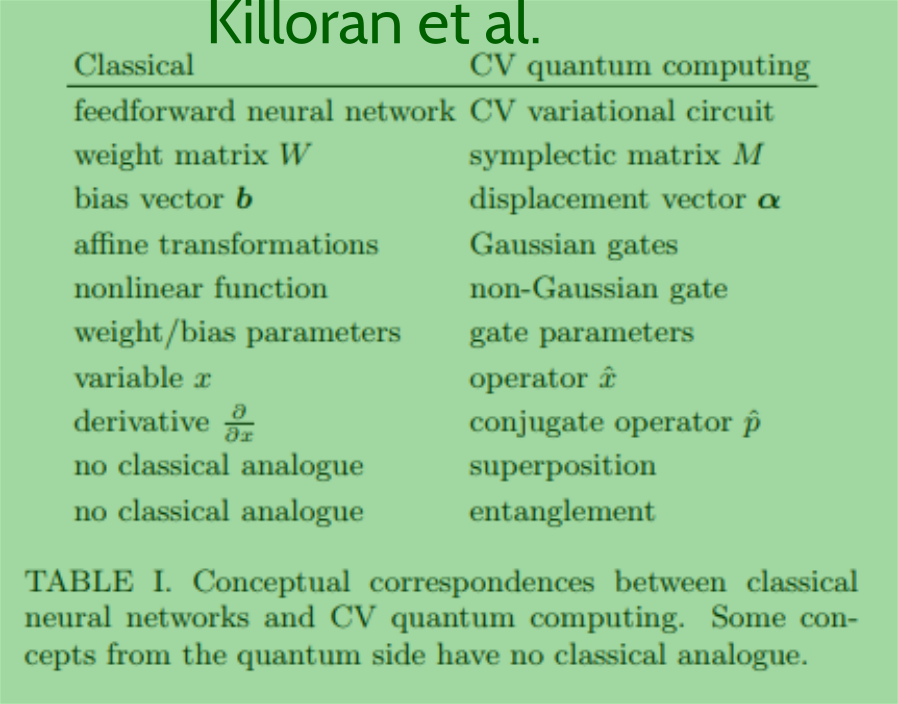
@sirajraval He cites Killoran et al. in the abstract only, and says he presents a model "similar to" it, but the shown parts are almost word for word the same, and the figure, table, and captions are also lifted
Oct 8, 2019 β€’ 10 tweets β€’ 3 min read
A thread compiling some of my favourite tweets and tweet threads: 1/ Orbits in 5D space

2/ A thread on Penrose tilings

Sep 30, 2019 β€’ 13 tweets β€’ 4 min read
The penrose tiles are aperiodic: they can tile the plane, but only non-periodically. Thread: 1/ These are the two rhombic tiles, with their (often omitted for drawing) edge-matching rules. The angle at the top of the larger rhombus is 1/5 of a circle, and maybe unsurprisingly the golden ratio Ο† pops up in their dimensions 2/ Image
Sep 17, 2019 β€’ 13 tweets β€’ 4 min read
You can translate a computer program into a set of tiles: attempting to tile the plane necessarily 'runs' the program. Here's a tiling attempt using tiles from a palindrome-checking program, on inputs 10010 and 10101. Details in thread, 1/n. (I'm fond of this one, please RT) A Turing machine (TM) is a simple model of computation. It has a tape (memory), a state, and a read/write head. A 'program' in this model is a set of rules like "when in state A and reading symbol 0, write symbol 1, go to state B, and move the head to the right" 2/n