Ariel Ortiz-Bobea Profile picture
Applied economics & policy professor @CornellDyson @CornellBPP. Climate, agriculture & environment. Immigrant 🇩🇴.
Jun 16, 2023 15 tweets 3 min read
Have you ever read a paper (or seen a talk) where you feel the author is reading your mind?

Like any concern is immediately addressed right after it crosses your mind?

I think that is a hallmark of great writing, and I have a theory about it.

A thread... 1/12 2/ Think of writing a paper as taking the reader for a walk.

You decide what path you take your reader on (ie you decide what to write).

BUT you can't control where the reader is looking at! (ie you don't decide what your reader thinks).
Jun 16, 2023 7 tweets 2 min read
Don't know who needs this, but you need to get yourself out there in the arena.

I know of very talented people who stay isolated in their corner trying to craft the perfect study on their own.

Don't do this. It's not healthy and even reduces the chances you get published. By the time an econ study gets published, it's old news.

You should share your work with others in various forms MUCH earlier.

You need to build a plan how to get feedback and share your work, *especially* if you are introverted.
Jul 1, 2021 7 tweets 2 min read
The data section of a paper does not need to be boring.

The data section is actually an opportunity to present a compelling narrative to justify or defend your data choices.

A thread.

1/6
I often see data sources and summary statistics presented like a dry list of ingredients.

"I obtain data on A from data source B. Table 1 shows the summary stats, yada yada, etc..."

2/
May 26, 2021 11 tweets 4 min read
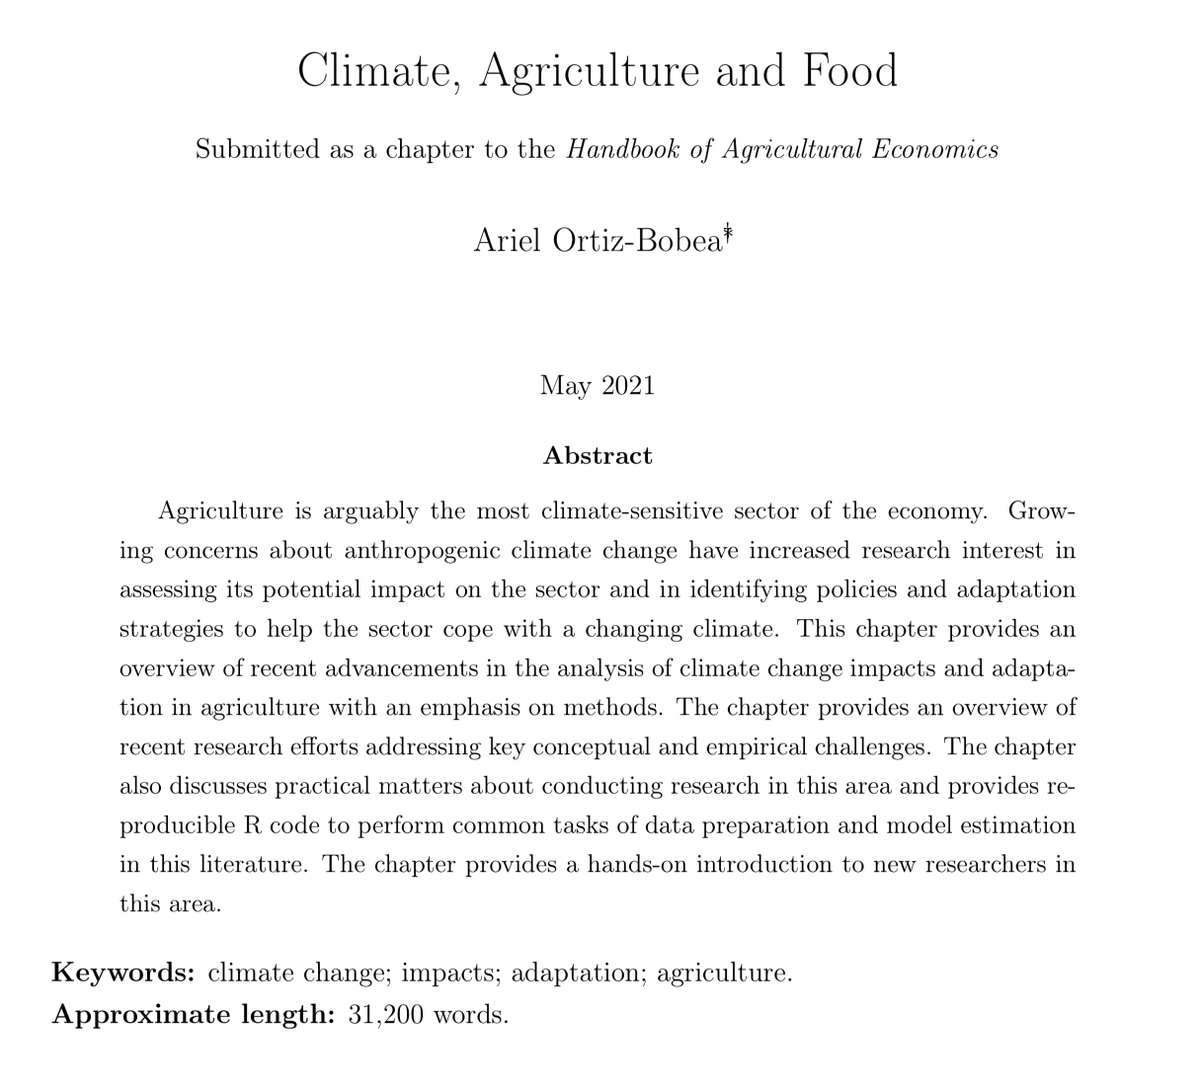
Just uploaded a pre-print of my chapter "Climate, Agriculture and Food" for the Handbook of Agricultural Econ: arxiv.org/abs/2105.12044

Excited to include a hands-on section (w/ R code) to introduce the reader to many common empirical tasks from data processing to estimation. Code and data to reproduce all the figures and tasks discussed in the chapter are hosted here: archive.ciser.cornell.edu/reproduction-p…

Thanks to @CISER_CU's amazing staff for helping me host these data permanently and open to all.
Apr 1, 2021 11 tweets 5 min read
Our @NatureClimate paper out today shows that anthropogenic climate change has already slowed global agricultural productivity growth. 1/

Link to paper: rdcu.be/chUvW

Press release w/ video: news.cornell.edu/stories/2021/0…

Code+data: doi.org/10.6077/pfsd-0… This is joint work with colleagues at Cornell (@TobyAult @CarlosMCarrill5), Maryland (Bob Chambers @UMD_AGNR) and Stanford (@DavidBLobell). 2/
Dec 1, 2020 10 tweets 4 min read
Quick thread on tackling a revise & resubmit of your manuscript (ms). These are the steps I follow when I'm the lead/corresponding author. I'm sure others have other strategies, so feel free to chime in. Step 1. CELEBRATE you got an R&R! Very important. Rejection is the norm, so we have to ensure we celebrate every big (or little) step of the accomplishment.
Aug 7, 2020 7 tweets 1 min read
Trying to stay calm, but I'm 7 days away from not being able to work in the US.

I'm a tenured professor at a major university and the US government is pushing me over the brink.

Been waiting for 3 mo (instead of 2d) for the US govt to *print* my already approved work permit. The worst part is that I'm not alone. There's about 75,000 other immigrants with approved permits waiting for their piece of paper.

May 1, 2020 4 tweets 1 min read
Writing tip about robustness checks.

1/ first express the specific concern the reader may have about your findings, then 2/ present an idea that motivates an approach of addressing it, & only then 3/ describe what your check actually is & what you find. Example: "One concern is that our model overfits the data (step 1). An overfitted model tends to perform poorly out of sample (step 2). We thus conduct a 10-fold cross-validation exercise and find that our model reduces the prediction error relative to some other model (step 3)."
Mar 10, 2020 16 tweets 5 min read
As promised, here is some base #rstats code to generate a specification chart.

I'm including a reproducible example so you can understand the possibilities and how to customize the chart.

Feel free to share. Let's make appendices shorter!

github.com/ArielOrtizBobe… This is how the basic chart looks. Fairly plain.
Dec 12, 2018 17 tweets 7 min read
1/ My research article out today in @ScienceAdvances shows U.S. agriculture has become considerably more sensitive to climatic shocks since the 1980s in key core regions like the Midwest.
- Cornell Chronicle: bit.ly/2PyLwF2 (w/ video)
- Paper: bit.ly/2UGLpuP 2/ This is joint work with @Barefoot_Econ and Bob Chambers (Maryland) and was funded by @NSF and @USDA_NIFA. I also thank @AtkinsonCenter for their support.