Head of Macro Research at Global Macro Investor https://t.co/TBWOM0tODa | Head of Asset Allocation at EXPAAM https://t.co/CPCWy0eHx8 | My opinions only DYOR
 The log regression channel says the same:
 Remember, SLOOS just equals current ISM…
 The “credit crunch” that everyone is talking about IS coming…
 Back in 1990, CPI rose to 6.4% year-on-year (near ten year highs at the time), igniting fears that the 1970s were returning with a vengeance…
 This is also interesting when you take into account that ISM New Orders minus Inventories is likely in the process of bottoming and leads commodity prices by seven months.
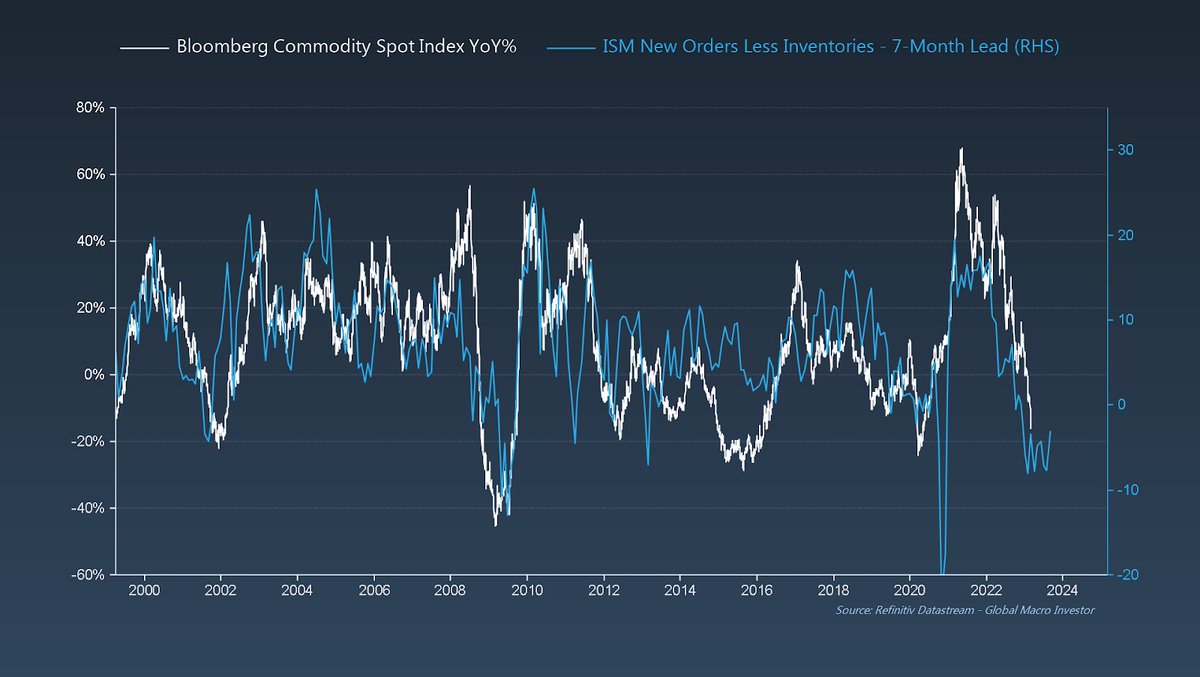
 If you look at the Atlanta Fed's measure for "Flexible" CPI, so basically commodities ex. food and energy (i.e. household supplies, appliances & clothing), the measure has done a full round trip: 19.7% in Feb 2022 to just 0.1% in Jan…
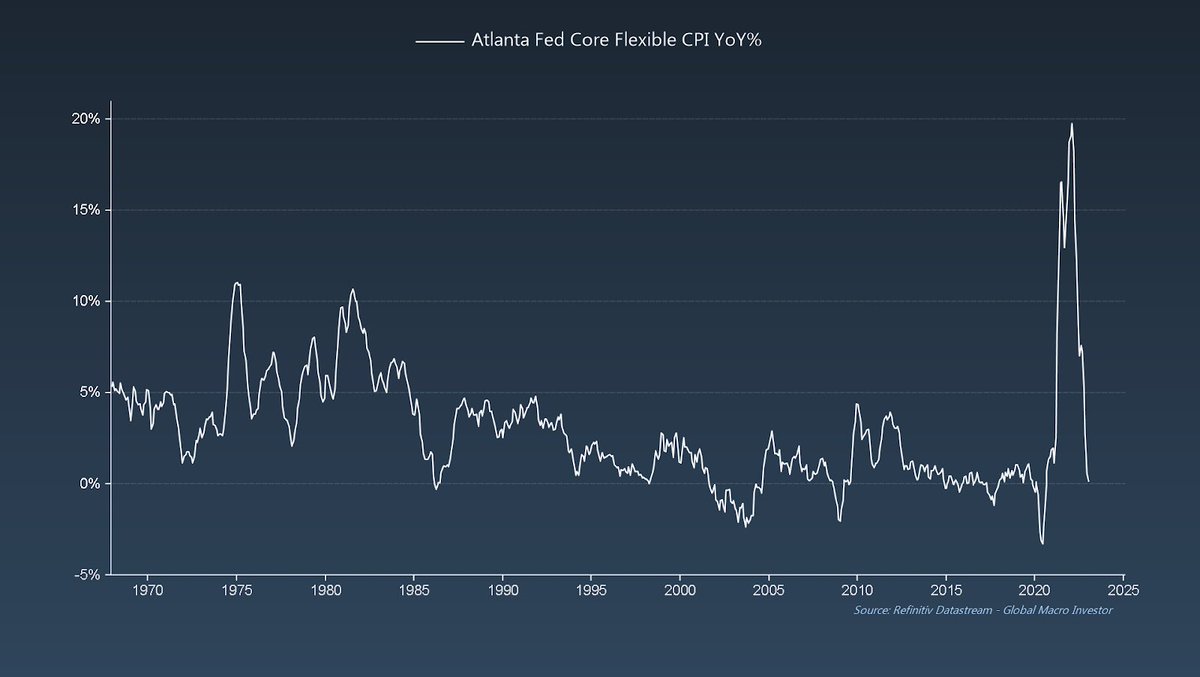
 The main driver of this slowdown has been China…
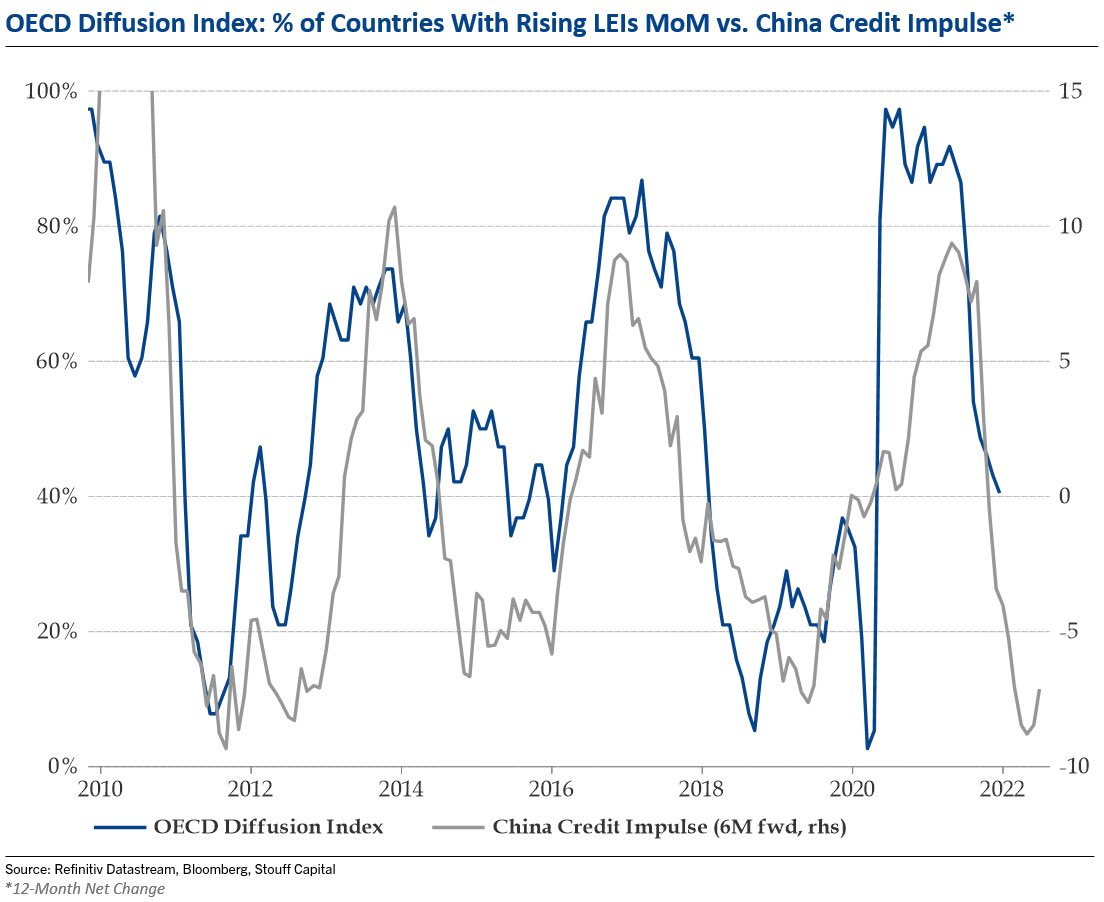
 Same for equities vs. bonds...
 Speculators are back to being near record short DXY as a % of total OI.
 While there’s still room for a further rise in EM PMIs into year-end, the % of EM OECD countries with rising lead indicators MoM is down to 67%, from 100% in July.
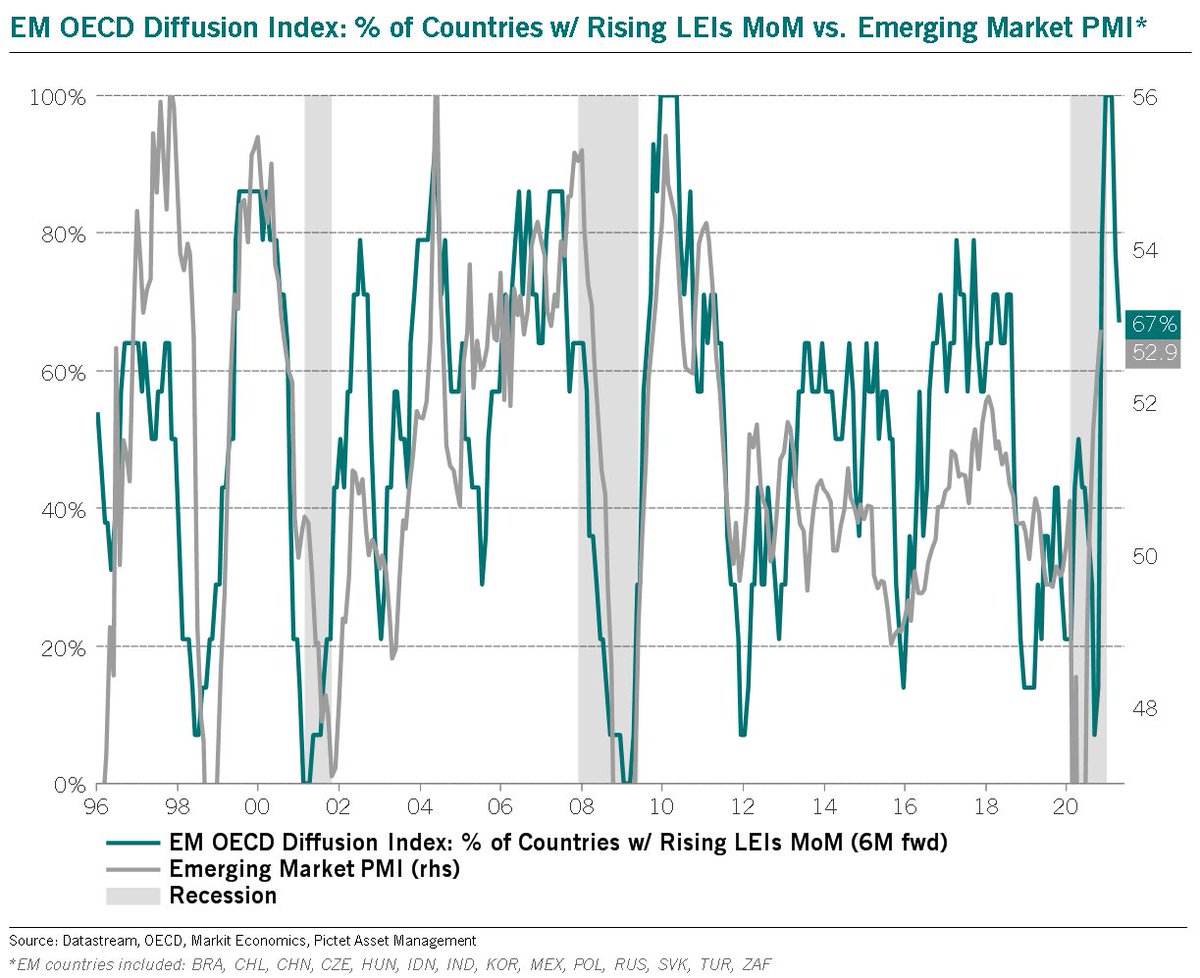
 2) A close below long-term support would be a clear negative, but for the time being we continue to hold.
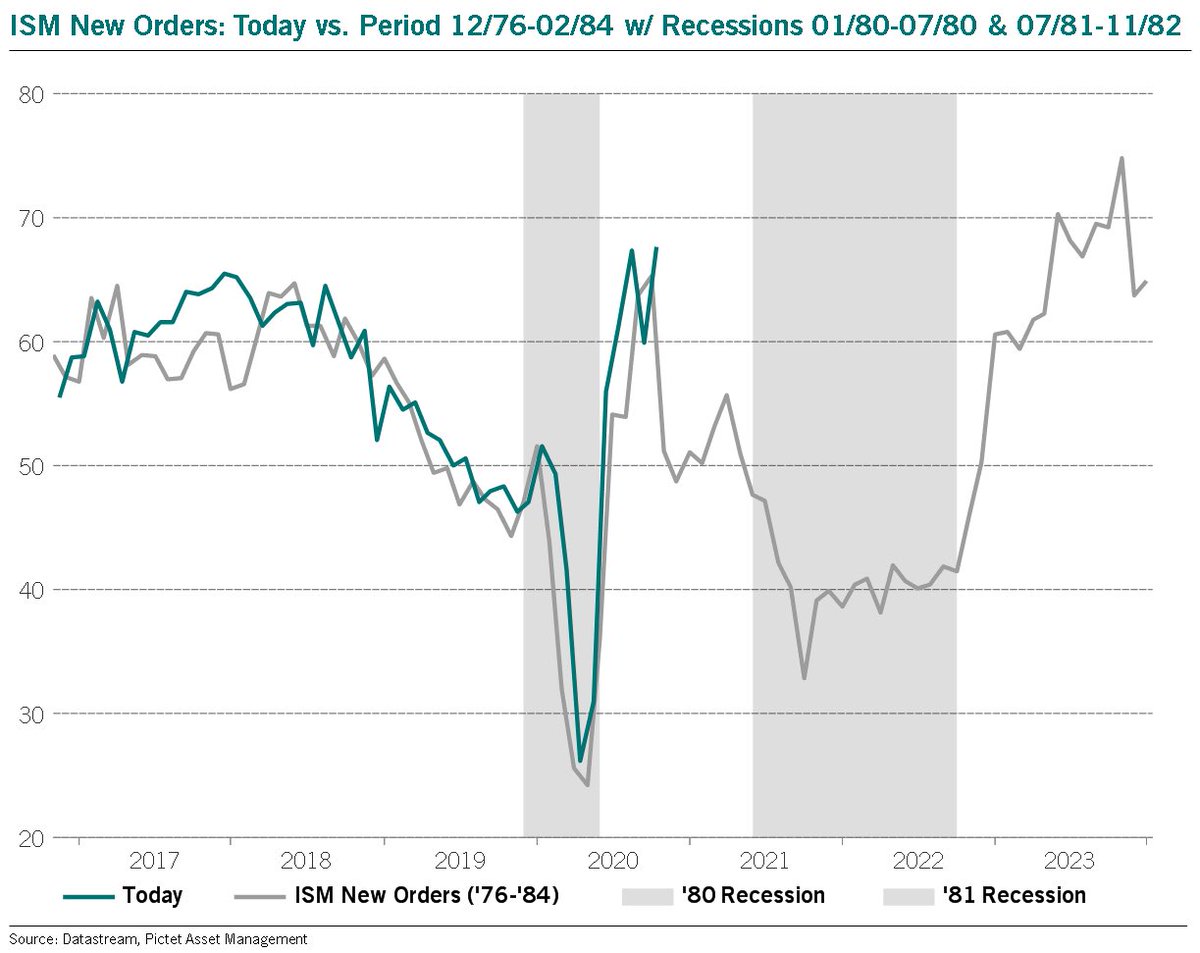 Even the magnitude of the move is identical: a 40pt rise over 6M.
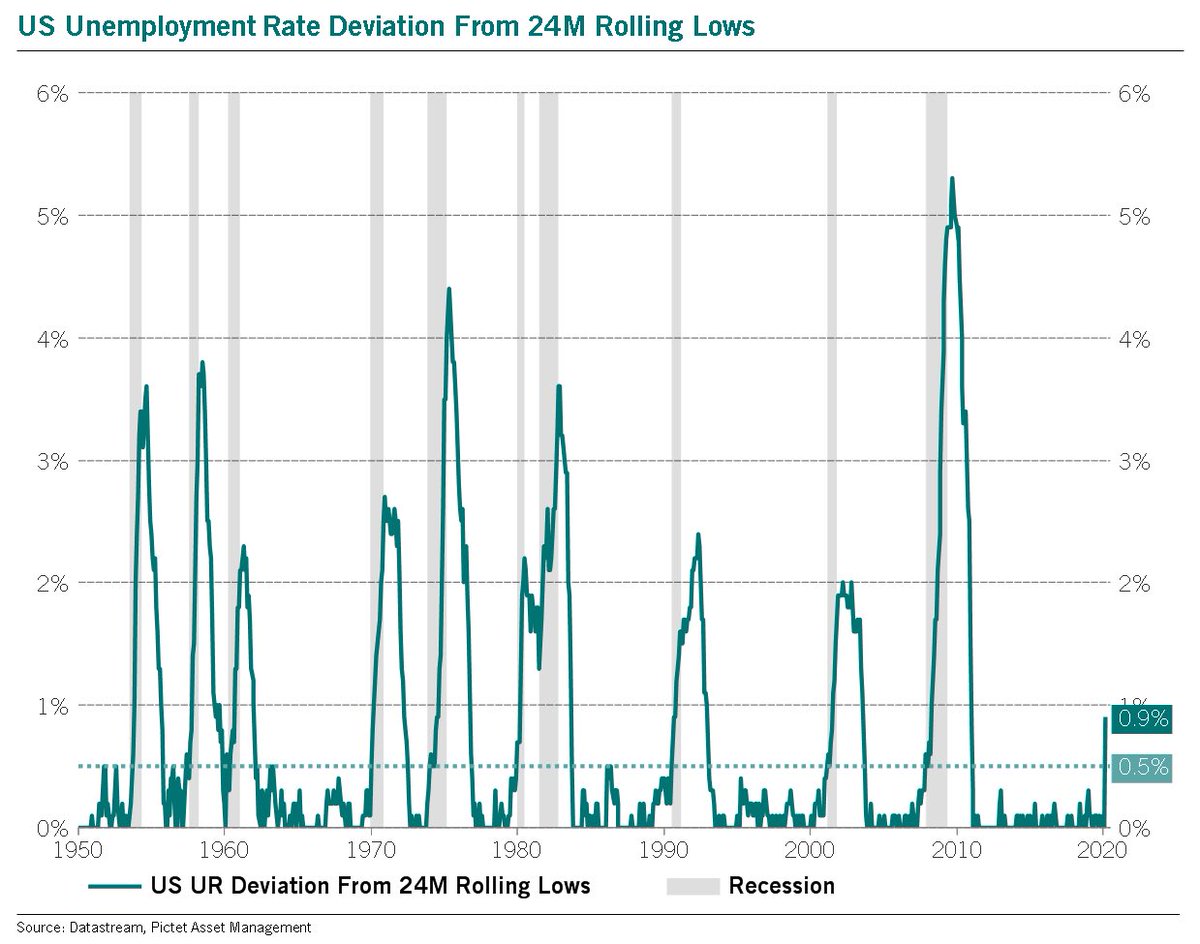
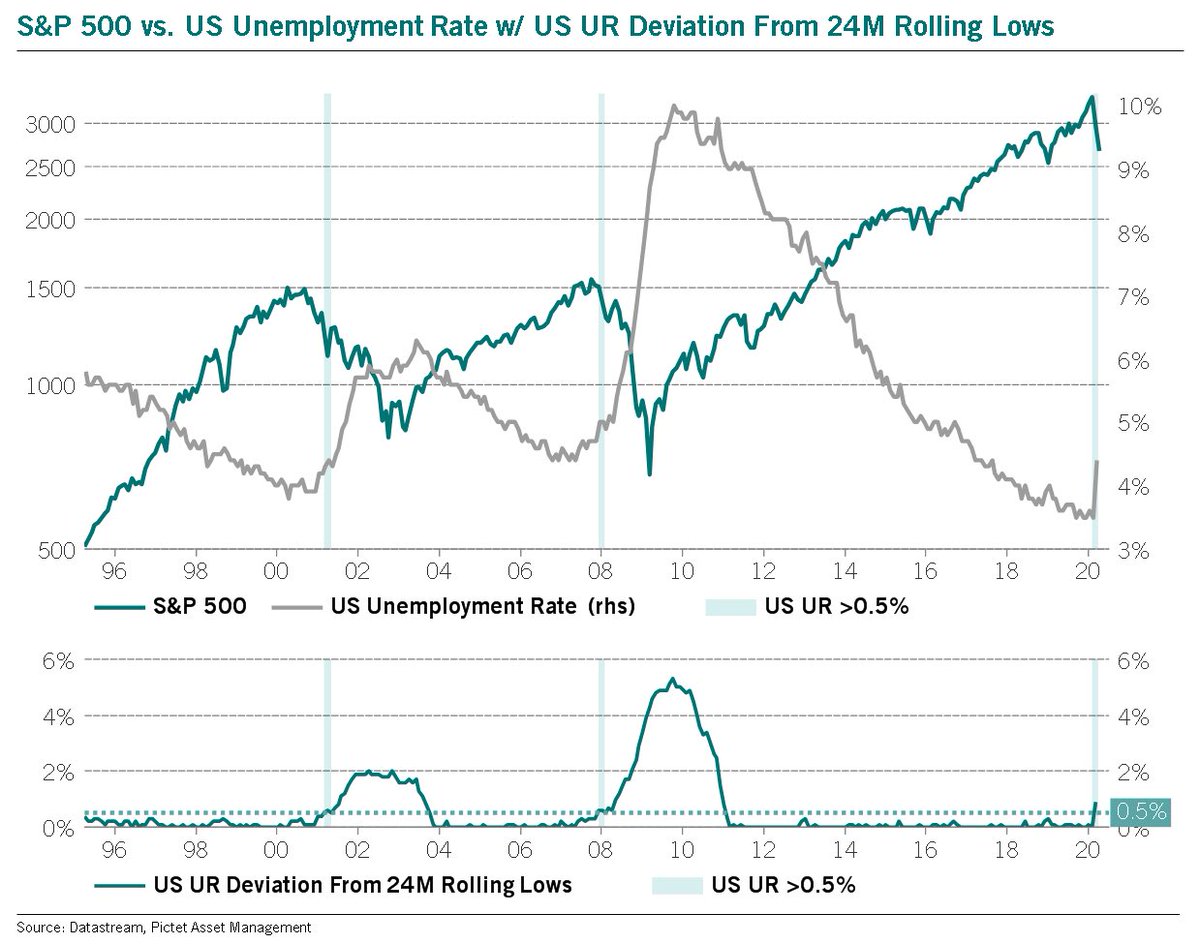 Here is the long-term chart of the US unemployment rate deviation from 24M rolling lows. A monthly close above 0.5% has a 100% track record over 70Y at signalling a recession.