"The Anti-Fragile Investor" | I demystify the stock market | My portfolio: https://t.co/w0anZAuv92
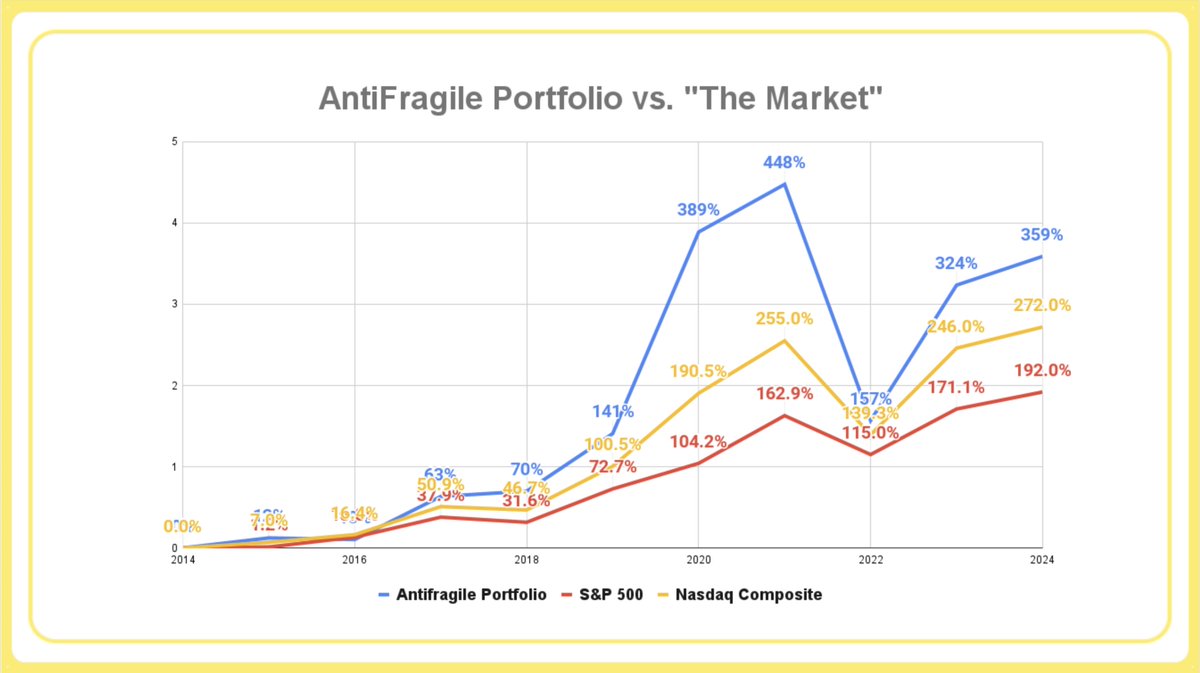
 Just to dispel any rumors, this 22.6% is NOT because I'm matching the market.
 The stock: DataDog (DDOG)


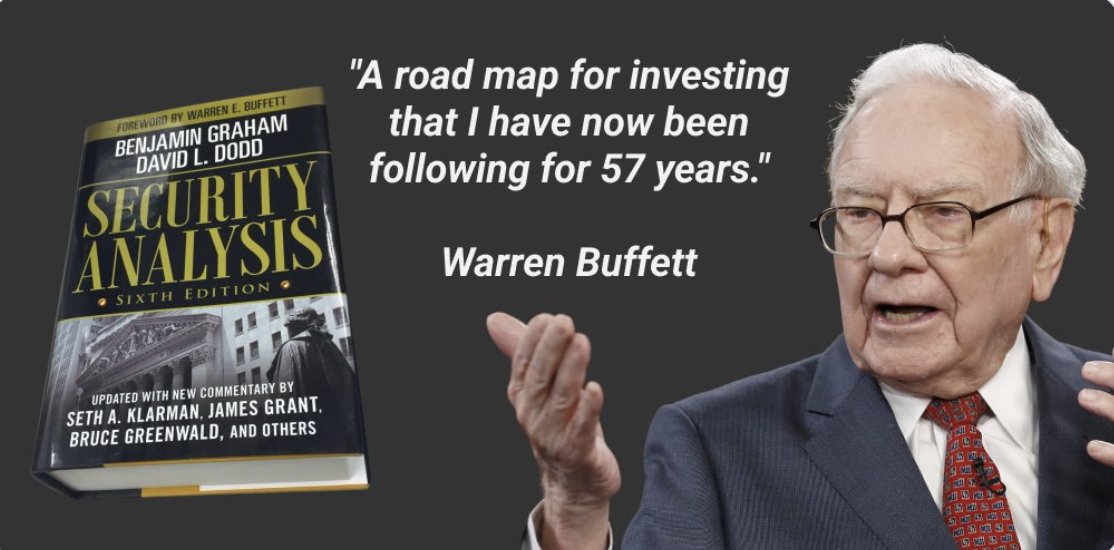 1. Investing versus speculating
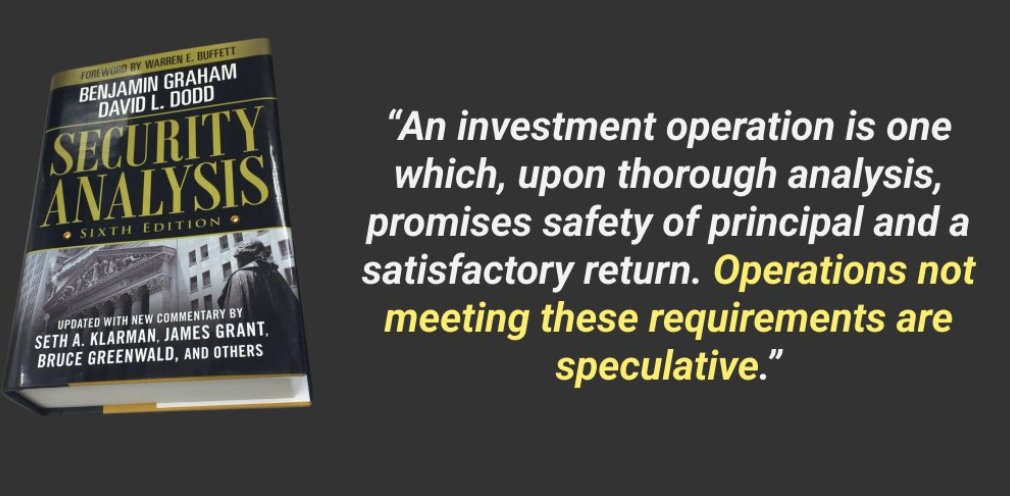


 What do I mean by "Moat"?
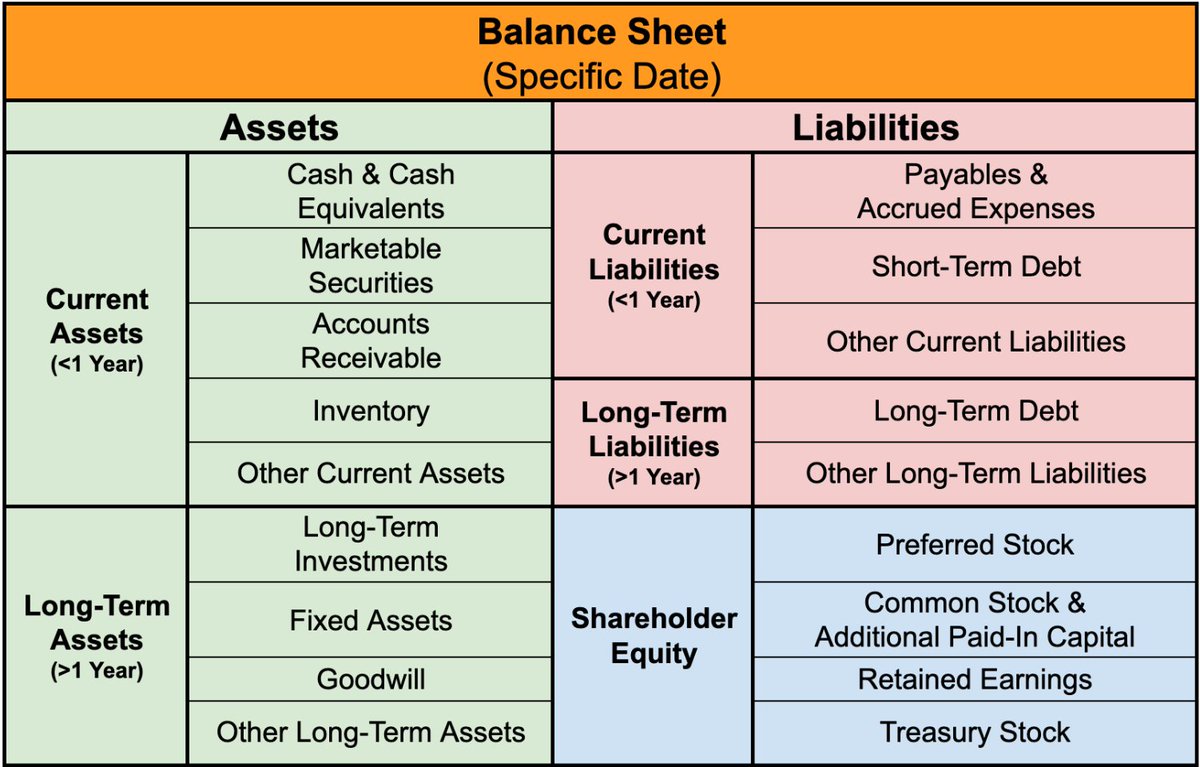 The balance sheet is one of the 3 major financial statements.
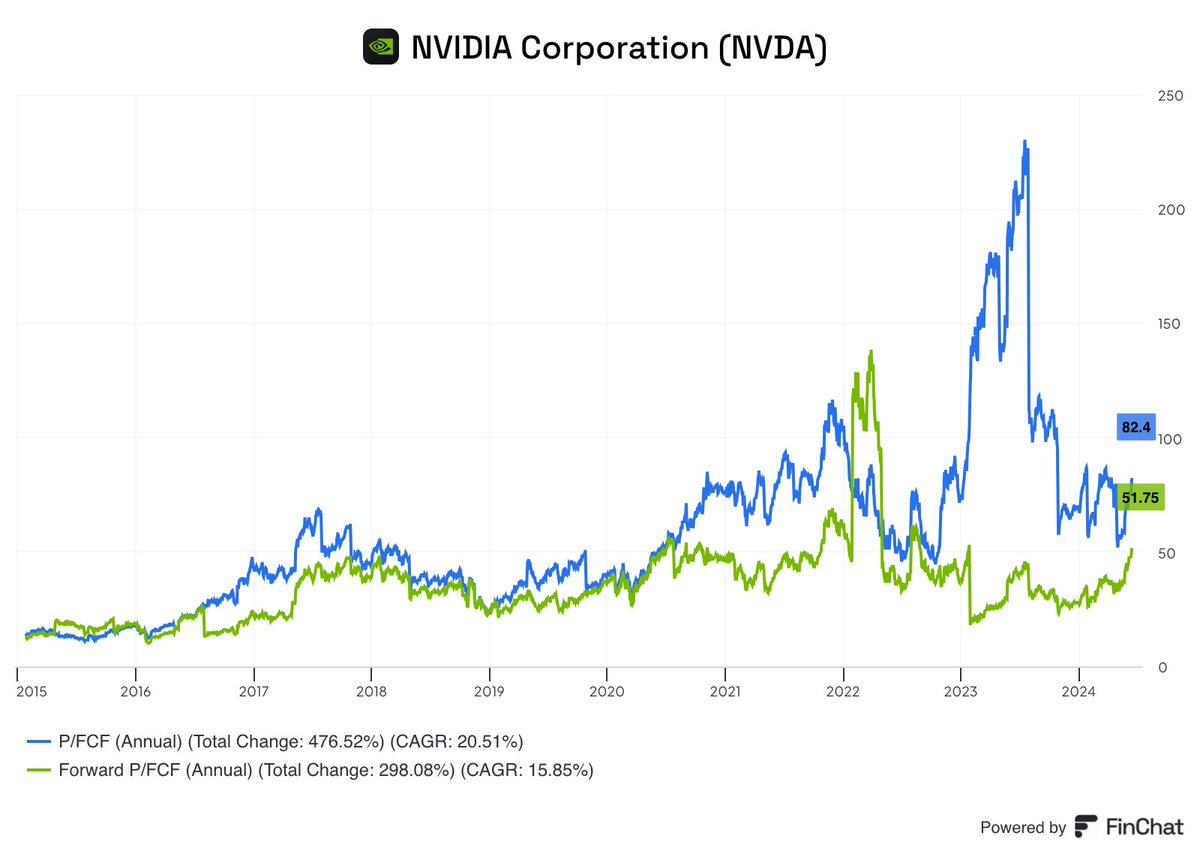
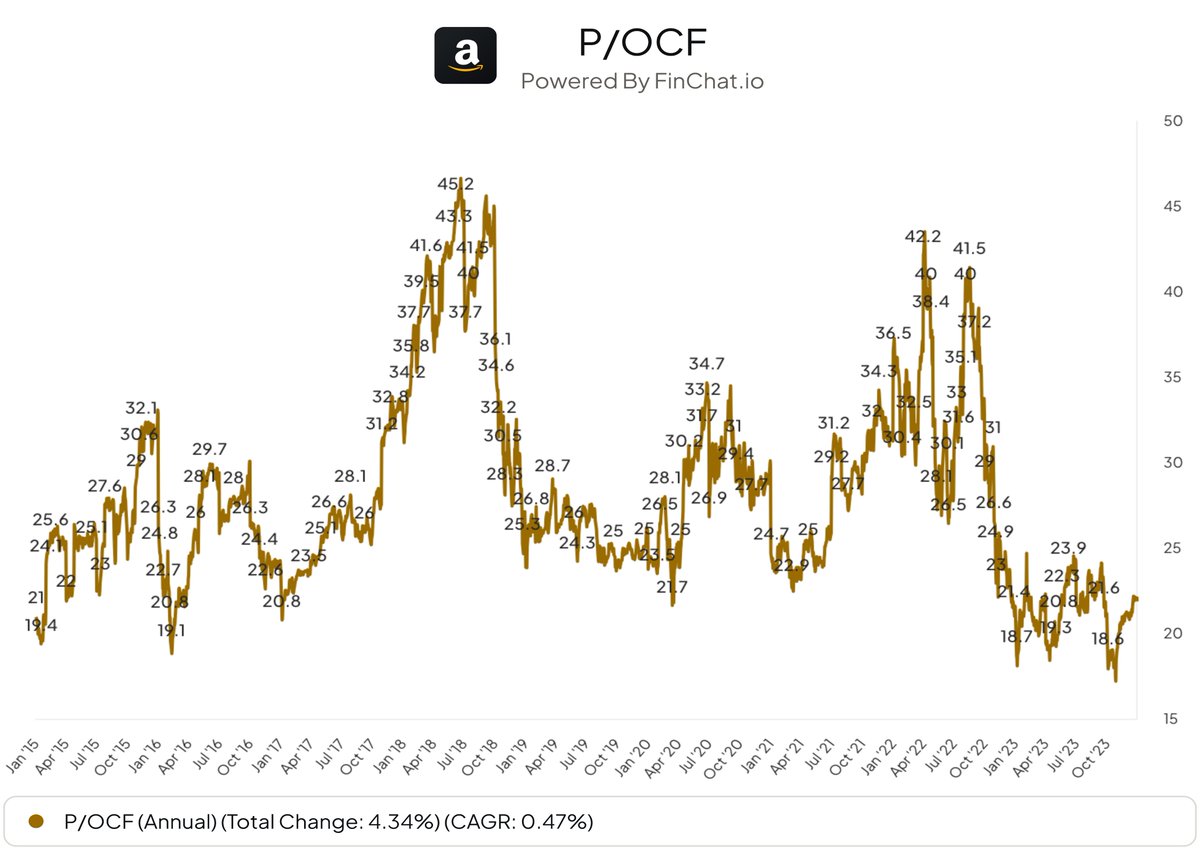
 What does P/E stand for?