Bull Theory Profile picture
Research, Trades, and all other market stuff simplified.
Jul 1 17 tweets 8 min read
Every major market crash in history had one thing in common.

Nobody believed it was coming right before it happened.

Right now, more bubble-top indicators are flashing simultaneously than at any of those three peaks combined.

Here's every single one of them. Image Here's what the market looks like on the surface right now.

S&P 500 near all-time highs at 7,500.

Nasdaq up 18.4%+ in 2026.

Semiconductors up 69% this year alone.

South Korea's KOSPI has rallied nearly 100% in 2026.

Japan's Nikkei crossed 70,000.

AI spending at record highs. Everything looks fine on the surface.

But underneath, 9 to 11 of the 16 most reliable bubble-top indicators in history are currently triggered.

At the dot-com peak in 2000, 7 were triggered.

At the 2008 housing peak, 8.

2026 is above all three.
Nov 18, 2025 9 tweets 3 min read
BTC breaking below $90,000 for the first time in ~7 months should have destroyed altcoins.

But this time, alts are not collapsing with $BTC.

This isn’t random.
There are clear reasons why alts are holding better, and the data supports it.

Let’s break it down. 👇🧵 Image The first thing to understand is how $BTC dumped.

This wasn’t normal selling.

It was structured institutional selling, visible in negative Coinbase flows and the way candles formed. Image
Nov 17, 2025 20 tweets 6 min read
Crypto market has wiped out $1.1 trillion since October 6th.

Prices are falling almost every day.
There’s no real rebound.
So what’s actually happening behind this entire move?

Let’s break it down properly. 🧵👇 Image 
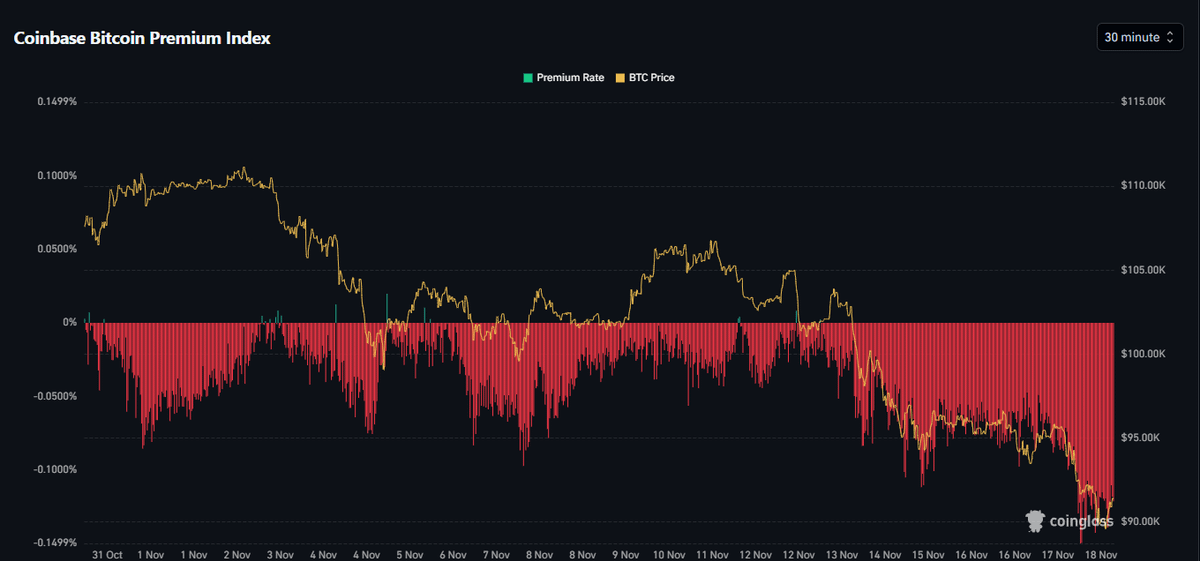
The first and biggest issue is liquidity.

The October 10th dump completely damaged liquidity across the market, especially in altcoins.

Many alts dropped 70 - 80%, wiping out investor confidence and removing liquidity from the order books.

When confidence is gone + liquidity is gone → markets become extremely easy to move.Image
Oct 23, 2025 16 tweets 4 min read
Is Bitcoin’s 4-Year Cycle irrelevant now?

Here’s why this bull run could still extend into 2026: 🧵👇 Image The classic Bitcoin rhythm used to be simple:

Halving → 12–18-month rally → blow-off top → bear market.

That pattern worked for over a decade.

But this time, something’s changed and it’s already visible in the data. Image
Sep 3, 2025 11 tweets 4 min read
🧵 THE SEPTEMBER RATE CUT IS NOW CONFIRMED 🚨

Here's what that means for your portfolio 👇 Image 
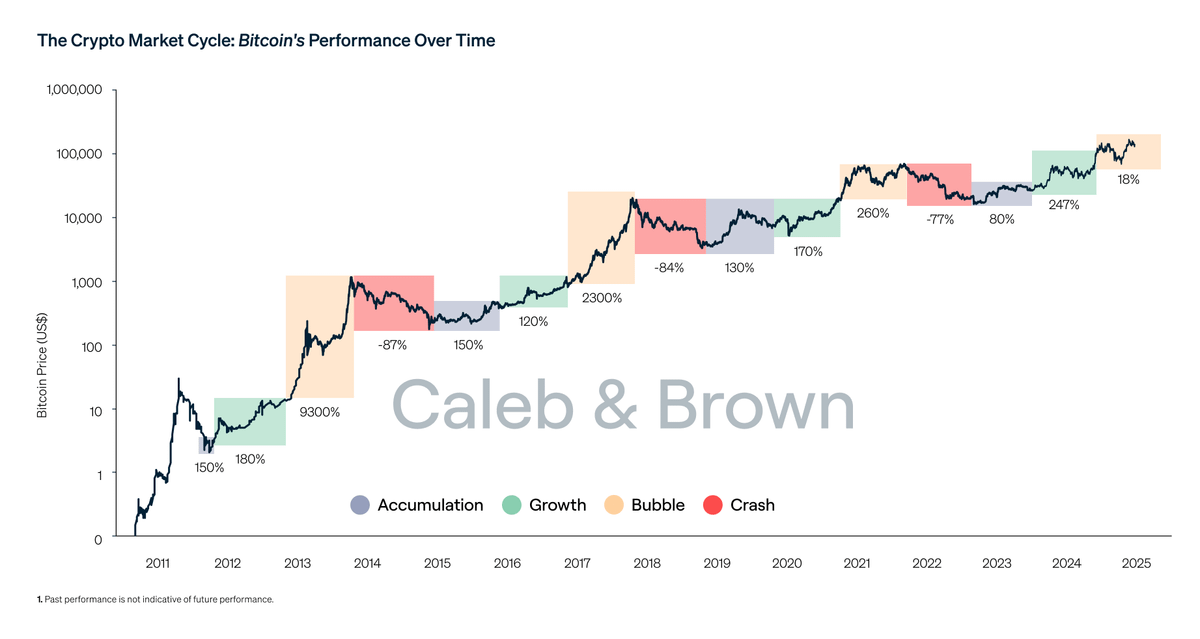
2/ Today’s job openings report came in far weaker than expected.
Job openings fell to 7.18 million, the lowest level in a year.

For the first time in over 4 years, there are now more unemployed people than available jobs.

This is a major signal: the labor market is no longer holding up.Image
Aug 18, 2025 8 tweets 4 min read
Ethereum Validator Exits Explode in 30 Days! From just 1,920 ETH in the exit queue a month ago…
to a record-breaking 893,599 ETH ($3.5B+) today.

What’s driving this historic surge — and should stakers worry? Let’s break it down 🧵👇 Image 
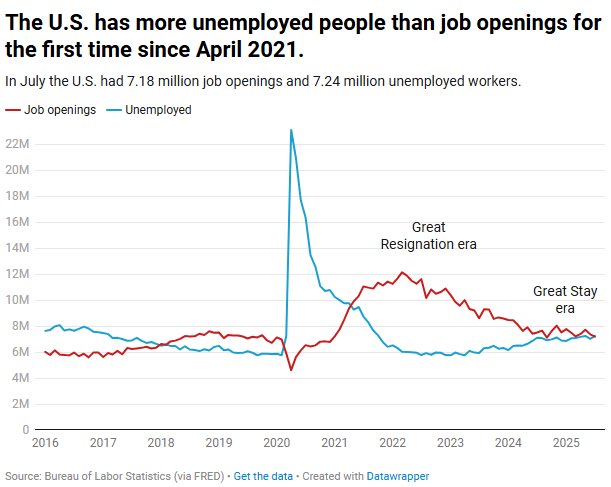
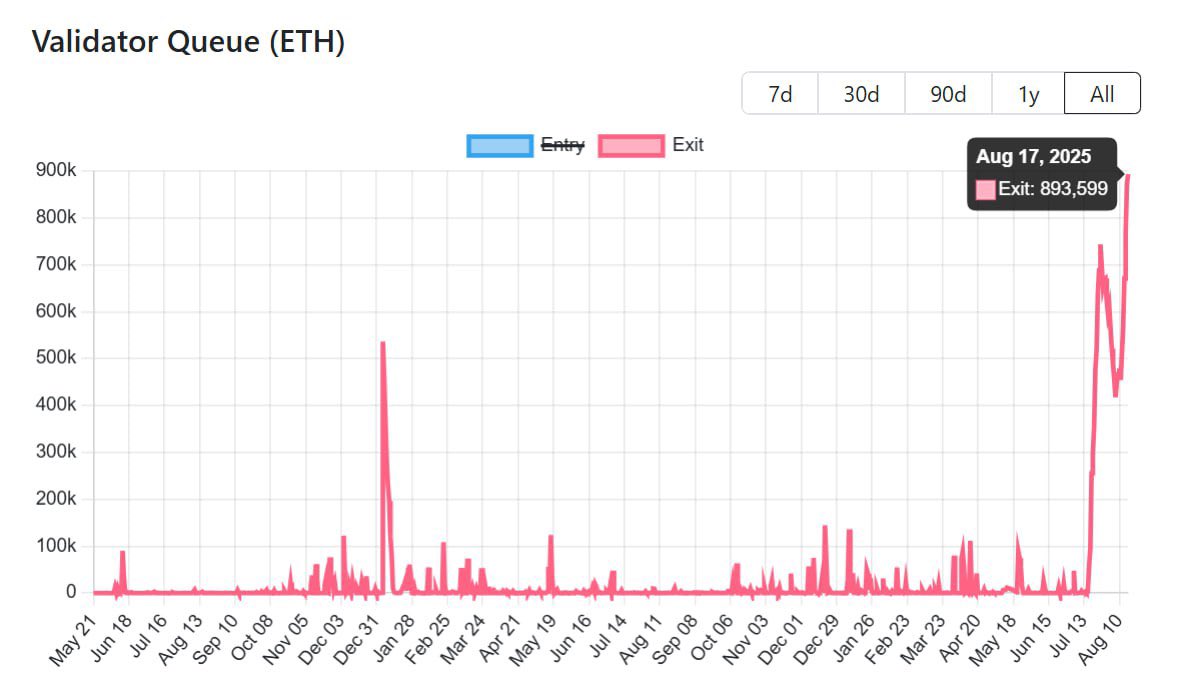
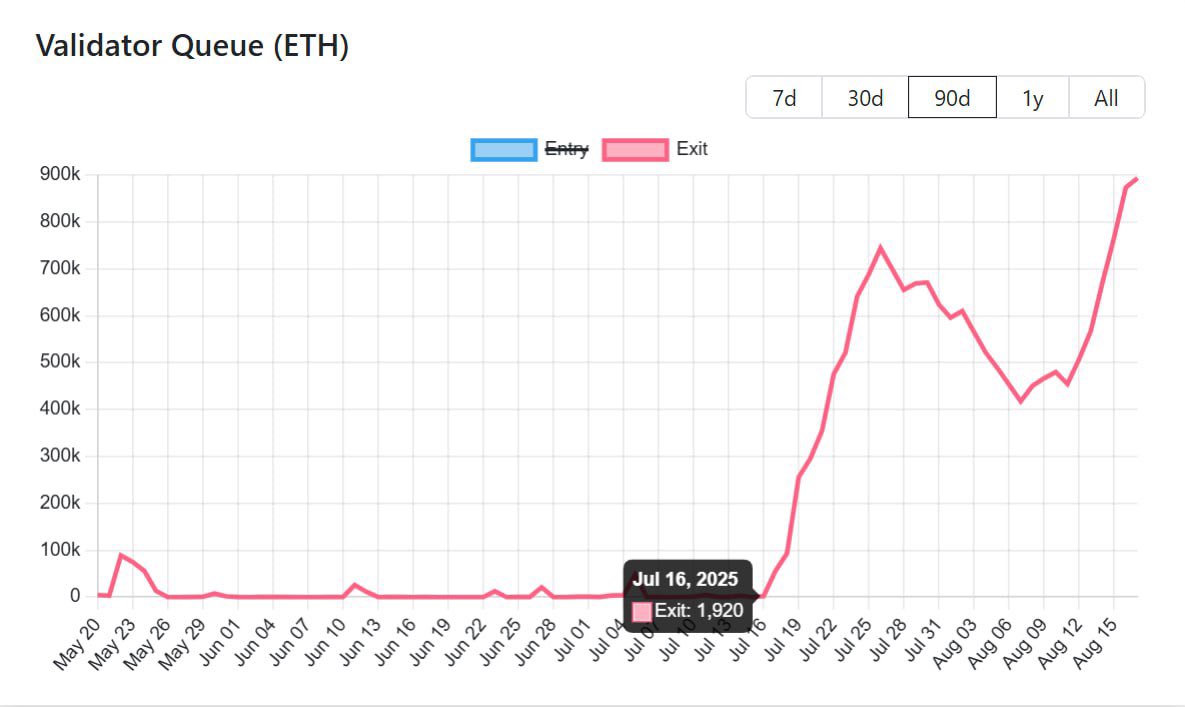
1/ Exit Queue Hits ATH
On Aug 17, 2025, Ethereum’s exit queue crossed 893k ETH, the largest validator exit event ever.

To put it in perspective:
👉 It would take ~14.5 days to fully process.
👉 That’s nearly 2.5% of all staked ETH lining up to leave. Image