
India's Best Academic Group in Internal Medicine.Over 9000 K physicians , 12 WhatsApp groups,live interaction,and case based. Editor-in-chief:Dr N K Singh
 Mechanism involved in ERS
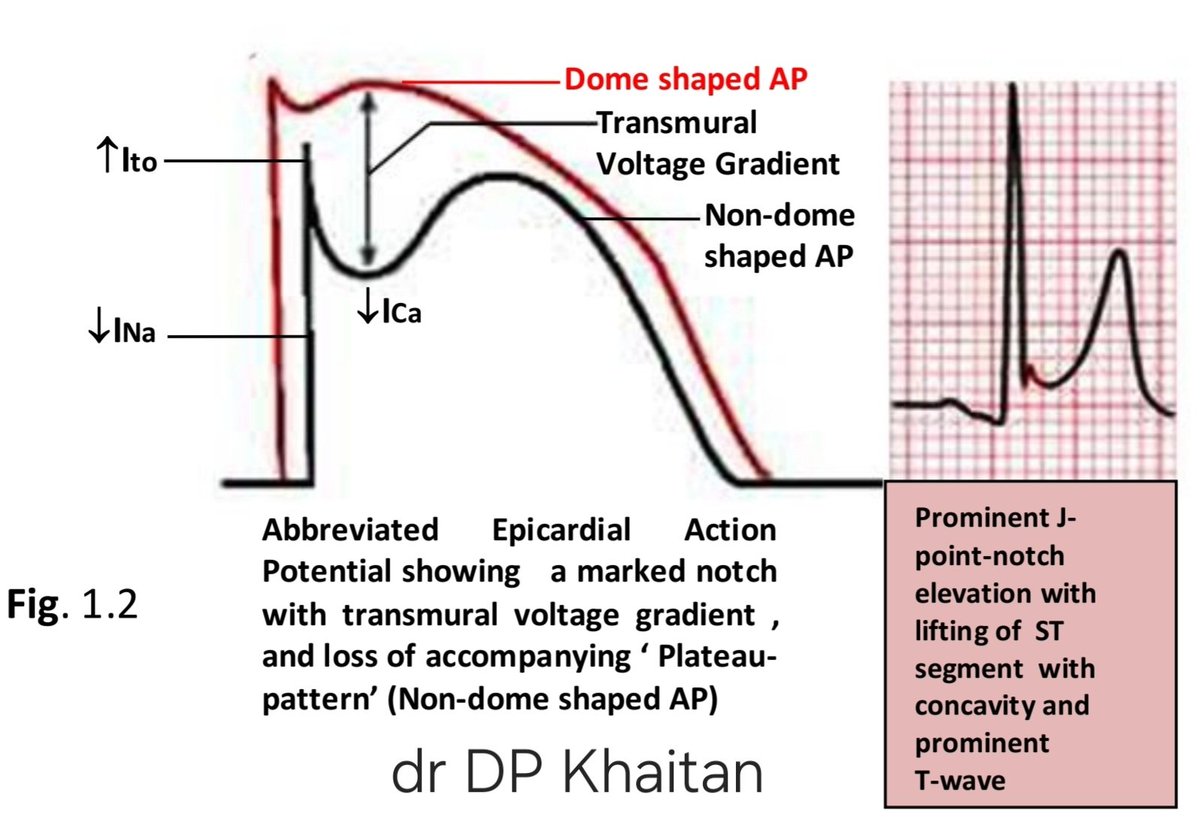
 Keypoints
 Keypoints
 The T-wave is the repolarizing event on ECG , formed at the end of ST-segment.
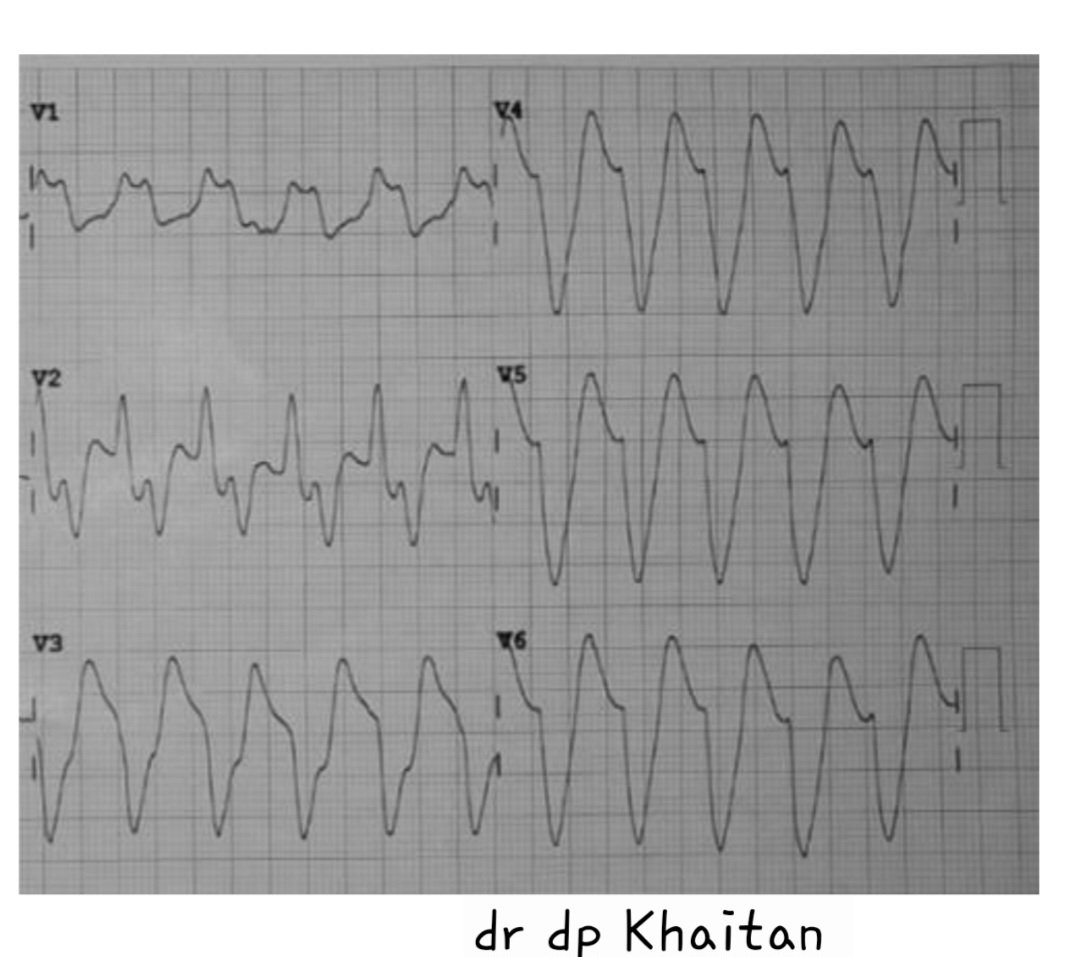
 This ECG 2 shows :