CrypNuevo 🔨 Profile picture
Not a bull, not a bear. Just TA. (Liquidity & market psychology). I will never DM you first. Not Financial Advice
8 subscribers
Dec 21 5 tweets 2 min read
$BTC Sunday update:

What really happened on October 10th?

From trusted intel I received this week, supposedly, several Market Makers caught in the volatility had big losses on October 10th.

Consequently, they've been selling assets to rebalance. What does this mean?

🧵↓(1/5)Image 
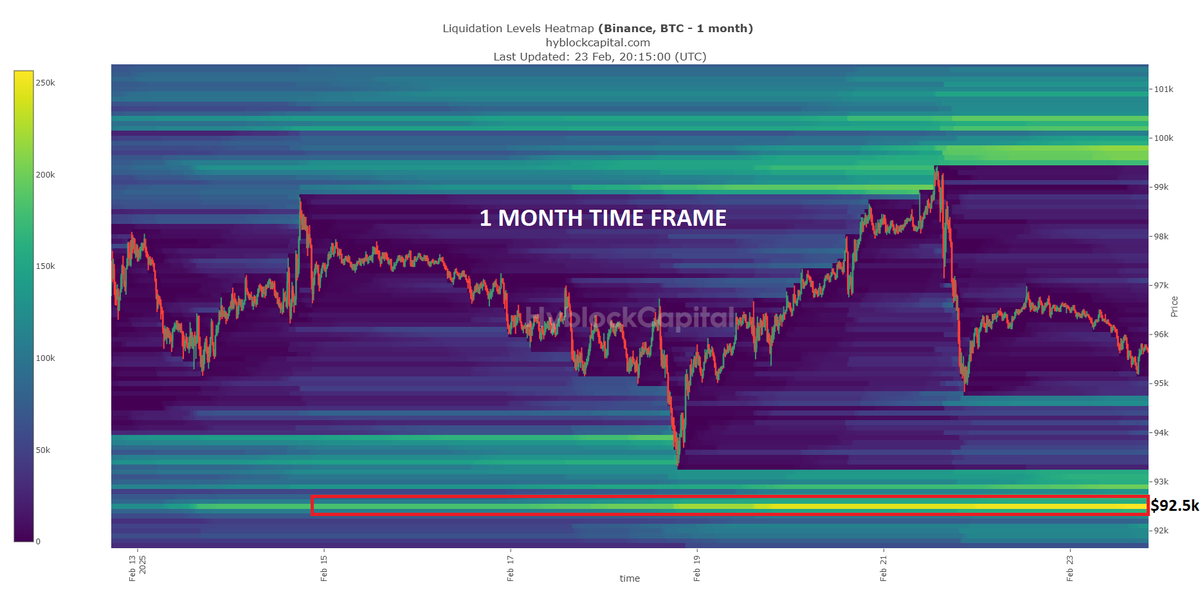
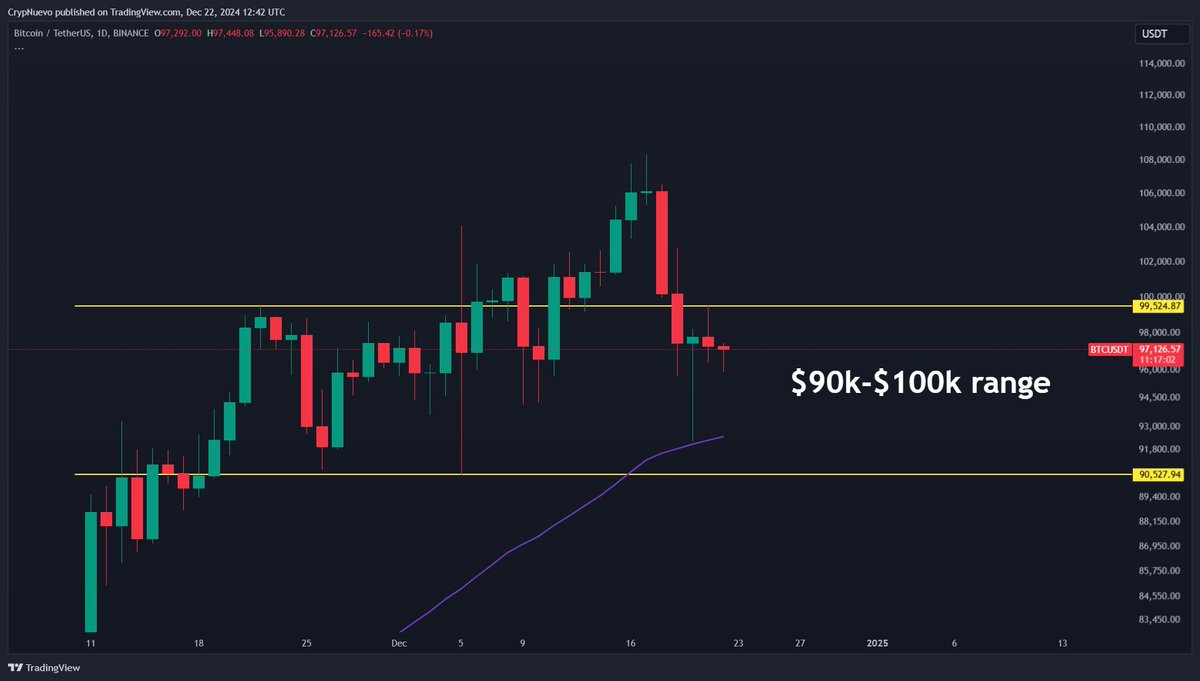
It means that there shoudn't be much left to sell.

They started selling from $115k-$110k, and they could be buying now at these levels, 25% cheaper.

And if price pumped, they would recover most of their losses.

The question is, who is left to sell? how much is left to sell?
May 11 5 tweets 2 min read
$BTC Sunday update:

Everything going as planned in the big picture🔨

We got the 1W50EMA retest and, consequently, the next leg up.

Every previous time that we saw this structure, we made a new high so the trend signals a new ATH in the making.

🧵↓ (1/5):Image 
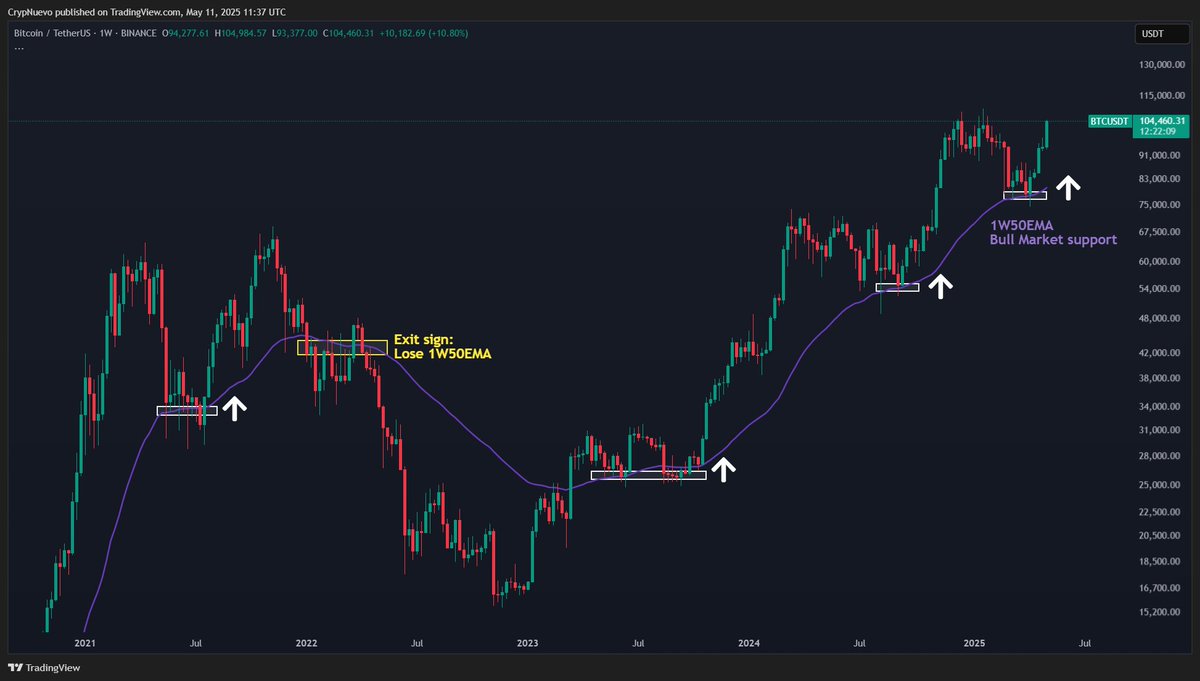
Although we could, it doesn't mean that we'll get an inmediate ATH - there might be a pullback in-between like in Sep' 21.
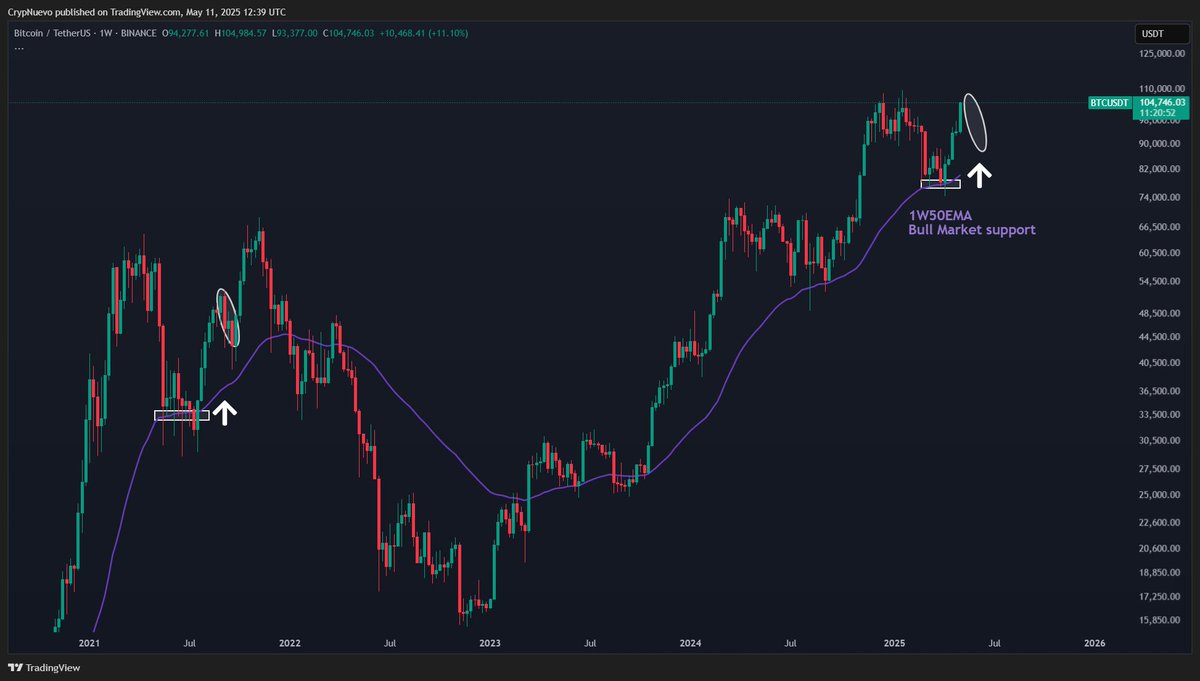
So in order to manage my risk, I've decided to take some profits (around 25%), and I'll use them to buy back lower again if given the opportunity. Image
Apr 20 6 tweets 3 min read
$BTC Sunday update:

Not much happened this week, but we got a lot more information to understand the next potential move in the market.

Everything is aligning corrrectly. I'm paying attention to the EMAs (daily and weekly 50EMA), and their mid-range. Let's analyse:

🧵↓ (1/6):Image Defining:

• 1W50EMA: Main bull market support based on all-time data. It's our current HTF support.

• 1D50EMA: It's compressing price down in a narrow area signaling a major aggresive move soon. It's our currrent LTF resistance.

• EMA's mid-range: LTF support, likely holds.
Feb 23 6 tweets 3 min read
$BTC Sunday update:

Expecting a nice trading week due to a quiet economic calendar.

I'll continue trading the range - looking for longs at the lows.

I mapped out the main levels and triggers for my own trading. Let me share them with you:

🧵↓ (1/6):Image 
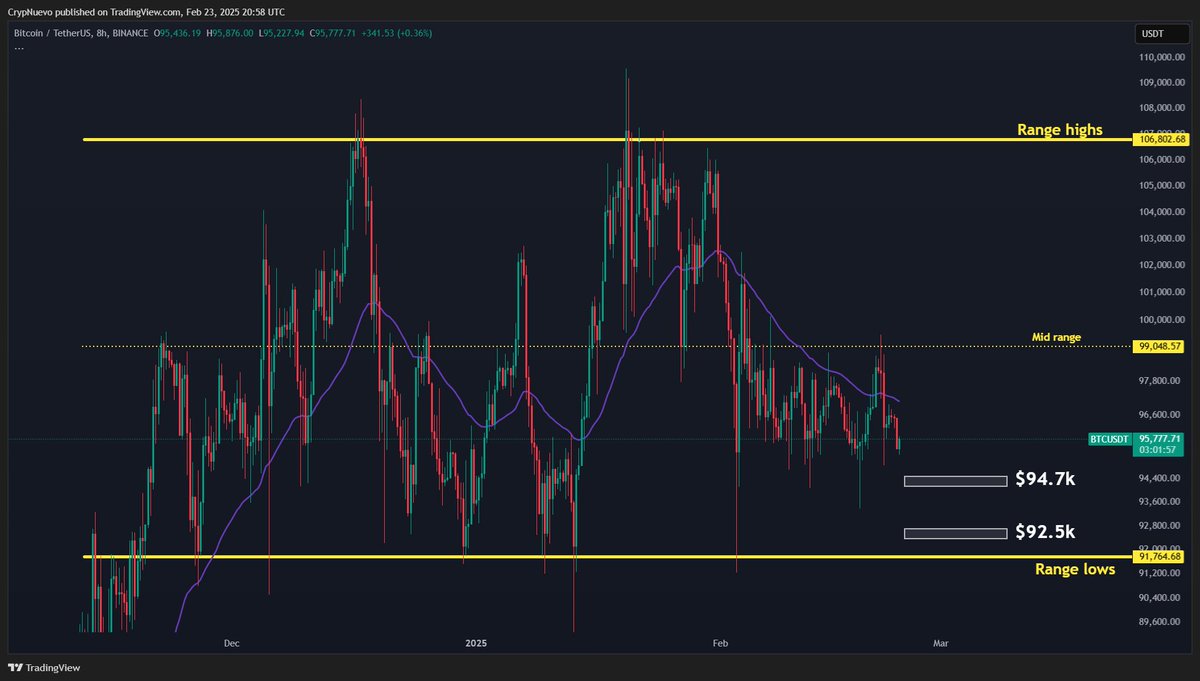
The liquidations data gave us the best trade last week: a long from $93.3k until $99k.

Now we can see in the liquidation levels that the liquidations are equal to the downside or upside. Perhaps more to the upside considering price is in a LTF downtrend.

$94.7k & $92.5k are key Image
Image
Image
Feb 16 5 tweets 2 min read
$BTC Sunday update:

We should have a nice trading week ahead thanks to a quiet economic calendar.

Only remember that Monday is US Bank Holiday so could be a longer weekend.

I mapped out the main levels and triggers for my own trading. Let me share them with you:

🧵↓ (1/5):Image 
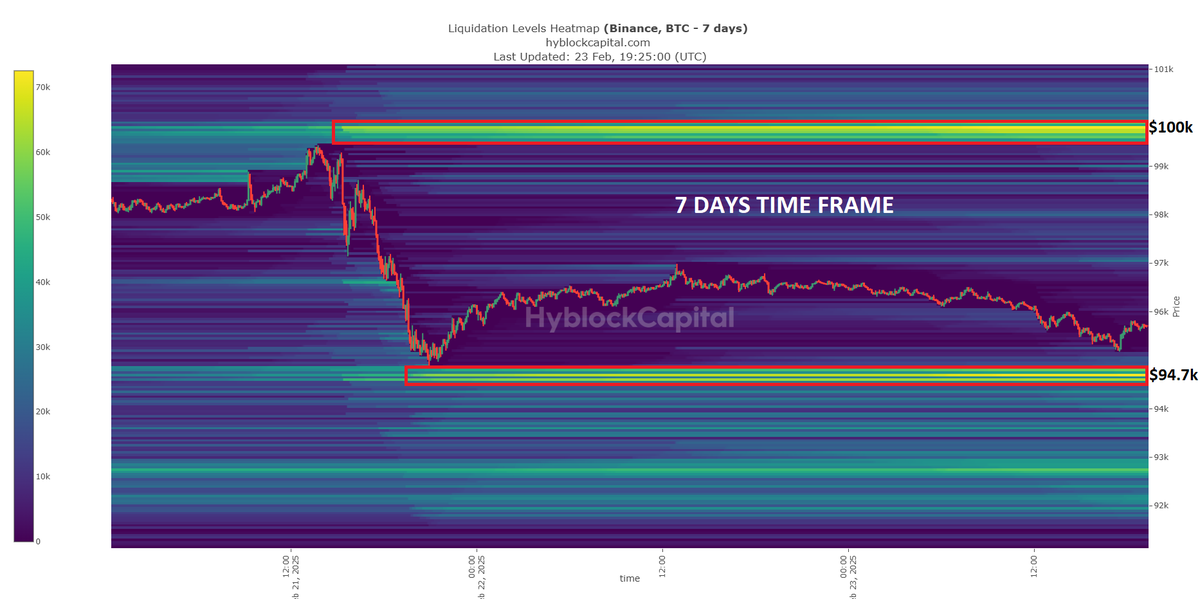
Liquidity in both sides.
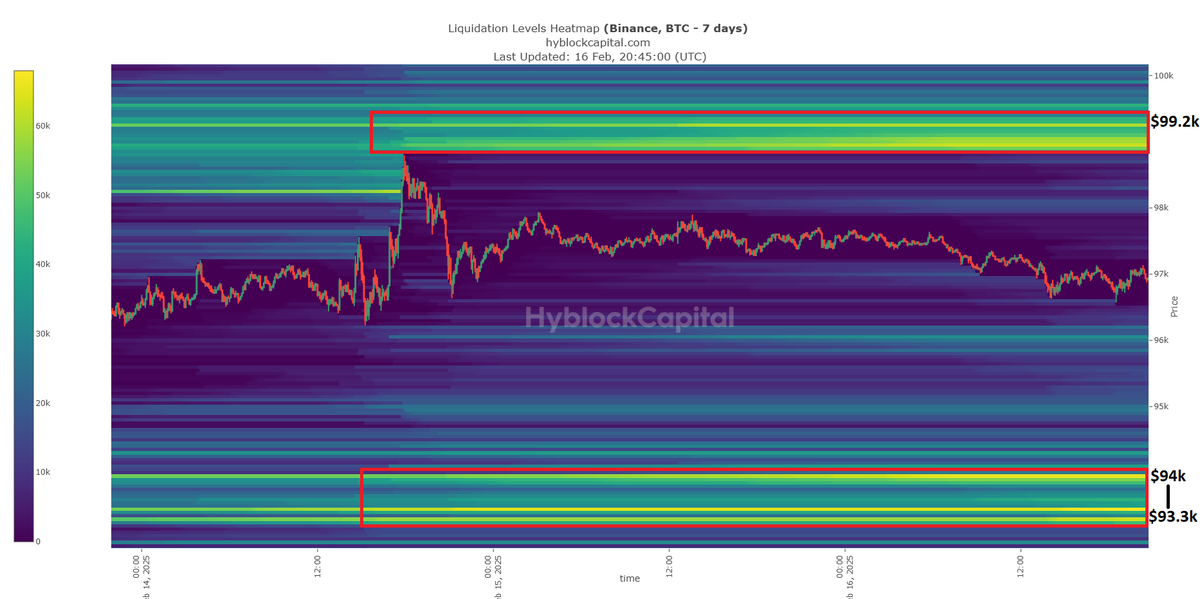
Since we're at the discount area of the range, very close to the range lows, I'm looking for longs.

I do think that the upside liquidations will likely get hit fairly soon ($99.2k) but would love to re-enter at the lower liquidations ($93.3k) first. Image
Feb 2 5 tweets 3 min read
$BTC Sunday update:

The problem of the 3 wicks is resolving.

As explained in my last video (11 days ago), all I was looking for was swing shorts at the range highs, from the uspide wick, targetting the 2 lower wicks.

We'll potentially fill the wick at range lows.

🧵↓ (1/5):Image Before vs after:

We're losing the 1D50EMA and the mid-range.
So would consider a potential resistance retest as an entry point.

Eventually, sooner or later, 96% of long wicks get filled.

• Can it be an exception?
Yes, but very unlikely because it's in within a range.Image
Image
Jan 26 5 tweets 2 min read
$BTC Sunday update:

Important week ahead... first FOMC with Trump in the presidency (Wednesday).

While looking for clues, I saw this:
• Wicks to the upside but price not progressing any further at resistance. Reversal sign?

Full analysis🧵↓ (1/5):Image 
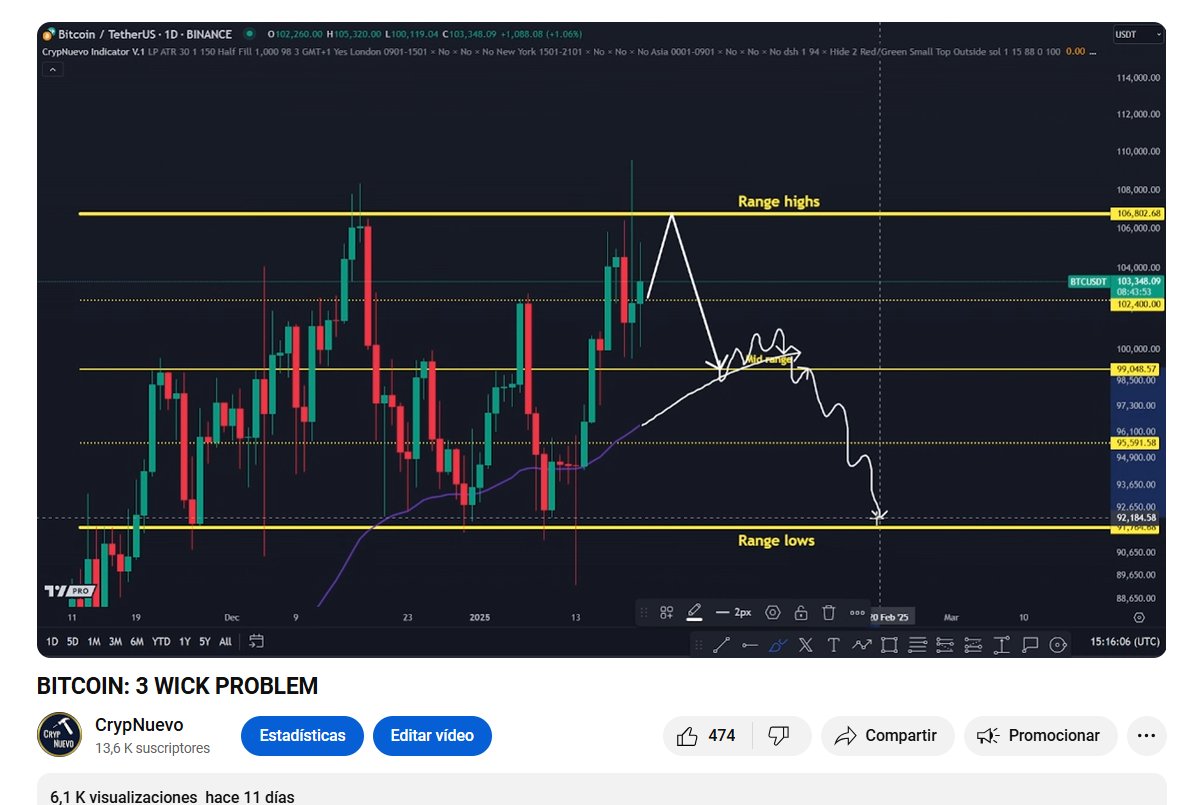
There isn't any clear on-chain data regarding liquidations atm.

Just a few liquidations in both sides, at the same distance - nothing relevant.

Everything is moving pretty slow so far. I think the market is waiting until FOMC and then we'll move from there. Image
Dec 22, 2024 6 tweets 3 min read
$BTC Sunday update:

As discussed in the past weeks and also during Friday's stream, I think this is likely a sideways move (range) in a HTF uptrend.

Meaning that we could continue ranging more, but eventually breaking out to the upside.

Let's map out a LTF projection:
🧵👇Image 
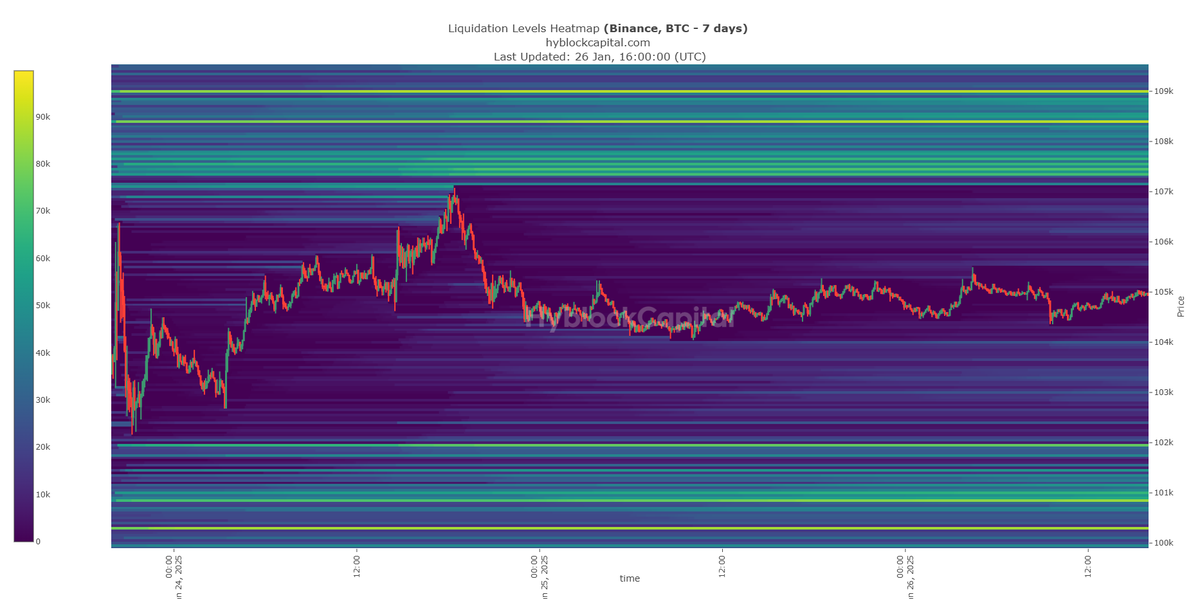
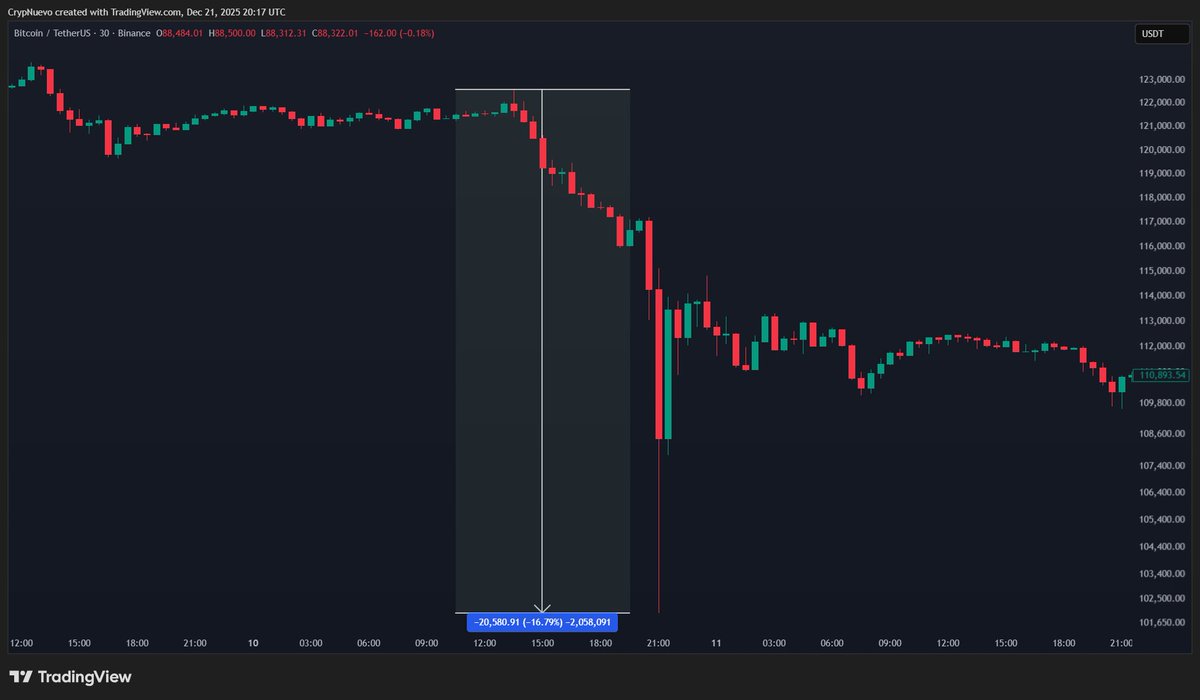
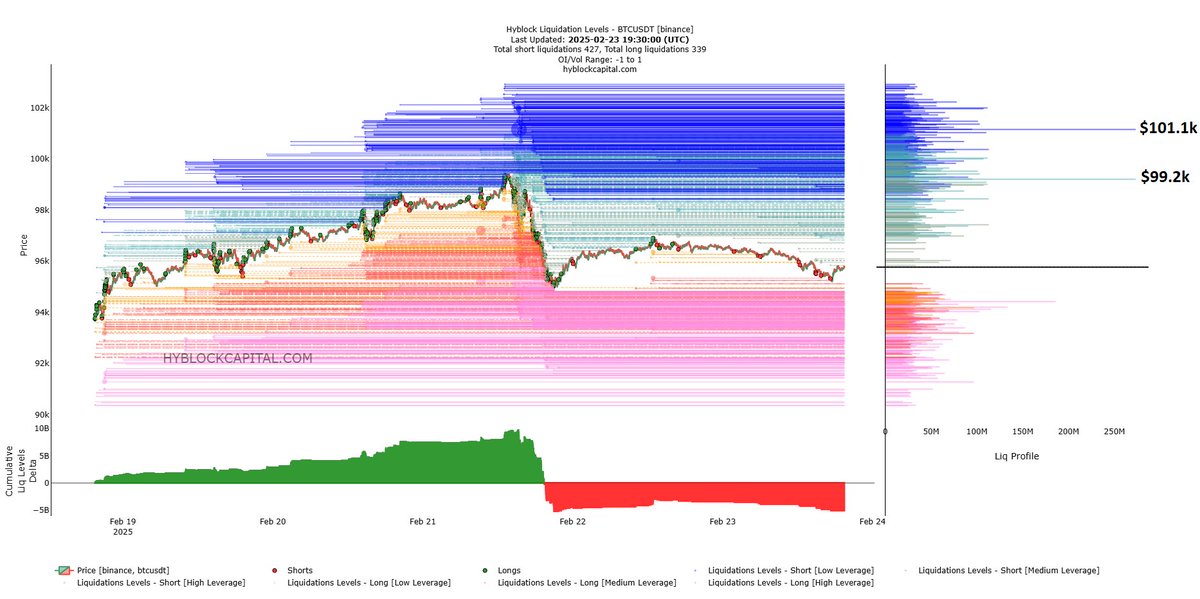
Last Wednesday FOMC's dump was likely a shakeout and not a turning point for 2 reasons:

• Dot-plot showed 2 cuts in 2025 vs Federal Funds Futures Market expecting just 1

• Drop in the SPX500 and crypto was caused by Powell's press conference saying "today was a closer call"
Dec 15, 2024 5 tweets 2 min read
$BTC Sunday update:

FOMC on Wednesday so it's likely seeing a bit of chop until then.

I'd like a retest of the 4h50EMA at some point this week, where I'd consider opening new longs if the retest is successful.

Favoring higher prices for now so I keep looking for longs.Image 
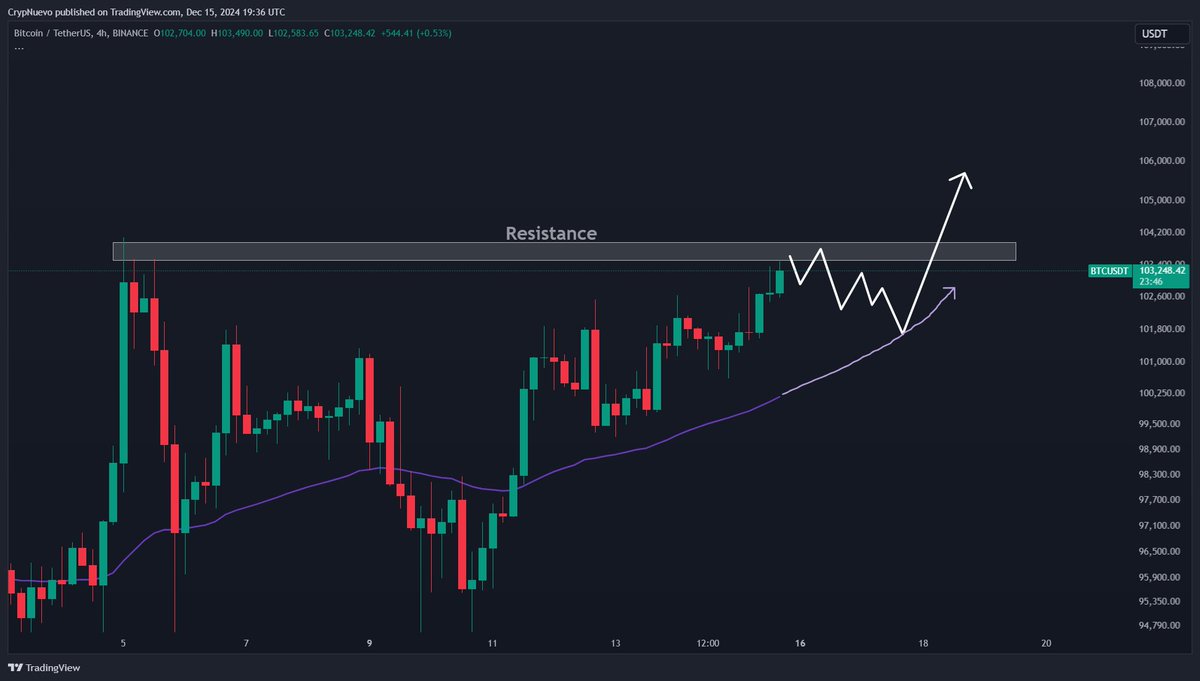
Short liquidations keep appearing higher which makes me think that we continue going higher towards them in the mid-term.

Ideally, we see a retest of the 4h50EMA first.

If that's the case, I'll call that retest a "liquidity run" and will give me more confidence on the move up. Image
Nov 9, 2024 5 tweets 2 min read
$BTC Saturday update:

This is a setup I mapped out on Thursday FOMC and I'm sticking to it.

Not sure if we'll revisit the upside box, but I'm feeling pretty confident that we'll get a (shallow) pullback from around that zone.

A long squeeze is starting to make sense now:
🧵👇Image 
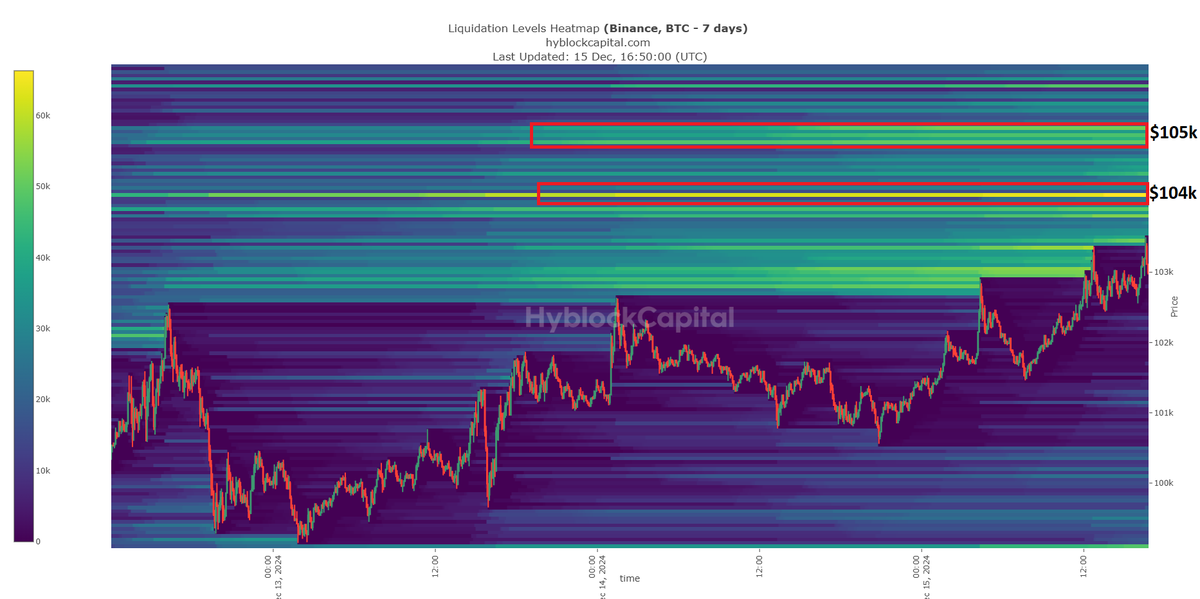
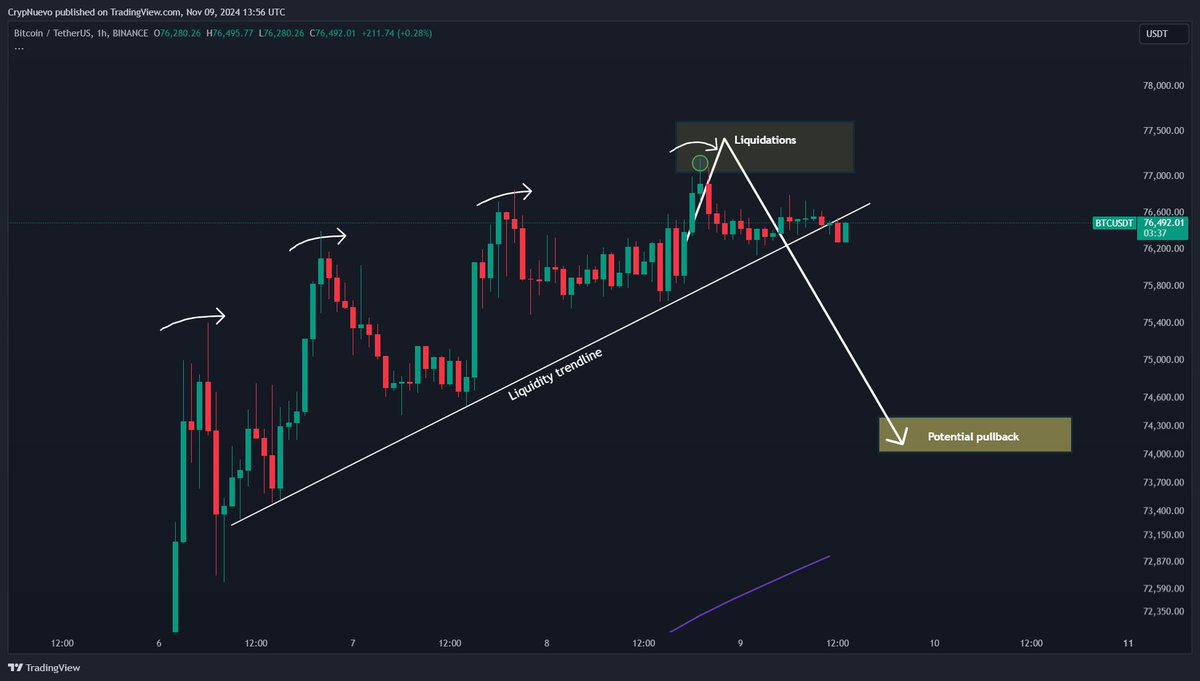
From a liquidity data perspective, it was clear that we were going to see a spike between $77k-$77.5k.

Most traders looking for shorts were shorting too early and had their liquidations in that zone.

We reached $77.2k - a bit of room left now but momentum might be finishing.
Nov 3, 2024 5 tweets 2 min read
$BTC Sunday update:

Another difficult trading week ahead. This time due to the US elections and FOMC meeting.

I'm limiting my amount of trades this week too but with a very clear plan and trading setup.

Let me share my idea with you here:

🧵👇Image 
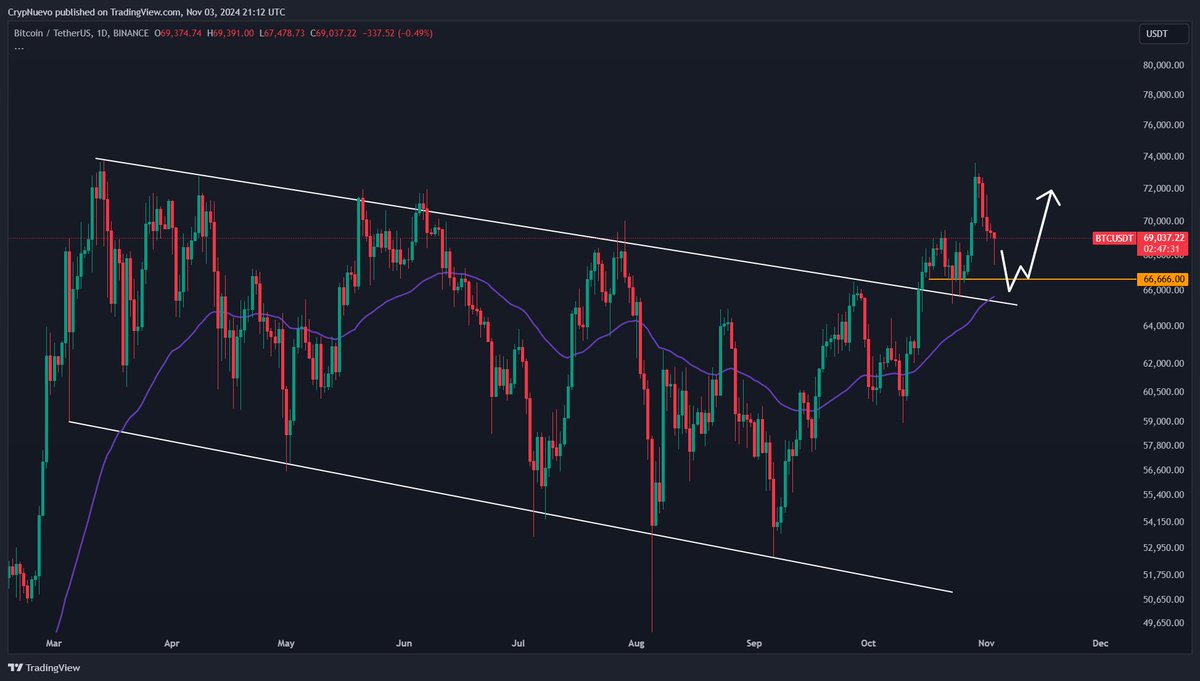
The first thing to know is that there will be some volatility on Wednesday while counting votes and knowing who is winning the US elections.

Also on Thursday with the FOMC meeting (although a 25bps rate cut seems priced-in).

So we could see wicks that can trigger nice entries👀 Image
Sep 29, 2024 5 tweets 3 min read
$BTC Sunday update:

Let's keep it simple... this is the current market structure and we still need to break 2 resistances to have full confidence in a ATH.

Until then... it's still a traders' market.

This is how I'm trading this week 🧵👇:Image 
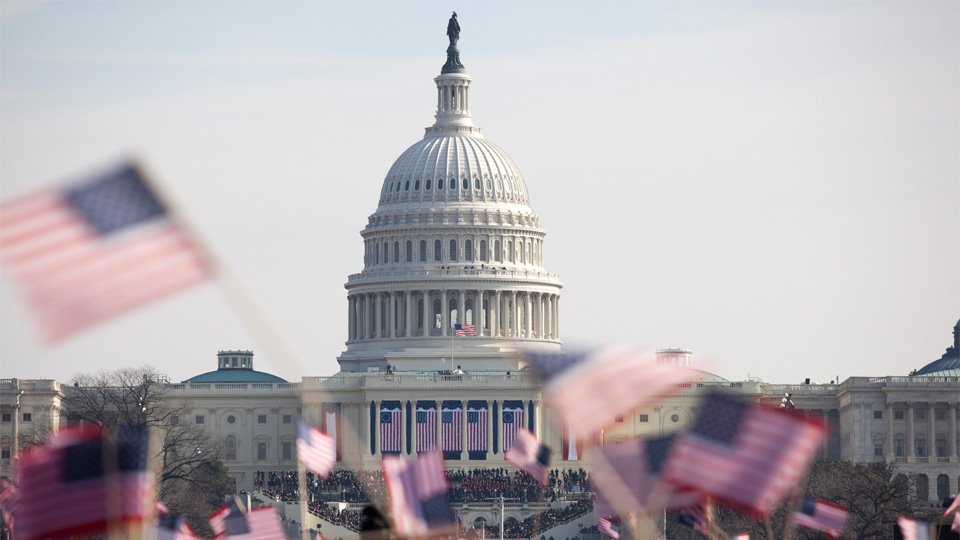
We could see some volatility related to the monthly close.

So it's possible a sweep of the highs by then, that could get reversed back to support.

From support, if we go up again and reclaim the highs, that's a long for me until the 2nd resistance. Image
Sep 1, 2024 8 tweets 3 min read
$BTC Sunday update:

A lot of information in the chart:

• Long wick at $56.6k
• 1h50EMA acting as resistance
• Wicks to the downside but price not progressing any further for the last 5 days
• Liquidation heatmap full of liquidity

This is what I'm expecting next week 🧵👇Image 
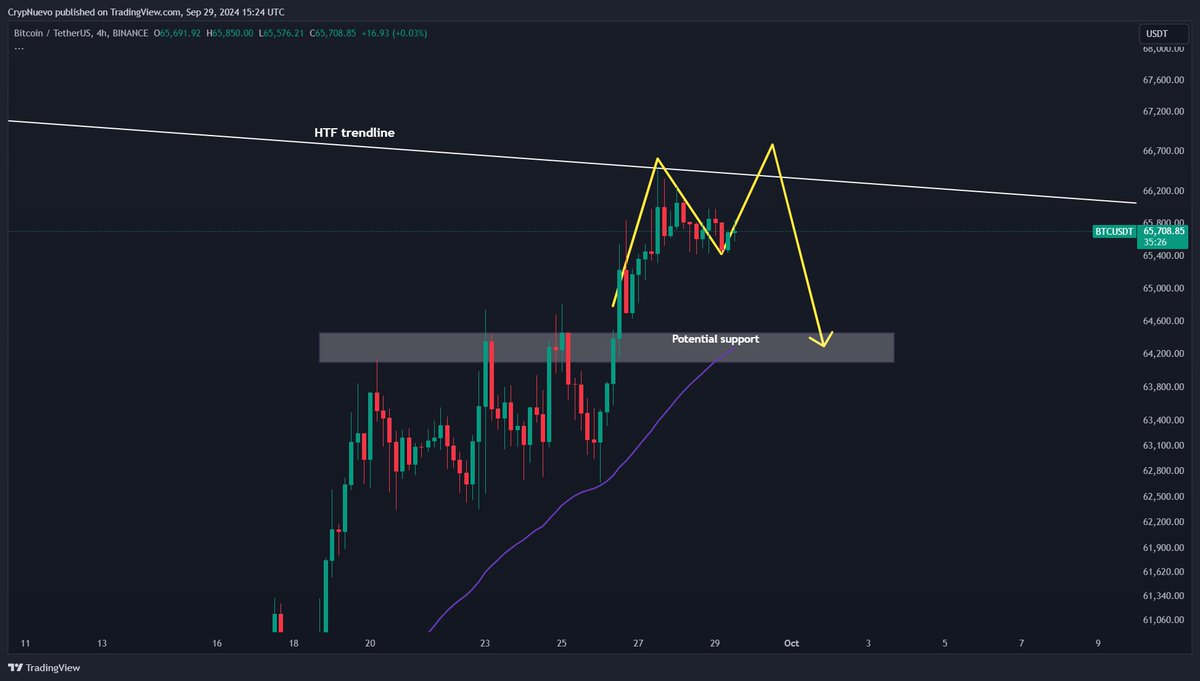
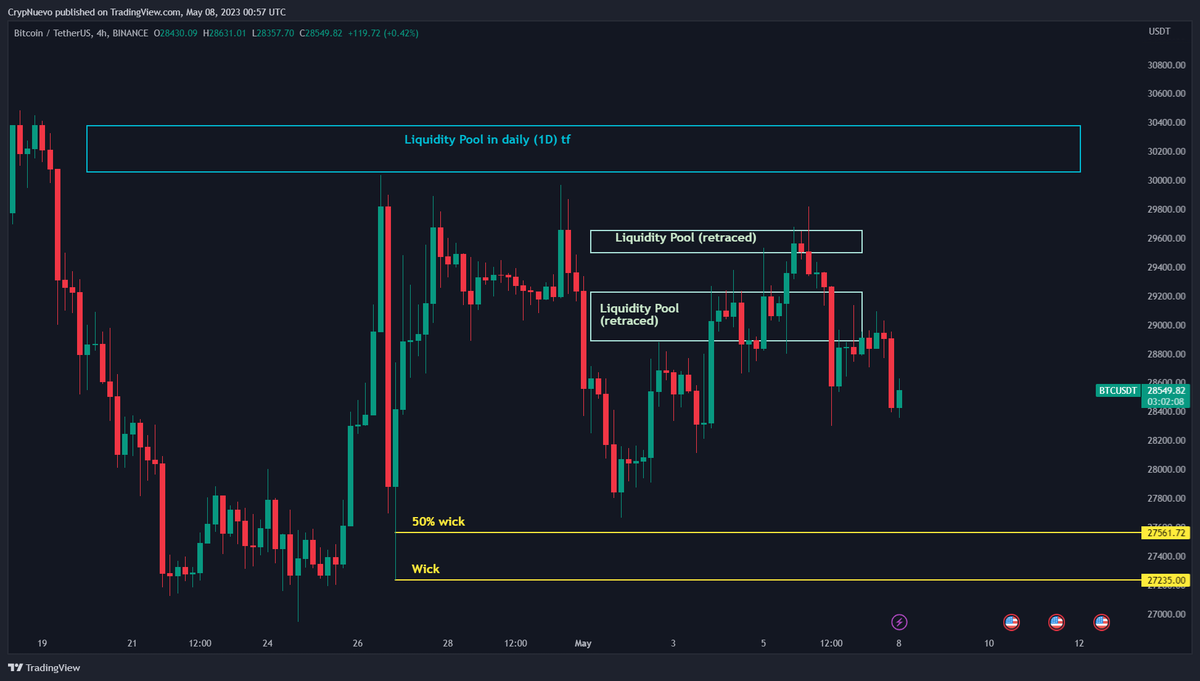
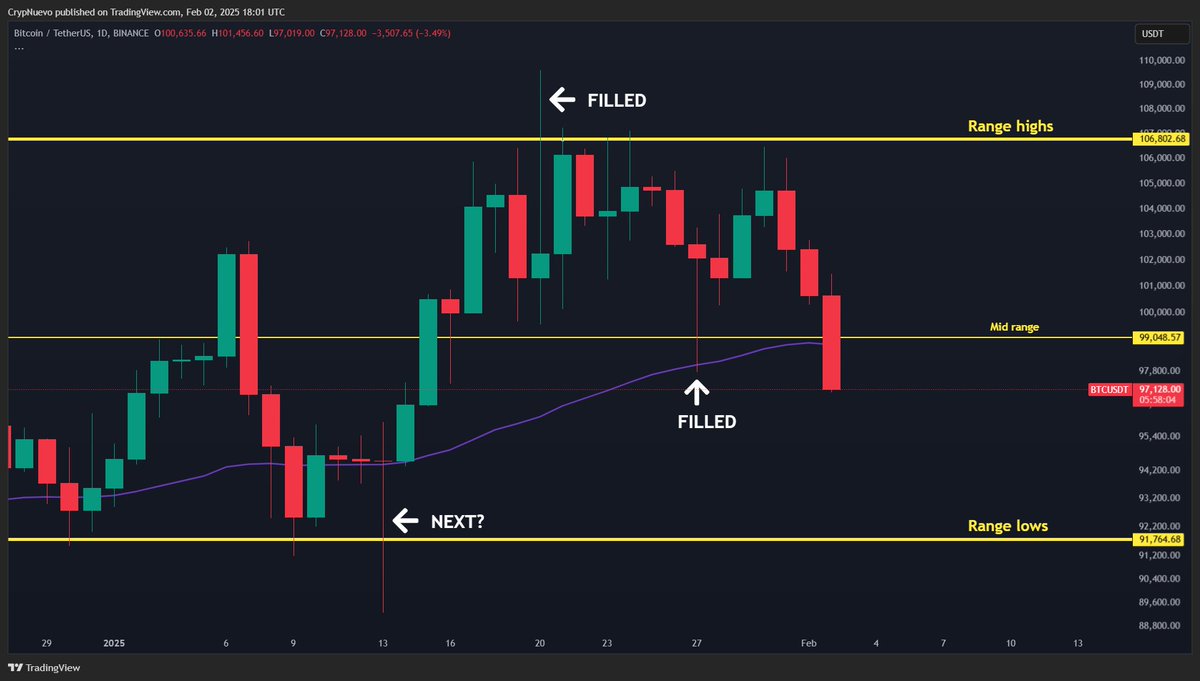
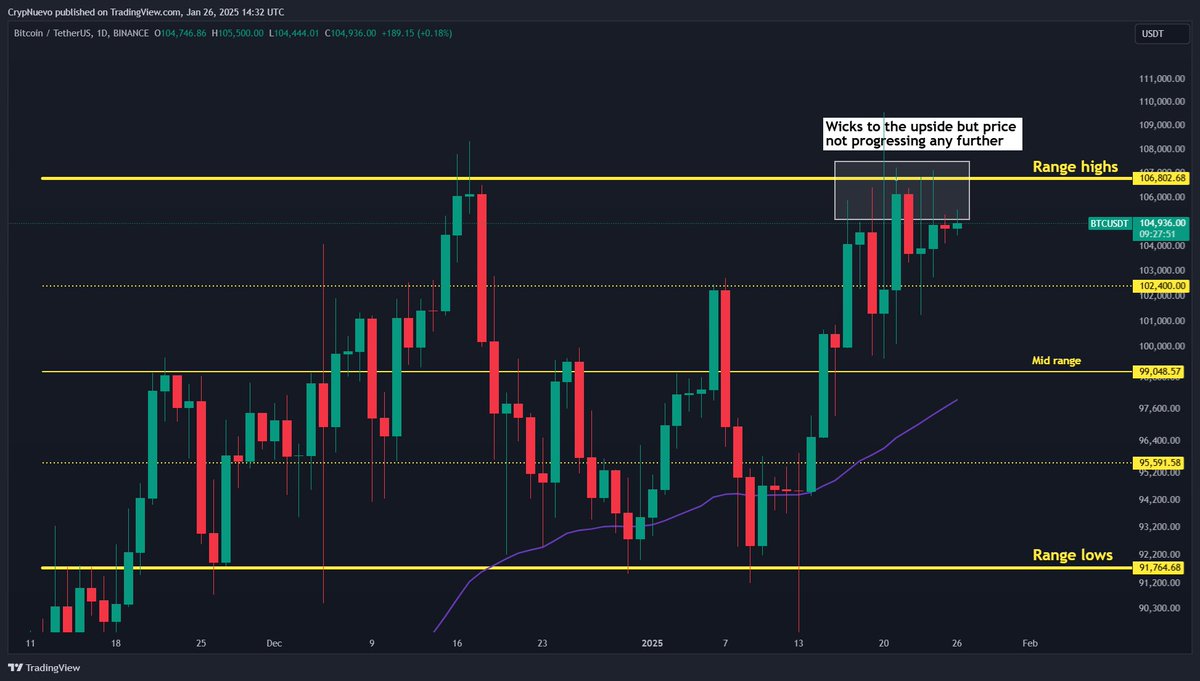
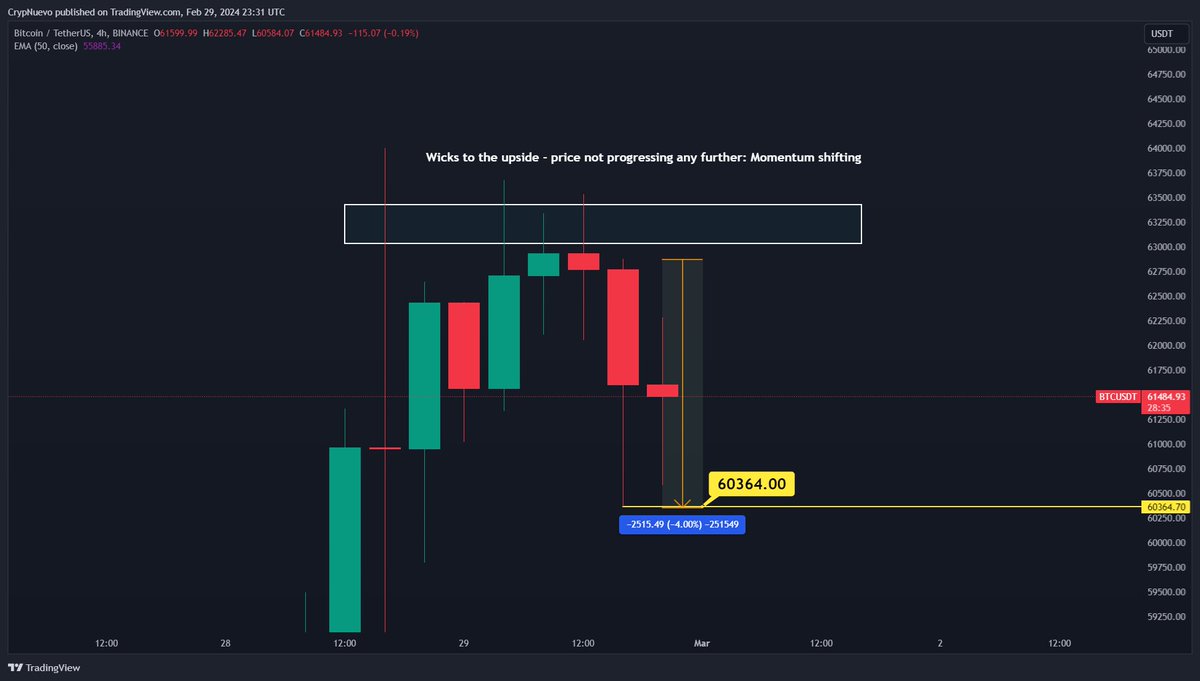
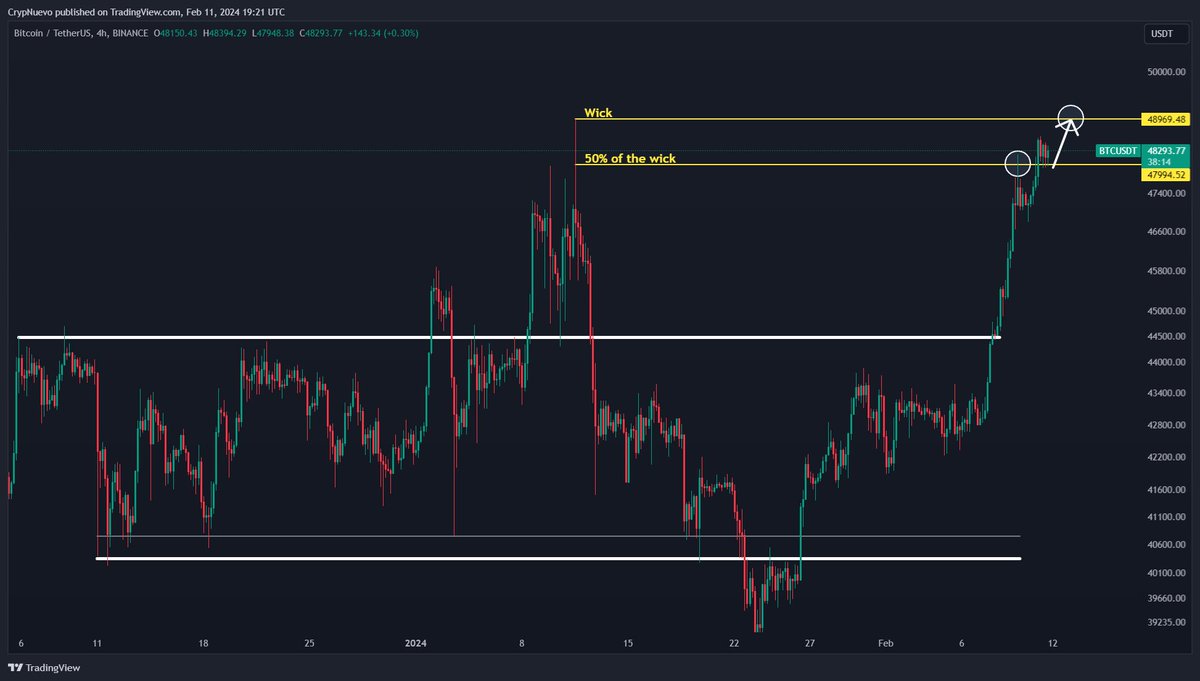
Wicks have priority in my trading system, they give us a lot of information:

• Individual long wicks: they represent OI gaps; thus, they act as magnets and tend to get filled

• Several wicks but price not progressing: this usually indicates that the MM is building a position
Aug 25, 2024 6 tweets 3 min read
$BTC Sunday update:

We have a nice trading week ahead - economic calendar is quiet.

Liquidity targets, like this wick in the 15min time frame, and PA patterns will dominate the market this week.

So let's find key levels and a new projection 🧵👇Image 
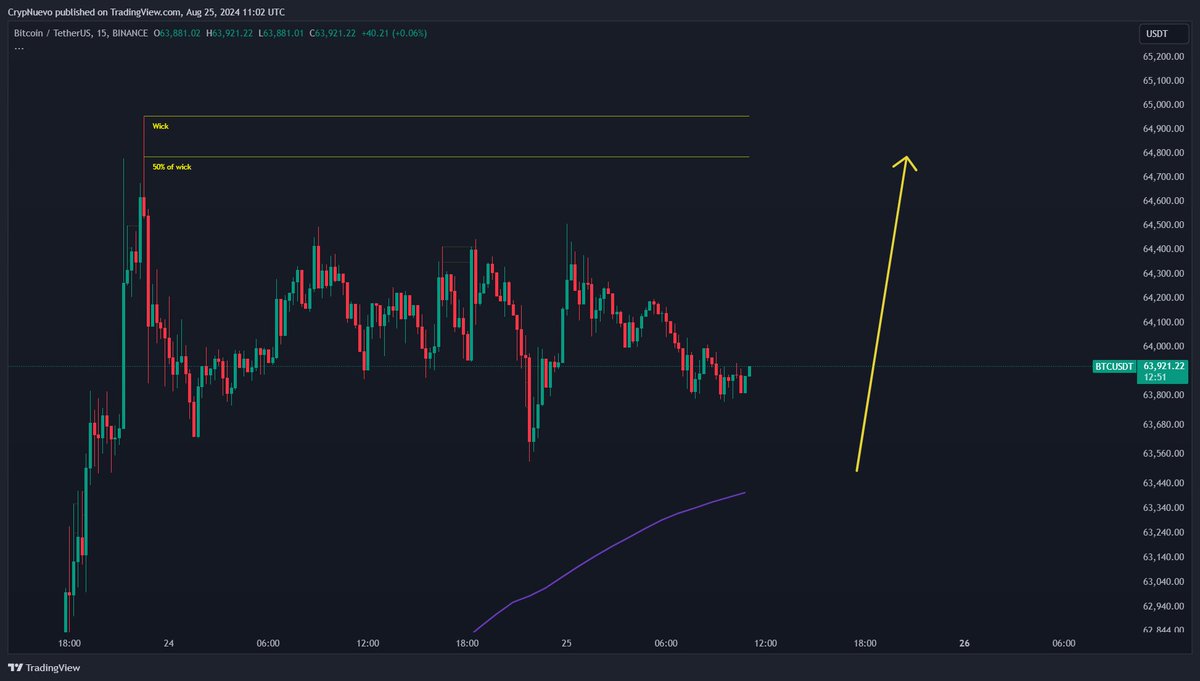
The orderbook is showing a lot of liquidity at the wick:

The liquidity shown in the orderbook mixes buy/sell limit orders, take profits, stop losses & liquidations.

In this case, I believe it's a combo of Stop losses placed above the swing high and also some sell limit orders.Image
May 19, 2024 5 tweets 2 min read
$BTC Sunday update:

Bitcoin is working its way towards this HTF liquidation zone centered around $69k.

However, it's common to see "liquidity runs" before hitting important liquidation zones, with the simple intention to gather even more liquidity.

Let's talk about it 👇🧵Image 
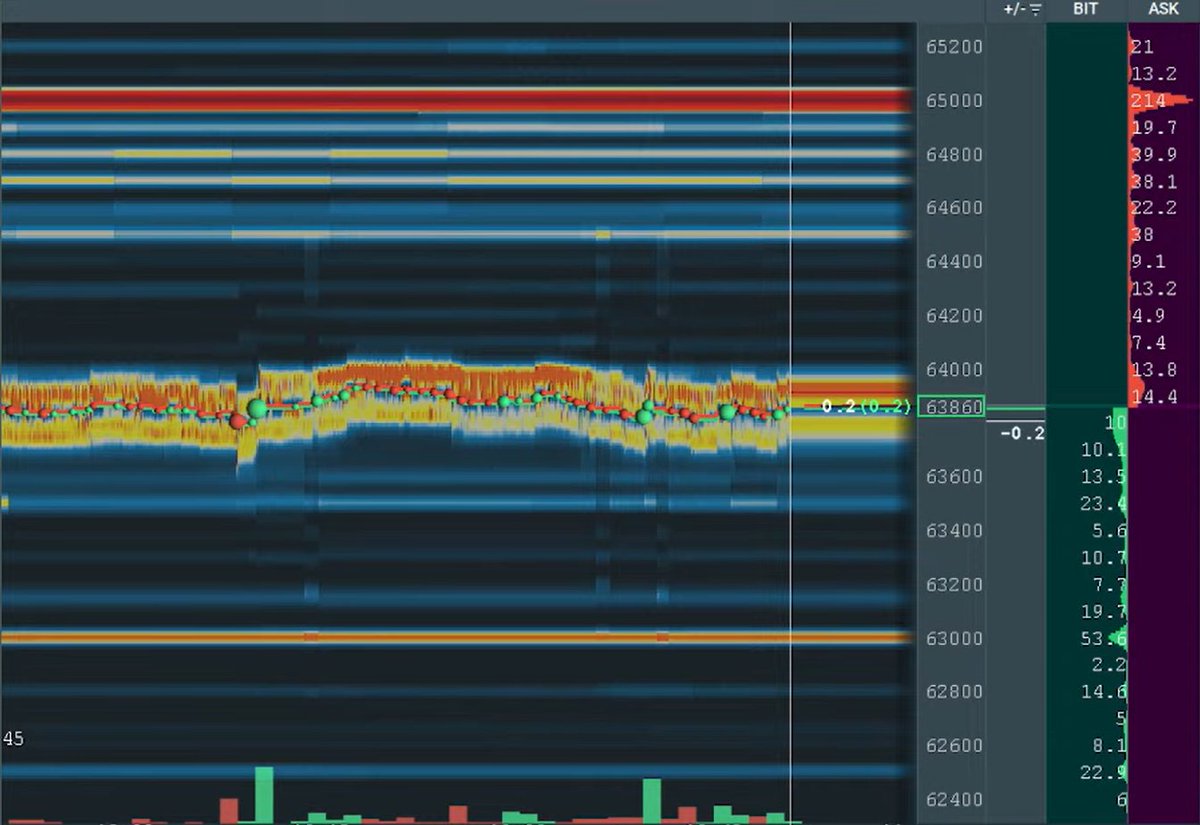
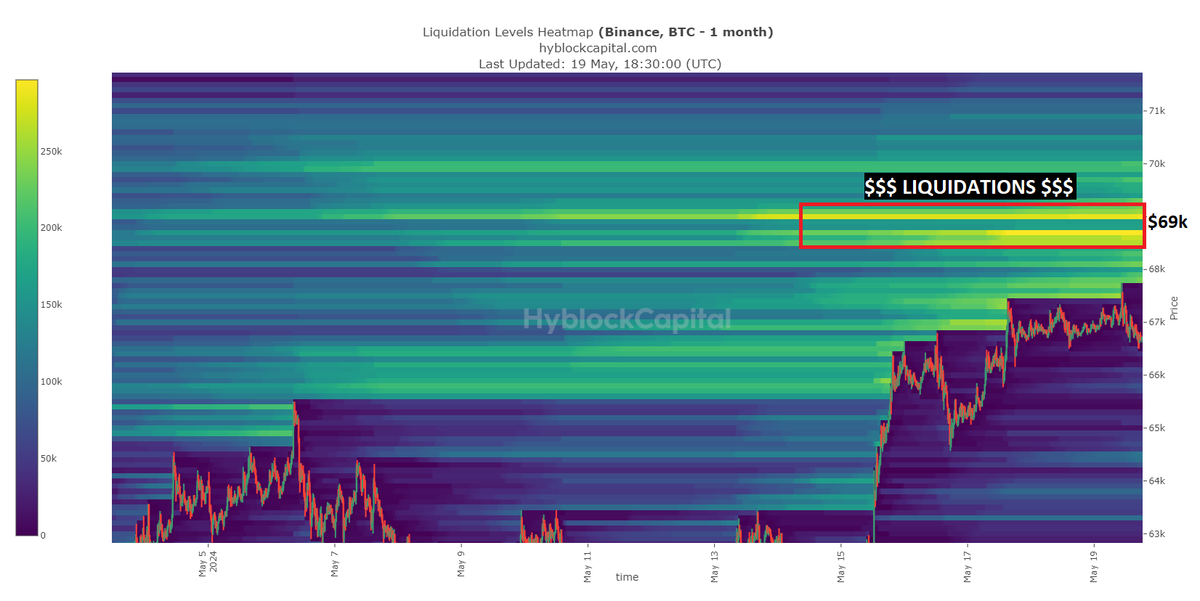
Those HTF liquidations at $69k are short liquidations from swing traders that took the wrong trade.

We're likely seeing a "liquidity run" now:
An aggresive downside price move created to gather more short liquidations in the same area to liquidate more positions in one hit.Image
May 12, 2024 4 tweets 2 min read
$BTC Sunday update:

Difficult trading week ahead. With all the inflation data coming, I have the feeling that we'll just push towards one direction in an aggresive way.

Perhaps I'll be wrong here, this is merely based on just instinct.

But let's have a look at the details👇🧵Image 
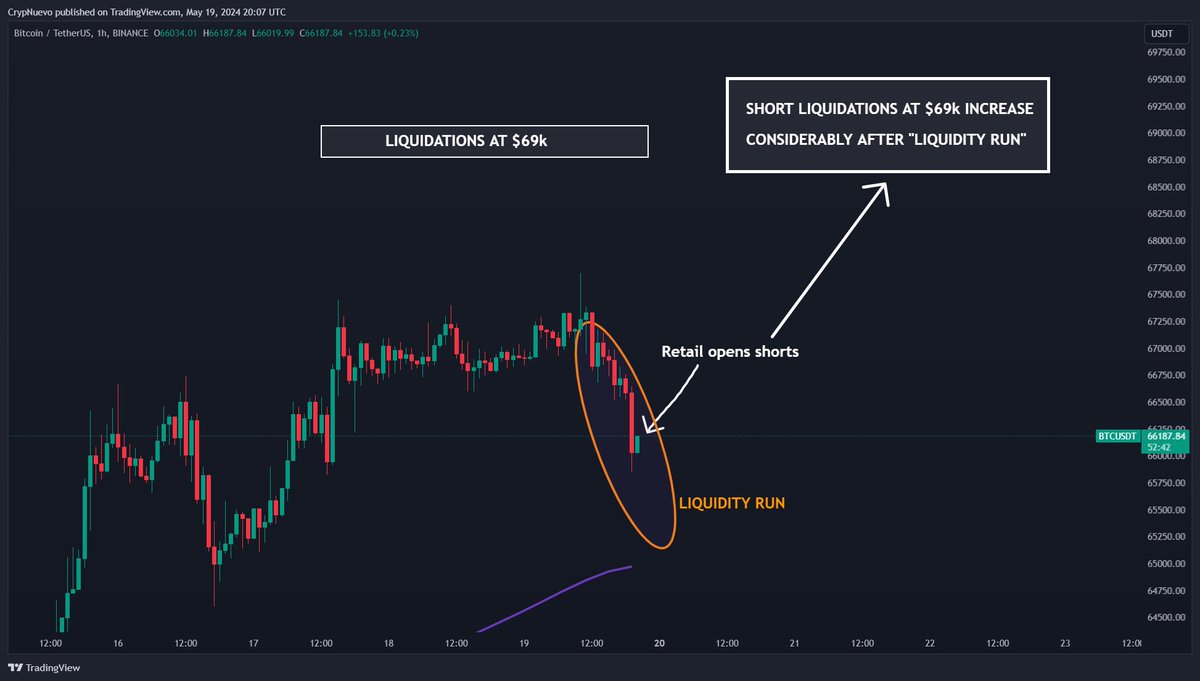
So far, $BTC is following the projection from our last Sunday update.

Now, this doesn't mean that it'll continue playing out, but it definetely supports the possibility for this idea to play out.

Range lows are acting as support after a deviation which is a good sign.
Image
Image
Feb 29, 2024 5 tweets 3 min read
NEW $BTC update:

Today we were preparing ourselves for a specific scenario and it's happening.

We saw wicks to the upside but price not progressing any further which meant that momentum was shifting out and we could expect a long squeeze to $60k.

BTC just reached $60.3k😎

1/5Image 
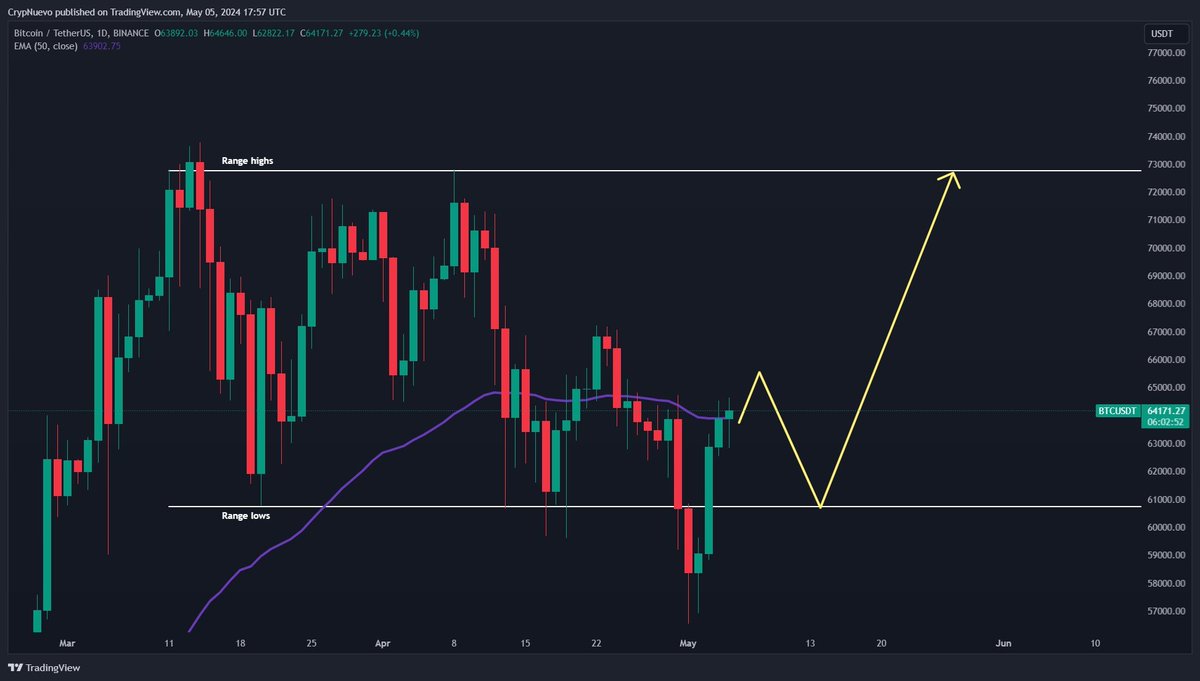
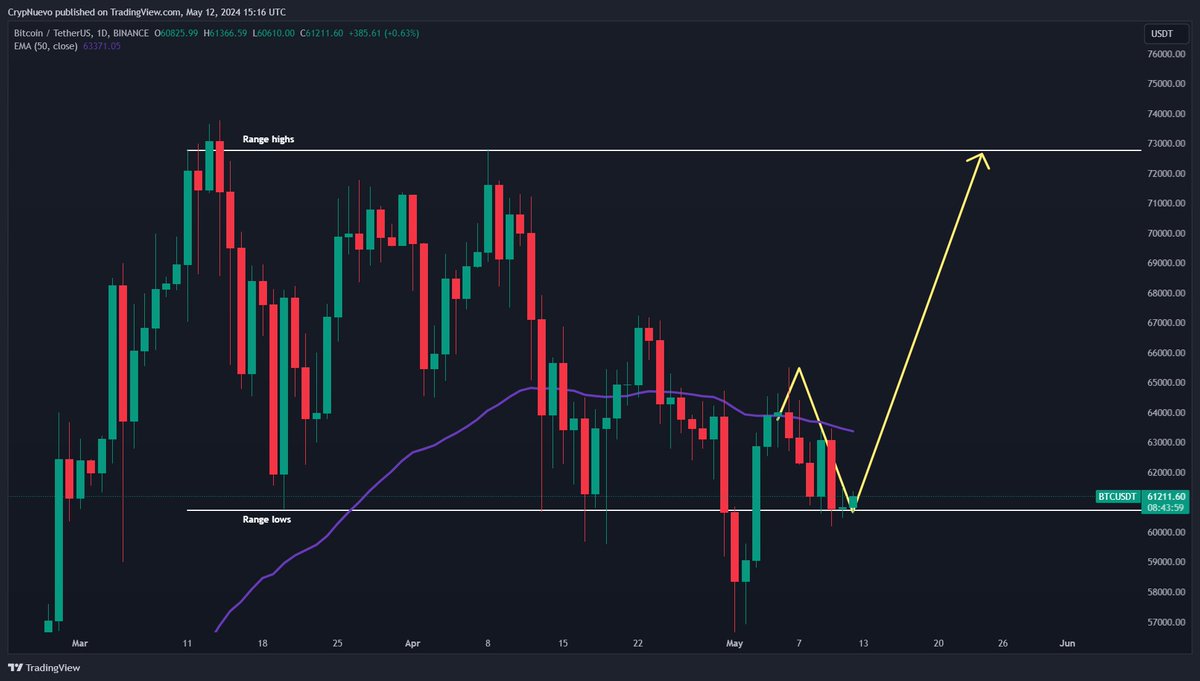
We didn't see the stophunt to $64k which is actually good news.

Those liquidations are likely staying there. Because most traders shorting this believe that they shorted the top so most of them won't be closing their positions.

Their liquidations at $64k will stay there 👀
Feb 29, 2024 8 tweets 4 min read
$BTC update:

A lot of things have happened in the last 24 hours and this analysis is going to be quite dense.

I'm going to cover BTC chart, BTC liquidations data, the Coinbase event and of course, altcoins.

A lot of wicks in the chart. BTC already filled this double wick.Image 
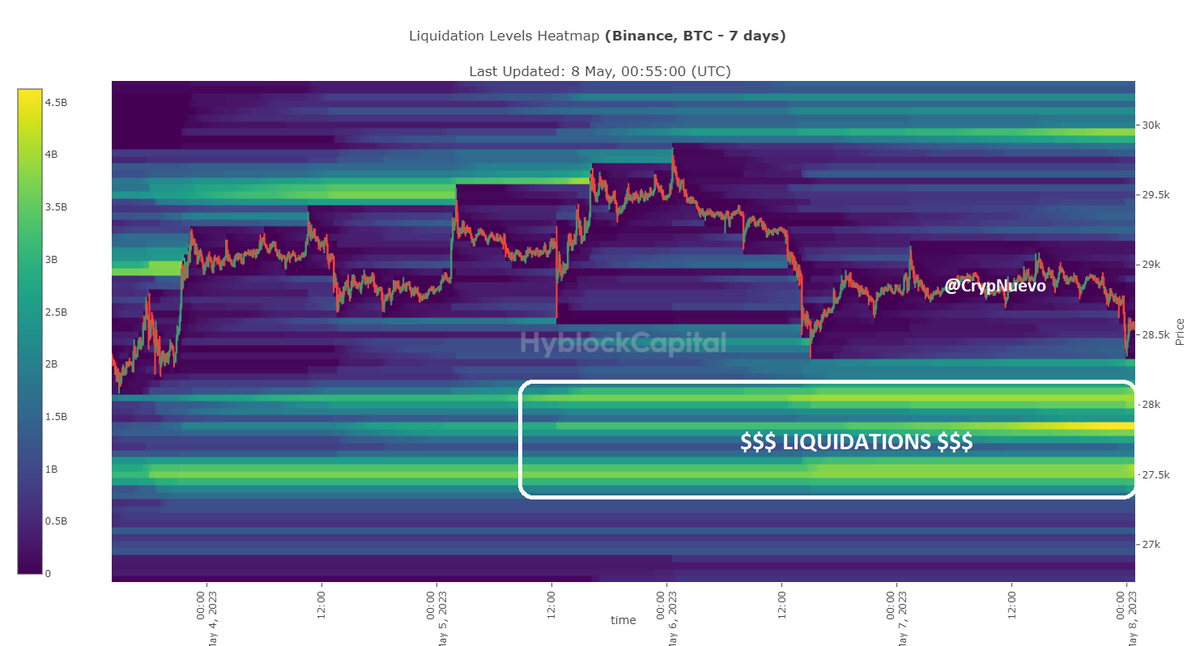
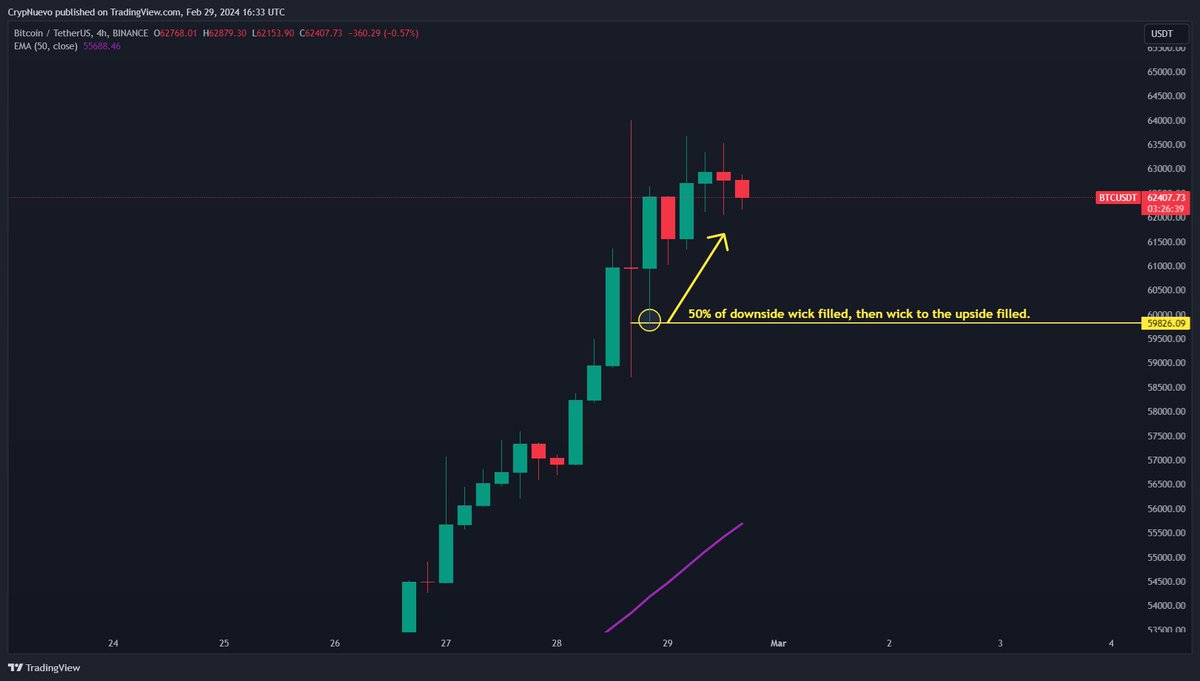
The liquidation levels are showing a great amount of long liquidations at the moment which puts the market at risk of a new long squeeze.

However, we can see a major cluster of short liquidations at $64k.

(not real amounts. Reference use only. Based on my experience high>$30B) Image
Feb 11, 2024 5 tweets 2 min read
$BTC Sunday update:

We're currently seeing the scenario that I mentioned on the last post playing out.

Consolidation around the 50% of the wick over the weekend means that we should fill the 100% of the wick at $49k.

Let's go through all the details:

1/5Image 
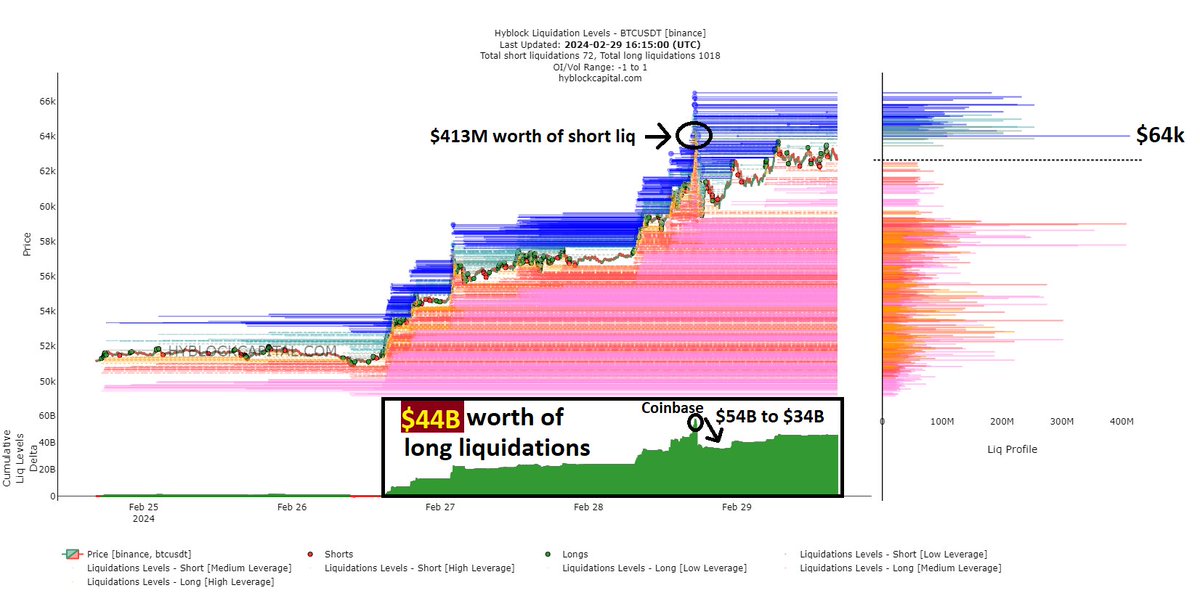
I found a few interesting things in the liquidation levels:

The first thing is that there is a serious risk of a long squeeze taking place because FOMO is hitting hard.

But we can see some liquidations at $49k too, which adds confluence to the 100% of the wick fill setup. Image
Sep 10, 2023 8 tweets 3 min read
$BTC Sunday update:

We had a very boring Price Action this week, but next week will be really intense!🤯

FTX is expecting to receive approval to liquidate assets on Wednesday, the same day as CPI (inflation report).

And PPI and ECB press conference on Thursday.

Let's dig up: Image 
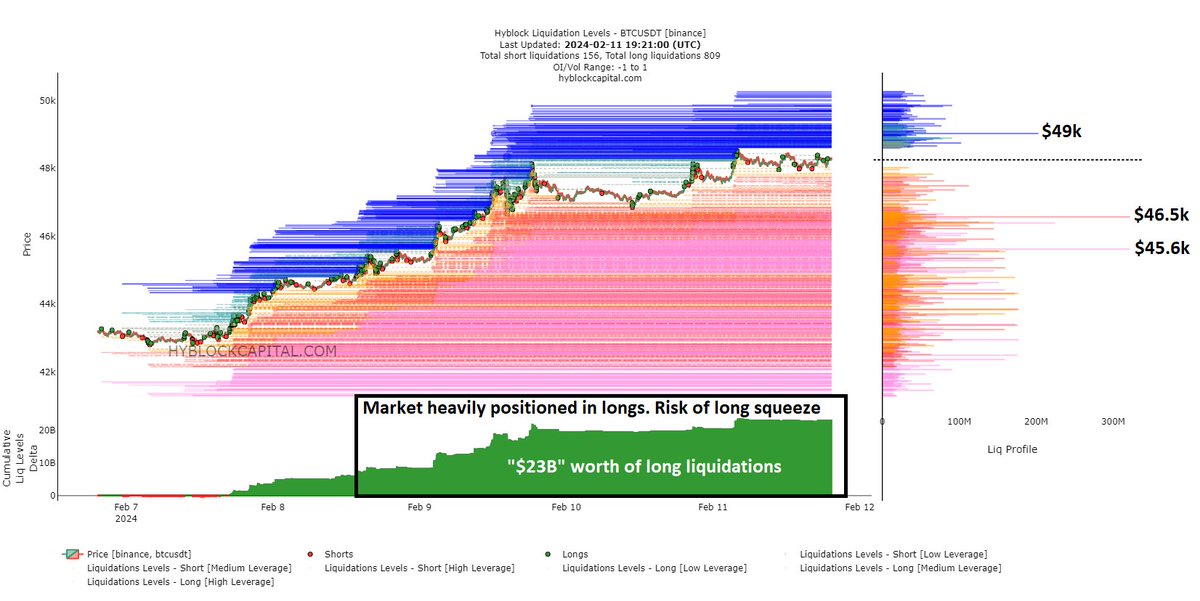
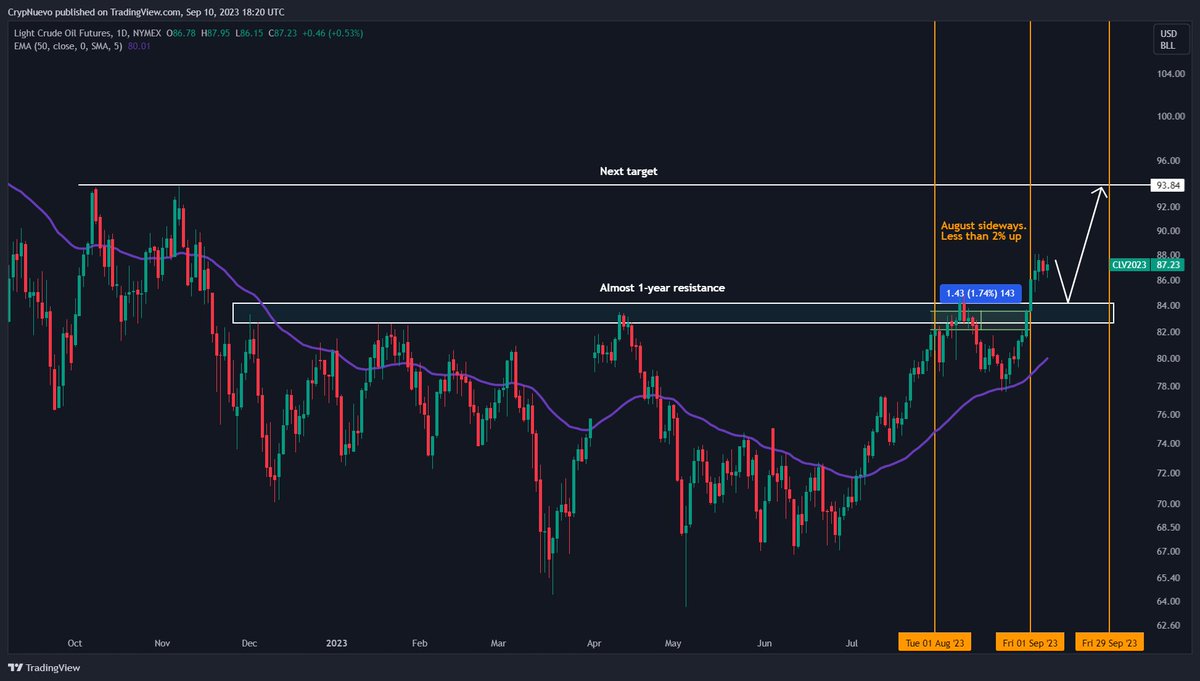
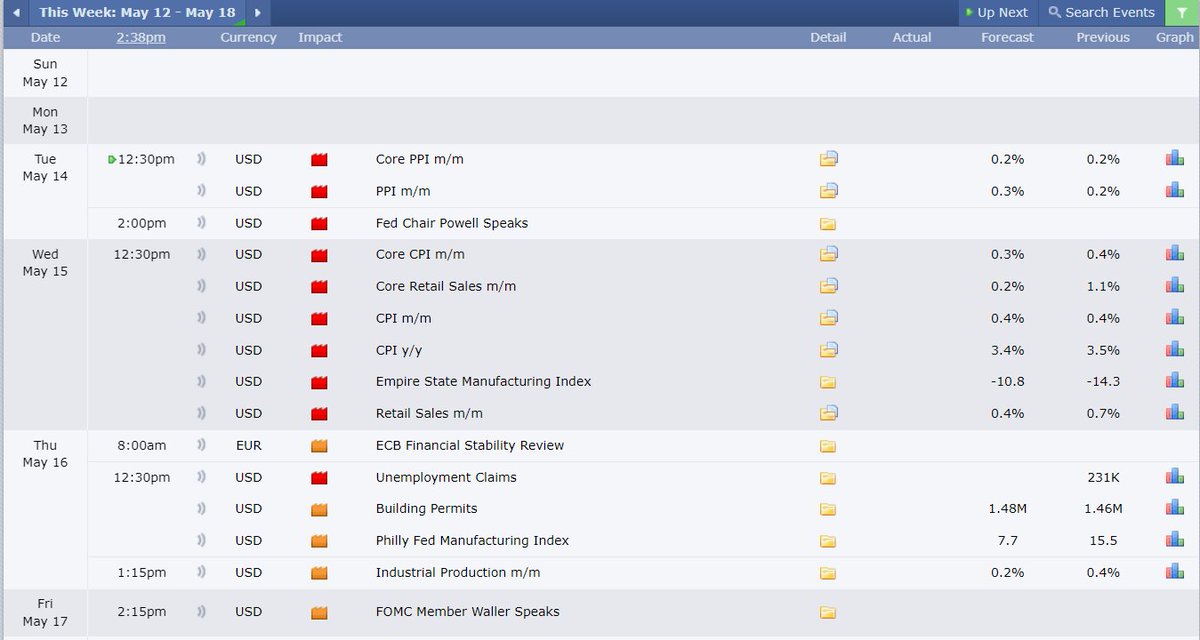
August CPI is expected to rise from previous 3.2% to 3.6%

The big problem that I see here is that next month's CPI will be much worse because it will reflect the increase in gasoline prices.

So if we see +3.6% on Wednesday, then I believe we'll def see 4% in the September CPI. Image
May 8, 2023 5 tweets 2 min read
$BTC Sunday update

The key days of this week will be Wednesday (CPI) and Friday (PPI and unemployment claims).

So I'm gonna make the most of this week on Monday and Tuesday; Wednesday after CPI results are out by trading imbalances; Thursday; and Friday after data is out.

1)
Current price is $28500 and we're between 2 liquidity zones:

- $27500 zone in 7 days time frame that matches with this wick that I have kept in my chart for days.

- And also $30300 zone. I'll go through this one in the next tweet. ImageImage