Goshawk Trades Profile picture
Turning Ideas Into Trading Systems | From 0 to 7+ Algos In 3 Years | Follow For Insights Into Data-Driven Trading And Algorithmic Trading | Not Financial Advice
7 subscribers
Nov 20 10 tweets 3 min read
This is Nassim Nicholas Taleb.

He's a Distinguished Professor, who predicted and profited from both the 1987 and 2008 market crashes.

He is also the author of one of the most influential books on market probability.

Here's how you can learn directly from him for free: Image Taleb is a mathematical statistician, former option trader, and risk analyst.

He is a fountain of knowledge regarding probability and statistics,

And you can find most of his "mini-lectures" on these topics for free online.

Here are 5 clips from the best ones: Image
Nov 13 10 tweets 2 min read
David Harding (billionaire quant hedge fund manager) once said:

“Anyone who's complacent in my business is waiting to have their head handed to them”

Here are 7 things I learned from him: 1. "We trade everything using trend following systems, and it works. By simulation, you come up with ideas and hypotheses, and you test those. Over the years, what we’ve done, essentially, is conduct experiments."
Nov 12 11 tweets 4 min read
How to create automated trading strategies that work (without overfitting):

(A thread) Image 1. Keep systems simple.

Focus on simple strategies built around core strategy types.

Simple systems are less prone to overfitting, easier to understand and maintain, and often perform better out-of-sample.

Just don't confuse simple with easy to do.
Nov 6 7 tweets 3 min read
4 probability concepts you need to understand as a trader to improve.

1. The power of large sample size. As sample size increases, results tend to converge to the expected value.

This is known as the Law of Large Numbers (LLN).

This is important to know as it plays a huge role in probability and expected value.

If you have too small of a sample size it is harder to trust. Image
Nov 5 8 tweets 3 min read
Larry Connors created one of the most popular strategy books ever written:

"Short Term Trading Strategies That Work"

After a decade, let's see how one of them fairs.

Here's what I discovered: Image The strategy:

1. The symbol is above its 200-day moving average
2. If the symbol closes at a 7-day low, buy.
3. If the symbol closes at a 7-day high, sell your long position.

Clean and simple with logical reasoning increasing the chances of the robustness of the strategy. Image
Nov 4 13 tweets 4 min read
11 books that could have saved me from losing thousands in my first year of trading.

1. Leveraged Trading: A professional approach to trading FX, stocks on margin, CFDs, spread bets and futures for all traders Image 2. Algorithmic Trading: Winning Strategies and Their Rationale Image
Oct 22 8 tweets 3 min read
The best free lectures on quantitative trading from the top universities in the world:

1. Mathematics with Applications in Finance by MIT. Over 20 hours of content ranging from:

• Probability theory
• Regression analysis
• Portfolio Management

Giving you a great introduction with no student debt needed. Image
Oct 21 12 tweets 3 min read
This guy found the secret to building momentum strategies.

• PhD in finance
• Former Marine
• Wrote one of the best momentum books out there.

His insights on momentum strategies are gold for systematic traders.

Here are the 6 key lessons you should know: Image 1. Momentum definition and basic concept.
Oct 16 11 tweets 3 min read
The biggest misconception in trading:

That everyone is using the same trading data.

Let me explain: Image First, we need to understand the common types of data providers:

• Raw Data Providers - Often unprocessed, tick-by-tick data.
• Consolidated Feed Providers - Aggregate data from multiple exchanges into a single feed.
• Aggregated Providers - Combining from multiple sources.
Oct 9 9 tweets 3 min read
One technique that has helped me create 6-figure trading strategies:

Monte Carlo Simulations.

But what is it? and how do you do the same?

Here's everything you need to know (explained simply): Image What are Monte Carlo Simulations?

It is a powerful statistical technique to model the probability of different outcomes.

At its core, it performs a risk analysis by resequencing the historical trades of a backtest.

It keeps doing this for 100s of iterations.
Oct 8 12 tweets 5 min read
I just finished backtesting 3 of the most popular volume trading indicators over the past 24 years.

The results were surprising...

Here is what I found summarized in 3 minutes: Image Context:

Each one of these indicators solve different problems when implementing them into a strategy.

I will discuss their basic implementation and provide a simple historical backtest,

But further testing techniques are necessary for more thorough validation of the results.
Oct 7 10 tweets 3 min read
9 books that explain how algorithmic trading works and how to get started:

1. Building Winning Algorithmic Trading Systems: A Trader's Journey From Data Mining to Monte Carlo Simulation to Live Trading Image 2. Quantitative Trading: How to Build Your Own Algorithmic Trading Business Image
Sep 25 14 tweets 4 min read
Look at this guy.

He built Renaissance Technologies, a hedge fund that returned 66%, per year for 30 years.

Dubbed the "Quant King", I watched 10+ hours of his public talks to learn everything I could about him.

Here are his most powerful lessons that made him $30 billion: Image The importance of large sample sizes to be able to tell the statistical significance of an "anomaly," e.g., a potential predictive signal.
Sep 18 19 tweets 6 min read
Over the past 5 years, I've read over 100 research papers on trading strategies.

And the truth is, 95% of them held absolutely no alpha.

So, I've created a list of 11 that would be worth your time (bookmark this thread): Context:

Most published ideas require refinement rather than immediate application;

Their true value lies in fostering creativity. I absorb as much information as possible to enhance my ability to build/find strategies.

So here are the 10 I found quite useful:
Sep 16 11 tweets 4 min read
Tim Grittani turned $1,500 into $13,000,000.

He has priceless insights into being a consistent trader as he has been so for over a decade.

Here are 6 takeaways on how he did it: Image 1. Focusing on one setup.

Concentrating on mastering a single setup before expanding can lead to faster profitability and development as a trader.

In the beginning, there is a lot of ignorance and debt you have to overcome to really understand a setup.
Sep 10 12 tweets 4 min read
This is Thomas Peterffy.

He's worth an estimated $38.3 billion.

He is the founder of one of the biggest brokerages in the world and was one of the first electronic traders.

Here's his story from 100 dollars to billions: Image Peterffy was born in Budapest on September 30, 1944.

In 1965, Peterffy emigrated to the United States with his father, but with no room for him he gave Thomas $100 and told him to "make something of himself".

He is now the 57th richest man.
Sep 3 10 tweets 3 min read
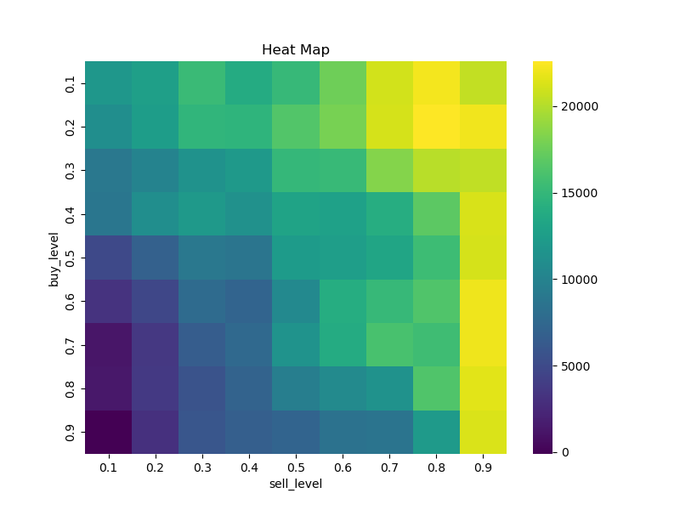
3 techniques to optimize any trading strategy that you need to know.

1. Grid Search Image Context:

Be careful with the optimization of strategies, as they can often lead to overfitting if done aggressively.

Make sure to combine your testing with robustness tests as well.

With that out of the way, here are three optimization techniques explained simply:
Aug 26 10 tweets 4 min read
This is Shigeru Fujimoto.

An 87-year-old investor who has made over $12,000,000.

He is often referred to as "Japan's Buffett".

Here's his investing lessons: Image Context:

Shigeru Fujimoto was born in 1936 in Hyogo prefecture.

Despite his family's agricultural background, Fujimoto chose a different path and began working in a pet shop.

After leaving the pet store at age 19, Fujimoto started a Mahjong parlor in Kobe. Image
Aug 21 7 tweets 3 min read
Parameter Sensitivity is one of the best tools in quantitative trading.

But 99% of traders don't understand it.

Here's how it works explained simply so you can build better strategies: Image What is Parameter Sensitivity?

It measures how changes in input parameters affect a trading strategy's output or performance metrics.

These metrics could be:
• Total return
• Sharpe ratio
• Max drawdown

The primary objective is to tell how sensitive the strategy is. Image
Aug 19 8 tweets 3 min read
6 books that explain how the market works.

1. Market Microstructure in Practice Image 2. Algorithmic Trading and DMA: An introduction to direct access trading strategies Image
Aug 14 8 tweets 3 min read
5 statistical illusions that uncover why your backtests are misleading.

1. Data snooping. Image This occurs from overfitting a strategy to noise in the data by commonly testing too many parameters with your optimization.

Such as using 50 parameters on 2 years of data.

A good way to avoid this is to focus on simplicity, use out-of-sample testing and logical parameters.