
Aerospace engineer by training, ME/CFS & Long COVID patient researcher, cofounder @amaticahealth. DMs open, rarely check follows - https://t.co/BvmsOvch0p
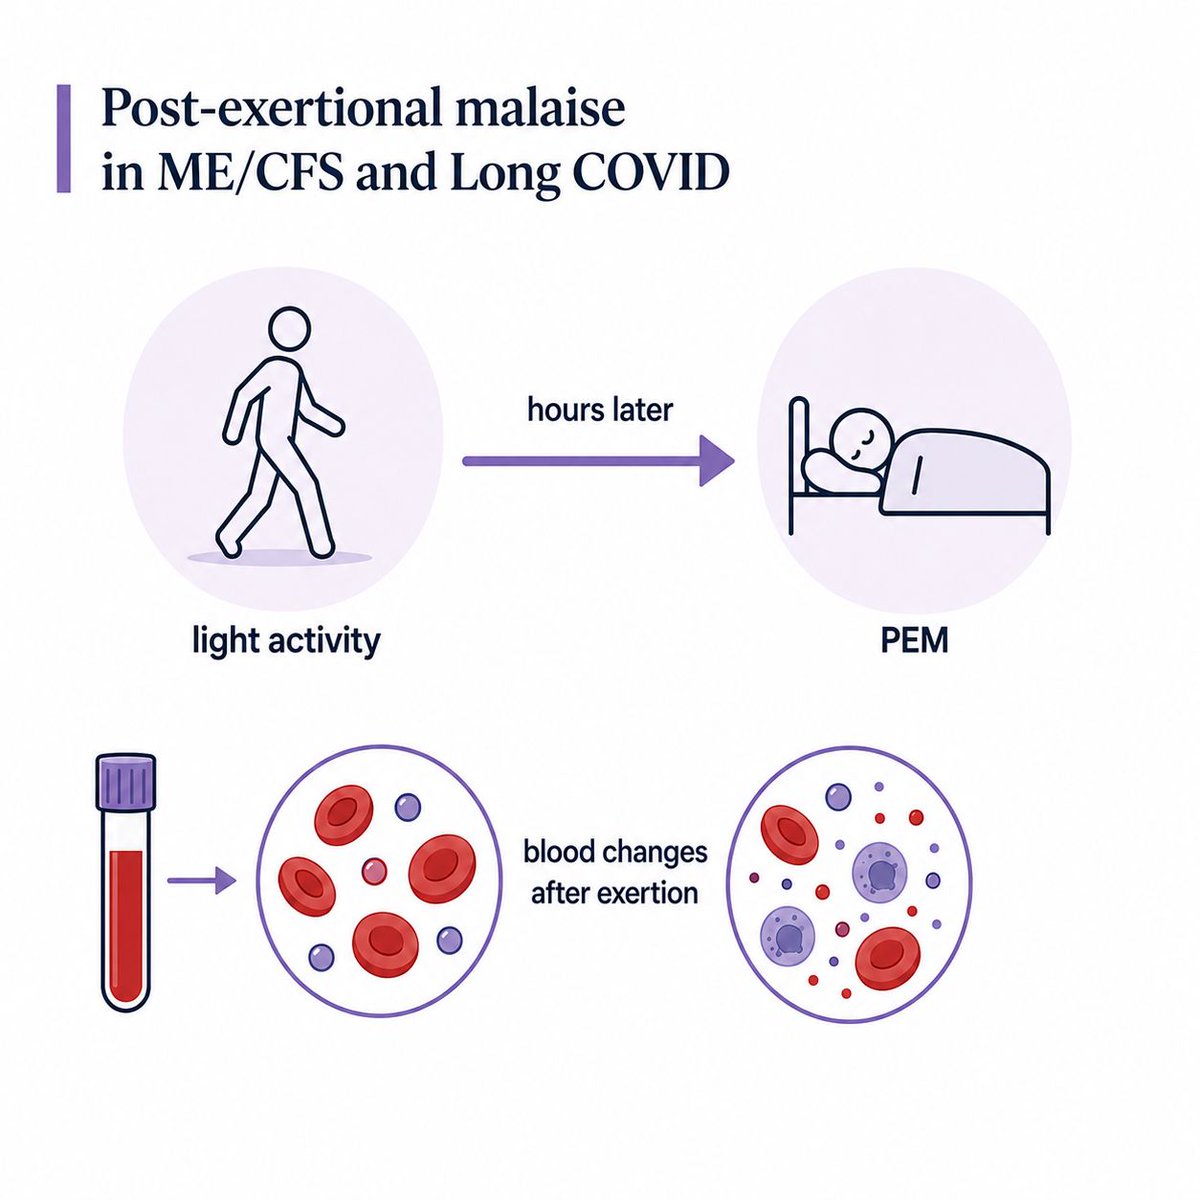 A resting blood sample gives one snapshot. Testing the same person before and after exertion lets researchers see which signals move as symptoms are triggered, rather than only comparing average patient and control groups.
 The study included 89 people with fibromyalgia. Fifty-seven also had a skin biopsy, where a very small piece of skin is removed and examined under a microscope.
 Persistence means material from SARS-CoV-2 remains after acute infection. This could be whole virus, low-level replication, viral proteins or leftover RNA fragments. These are not the same thing and may have very different effects.
 Blood volume includes plasma, the liquid part, and red blood cells. A routine blood count can still look normal because it measures concentration, not the total amount of blood moving around the body.
 A healthy red blood cell is soft and flexible. It folds to pass through capillaries, some narrower than the cell itself,then springs back into shape. This helps oxygen reach tissues throughout the body.
 Autoimmunity means part of the immune response reacts against the body's own molecules, cells or receptors. Viral persistence means SARS-CoV-2 material or activity remains after the acute infection.
 The study recruited 74 children with post-COVID illness. The main vessel-width comparison used 58 of them and 58 healthy controls matched for age, sex and body mass index.
 Antibodies are immune proteins that recognize targets. Autoantibodies are antibodies that react with the body's own cells or proteins.
 Researchers compared 28 people with acute COVID, 50 people with neuropsychiatric Long COVID, and 29 people who recovered after COVID. They also checked a separate Johns Hopkins group with later Long COVID, around 3 years after infection.
 The study included 84 people aged 25 or younger: 61 with long COVID and 23 healthy controls. The long COVID group had common circulation-type symptoms, including dizziness when standing, shortness of breath on stairs, and palpitations.
 CSU is chronic spontaneous urticaria.
  Older ME/CFS brain scans often disagreed. The usual method can show change, but not clearly whether it means extra fluid, extra cells, damaged fibres, or something else. This also builds on earlier blood and brain-scan work that hinted at inflammation.
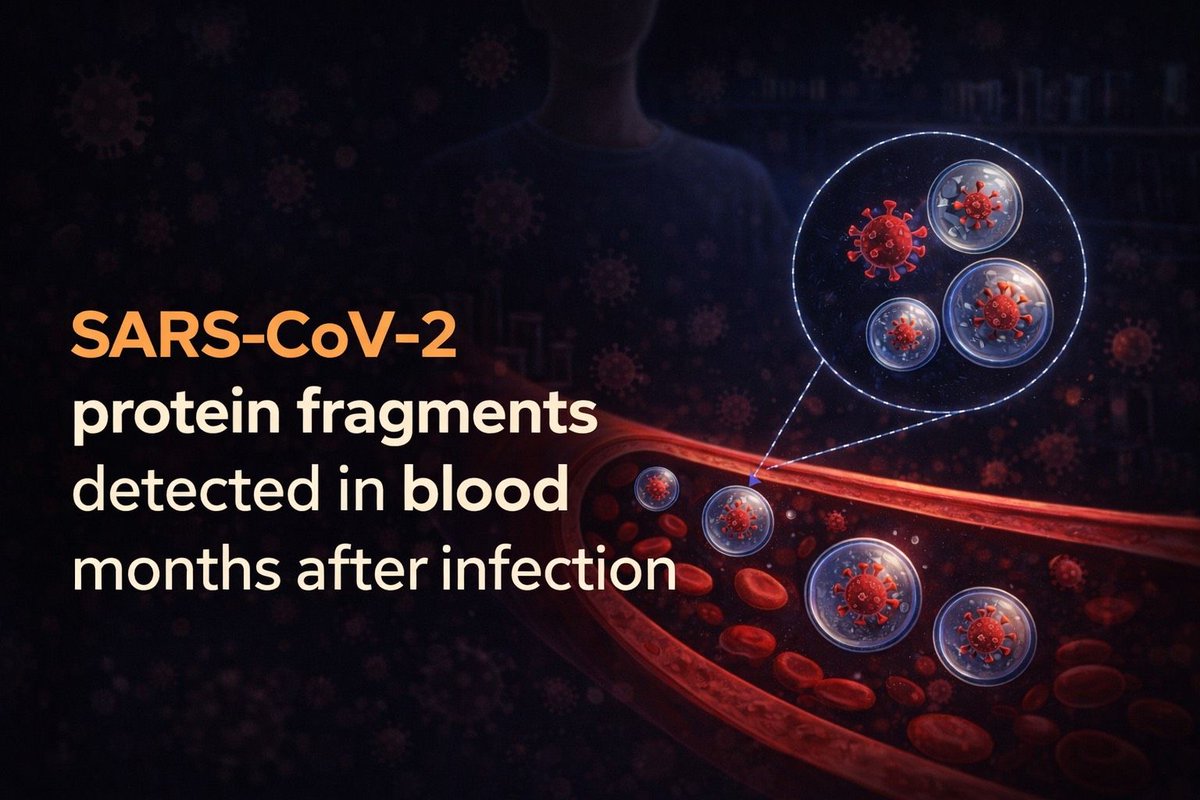 Those tiny particles are extracellular vesicles (EVs). EVs are small packages released by cells into the blood that can carry proteins and other material.