Data journalist @TheEconomist covering everything under the sun, but now with a British focus.
Feb 25, 2021 • 11 tweets • 7 min read
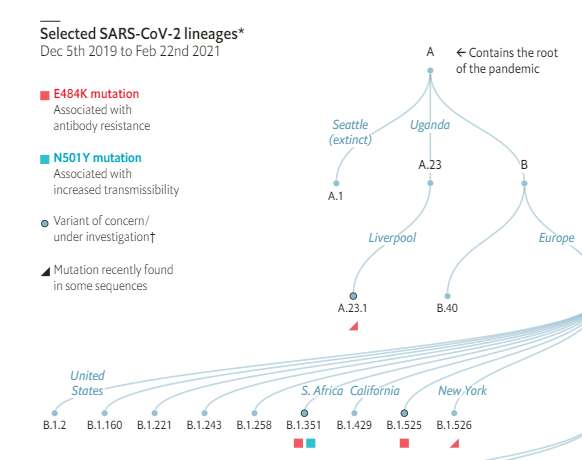
Variants, lineages, mutations: the SARS-CoV-2 pandemic has brought a lot of scientific terms into the mainstream. Our "Graphic Detail" visualises how SARS-CoV-2 has changed since it was first discovered in Wuhan (a thread: 1/10)
economist.com/graphic-detail…
Our phylogenetic tree uses global data from @GISAID. We visualise 36 of the 880 lineage classified by @NetworkArtic's Pangolin. Together these lineages contain 68% of the 560,000 SARS-CoV-2 sequences classified. (2/10)
Mar 12, 2020 • 9 tweets • 4 min read
As covid-19 takes hold across the world how are cities and their citizens responding? (a real-time thread: 1/n)
economist.com/graphic-detail…
Good data is actually quite tricky to come by. To find out we looked at Google. Recall that feature on your phone that gives a real-time reading of whether places are busy or not?
(here's the one Grand Central station, right now). (2/n)
Feb 11, 2020 • 15 tweets • 7 min read
Forget the January blues, our data analysis finds that February is the year's most miserable month.
How do we know? A thread (1/15)
economist.com/graphic-detail…
15 years ago Cliff Arnall came up with an equation to calculate the year's most miserable day. He defined it as some relationship between the weather, household debt and income, the days elapsed since Christmas, and a few other variables. (2) en.wikipedia.org/wiki/Blue_Mond…
Aug 14, 2019 • 12 tweets • 3 min read
Yield curve inversions in America and Britain are worrying some pundits. But do these inversions actually predict recessions? (A thread: 1/12) econ.st/2K5czHf
The yield curve is said to be “inverted” when the interest rate on long-term debt falls below that of short-term debt. (2/12)
Mar 20, 2019 • 9 tweets • 3 min read
Today is "International Day of Happiness" :)
To mark this wonderful event we've explored that age-old question:
Does money buy happiness?
(a thread: 1/8)
>>> econ.st/2YaSDJp <<<
Plot GDP per person against self-reported happiness and the relationship appears strong: doubling GDP results in happiness increasing by about 0.7 points (on a ten-point scale). (2/8)