UW-Madison (Prof. of Health Econ.). Also Univ. of Galway, NBER.
(Twitter header image: The Reading Room (detail), by Eoin O'Malley)
Dec 2, 2021 • 9 tweets • 3 min read
Am using this nice JEP paper by Guido Imbens for teaching this week. While in many ways obvious, this excerpt makes explicit what is (IMO) not often enough made explicit. aeaweb.org/articles?id=10…
Contrast this with R.A. Fisher in 1926, whose mindet has cast a long shadow over analyses for nearly 100 years. repository.rothamsted.ac.uk/item/8v61q/the…
Feb 23, 2021 • 12 tweets • 4 min read
In light of yesterday's massive thread on Poisson regression I thought it perhaps appropriate to revisit an issue that arises sometimes with Poisson estimation in Stata.
This will be familiar to some of you but perhaps not to others.
The typical case is where there are ≥1 dummy RHS variables that are almost always 0 (or almost always 1).
Feb 22, 2021 • 7 tweets • 2 min read
I propose naming this approach the Jeffit estimator.
"We used Jeffit to estimate the average partial effects and their .95 CIs."
"We compare our main results with those obtained using Jeffit."
May 27, 2020 • 5 tweets • 2 min read
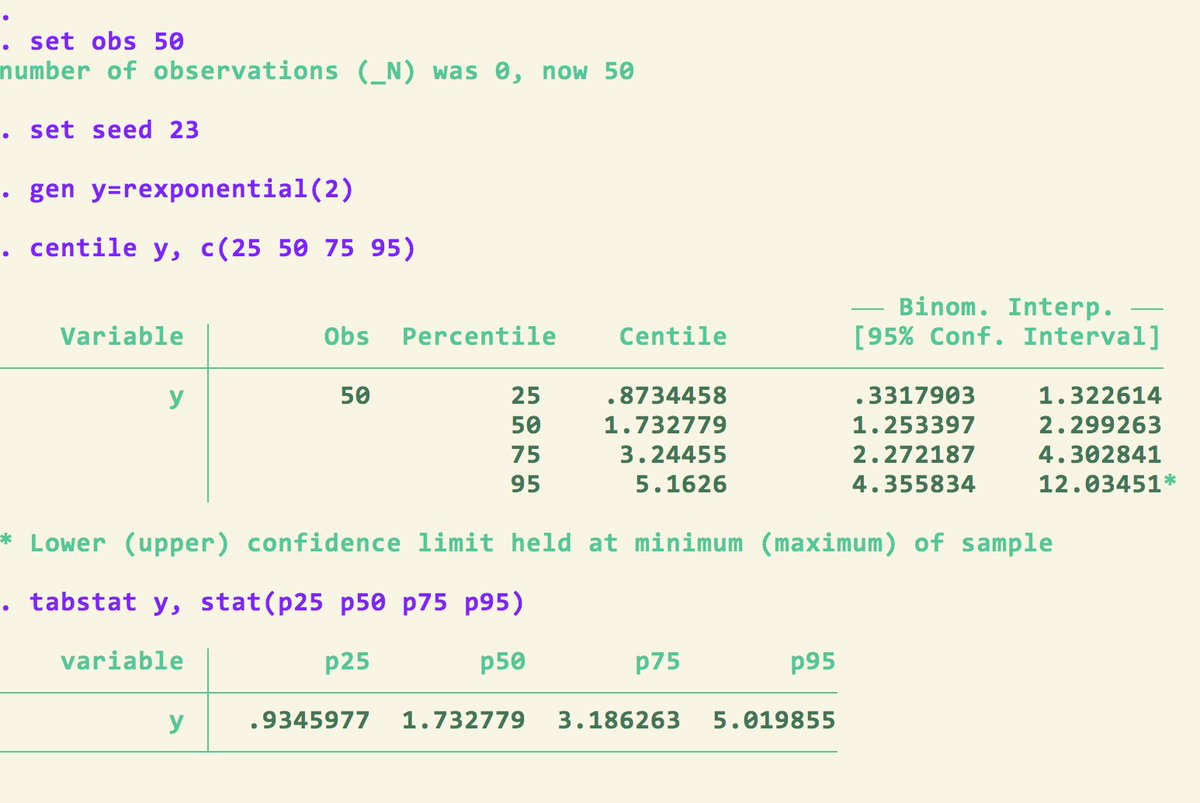
If you use @Stata to compute/estimate quantiles/percentiles there's a Statalist thread that may be of interest. (Spoiler: Different commands can yield different results—except for the median—so exercise care with tail-probability, IQR, etc. calculations.) statalist.org/forums/forum/g…
This is probably a negligible concern when analyzing most "large" samples, but not necessarily so for "small" ones.
May 11, 2020 • 9 tweets • 2 min read
Earlier threads have considered the use of the –recast– option in @Stata graphics. Here's another.
The –twoway function– command in Stata permits nice visualizations of explicit functions y=f(x) over some continuous domain of x-values. E.g.