
Passionate Engineer. Talk about Energy, Markets & sustainability. Tweets are my own.
https://t.co/7SGL5DA0V1
 First, what we are witnessing in Europe is a massive growth of utility-scale projects, and actually a reduction of home batteries.
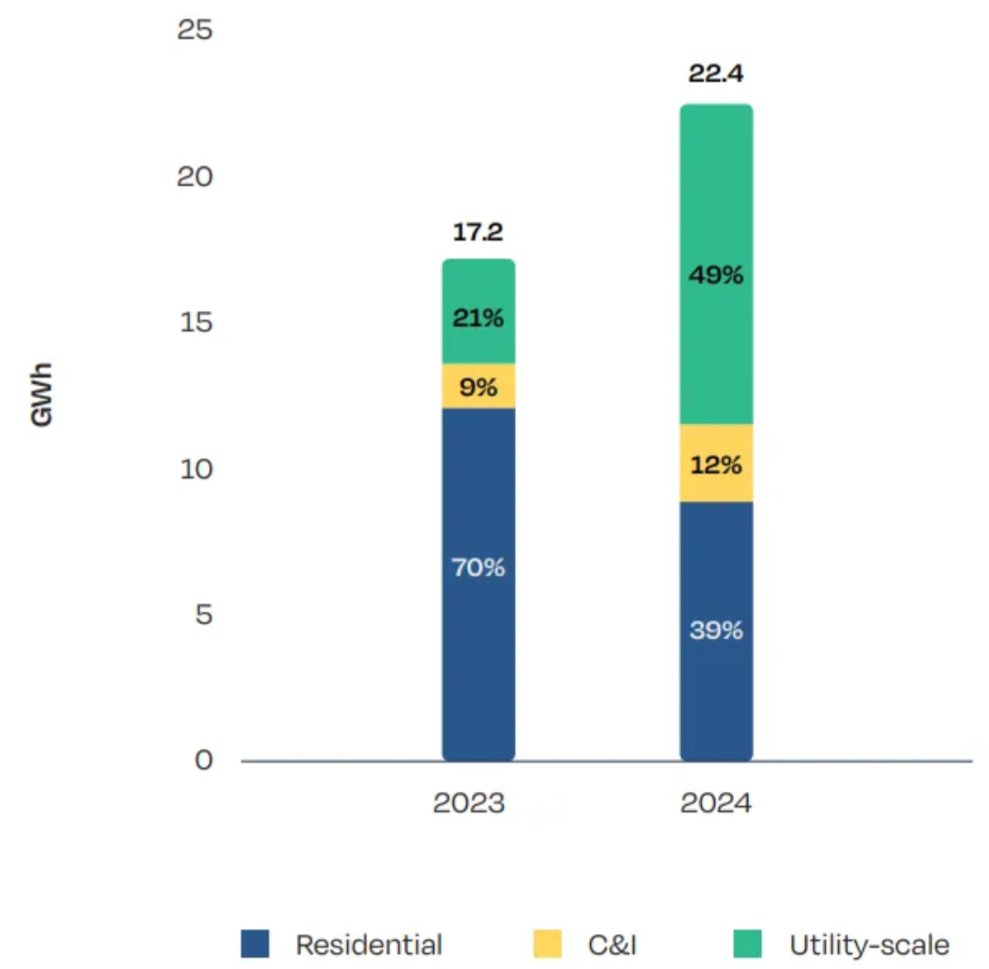
 And the daily average is close to 400 €/MWh.
 ... that's why we plan to install a lot of it.

 First, market revenues of renewables are declining, and fast for solar.
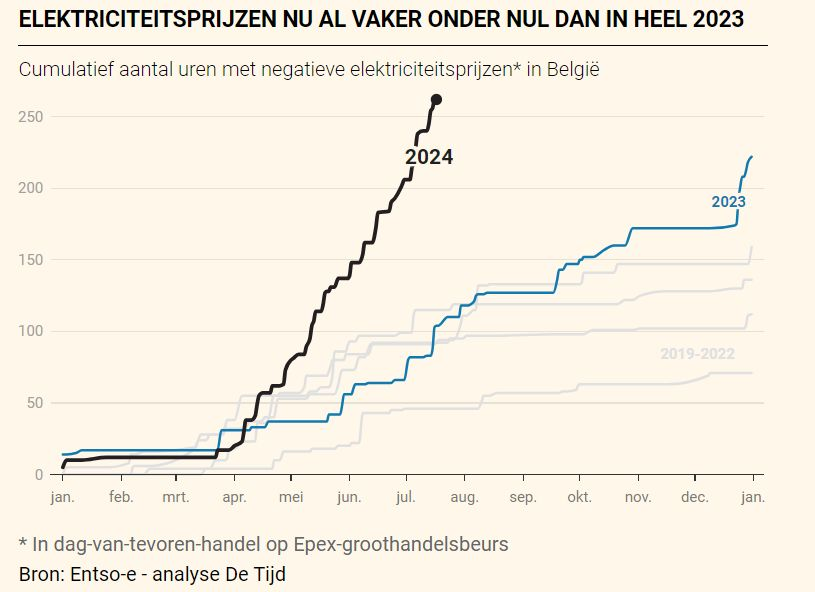 First, let's be clear, negative prices are increasingly present when solar is generating (at least in Germany, see below)
 Germany: hello prices at +2000 €/MWh. Peak prices being really really high ...
 Hungary as well at 275 €/MWh.
 First. Solar is in its second wave in Germany.
 But solar is really concentrated. On 14 May, record of 47 GW ("only" compared to a peak installed cap, of 80+).
 Most important element: many households and small business still receive a fixed amount per kWh, whatever the market value of solar. Tariffs for new PV is now 8.1 c€/kWh (for 20 years !) while the market value was only 3.8 c€/kWh in April 2024 (see below).
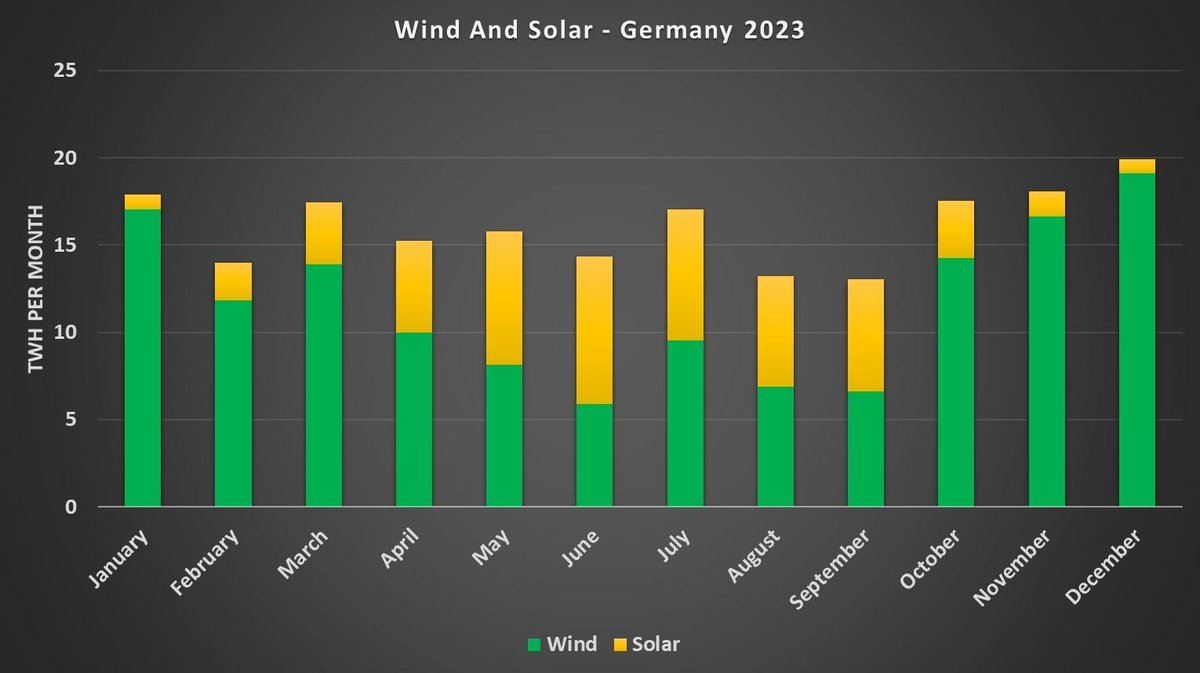 Of course, this complementary depends on the installed capacity. As solar is growing faster now than wind, we might have a different picture.
 As I explained here, you have 30 GW more must run supply in the market.

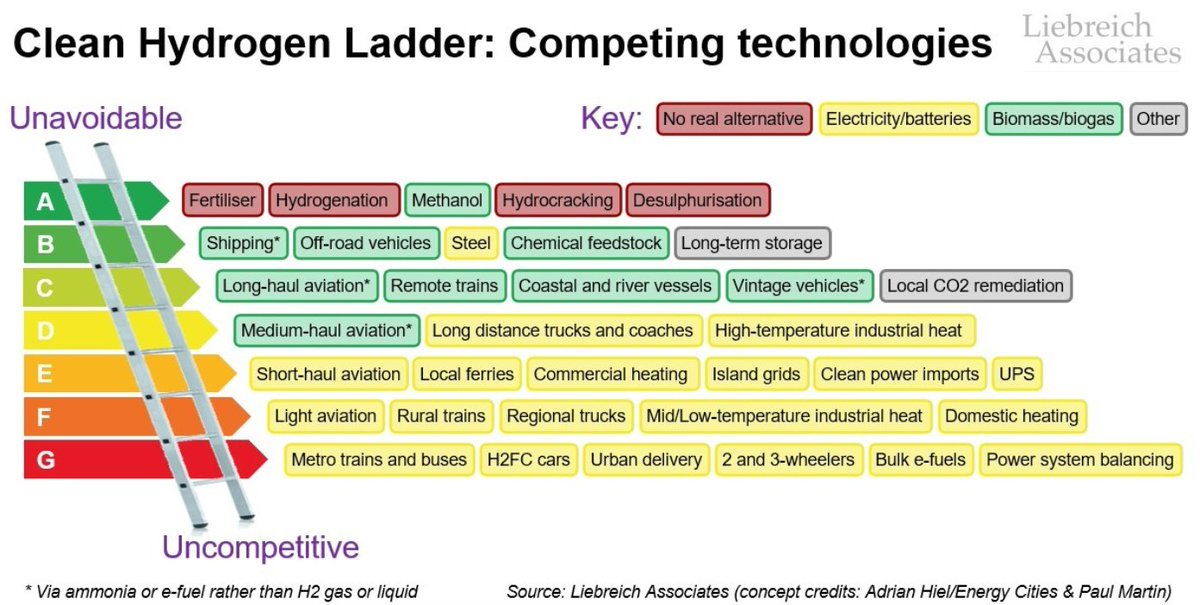 Long-term storage for electricity is our ability to save some energy in one month and give it back a few months later.

 It is inflexible because you will receive a fixed amount independent of the markt price. From 6 to 13 c€/kWh, depending on the size and if you auto-consume or not.
