Justice through Data - one Price America, no Rural Discount - ApplePai - The Wai Forward -
Feb 4 • 6 tweets • 1 min read
Vaccine manufacturers will have to get insurance if the 1986-act is repealed, allowing lawsuits without merit to swamp and stop US manufactured childhood vaccines in the US. Following is a list of charges per dose which Manufacturers will have to carry if 1986 is removed
1/n
Block A- age 0-2 - $400 insurance per dose
No American vaccine manufacturers will participate in Block A as average dose will result in a loss
Non-US manufacturers will step in from China, India, etc
2/n
Dec 21, 2024 • 6 tweets • 3 min read
Day 0: bulk tank tests low positive
Day 4-5: a sick cat on the farm
Day 6: many cats die on the farm
Day 7: first cow shows symptoms
Day 10: multiple cows show symptoms
Day 11-30: very sick cows need 60 gallons of electrolyte-water pumped into their stomachs to keep them alive
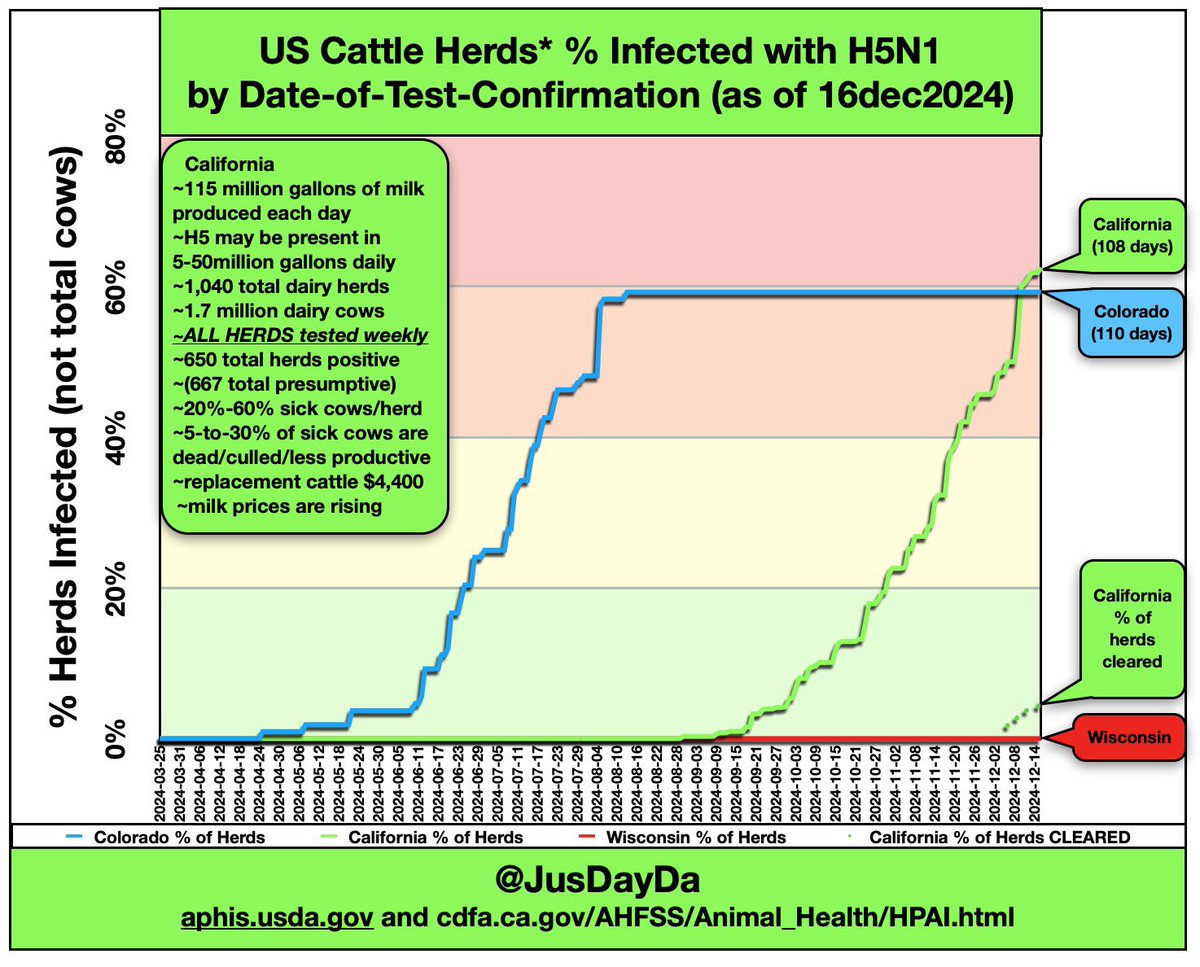
Day 31-80: bulk tank keeps testing positive as it moves through 60-80% of herd
Day 80-240: milk production drops across the herd 2-6%
Nov 14, 2024 • 7 tweets • 2 min read
2024
US returned to baseline for the youngest age groups.
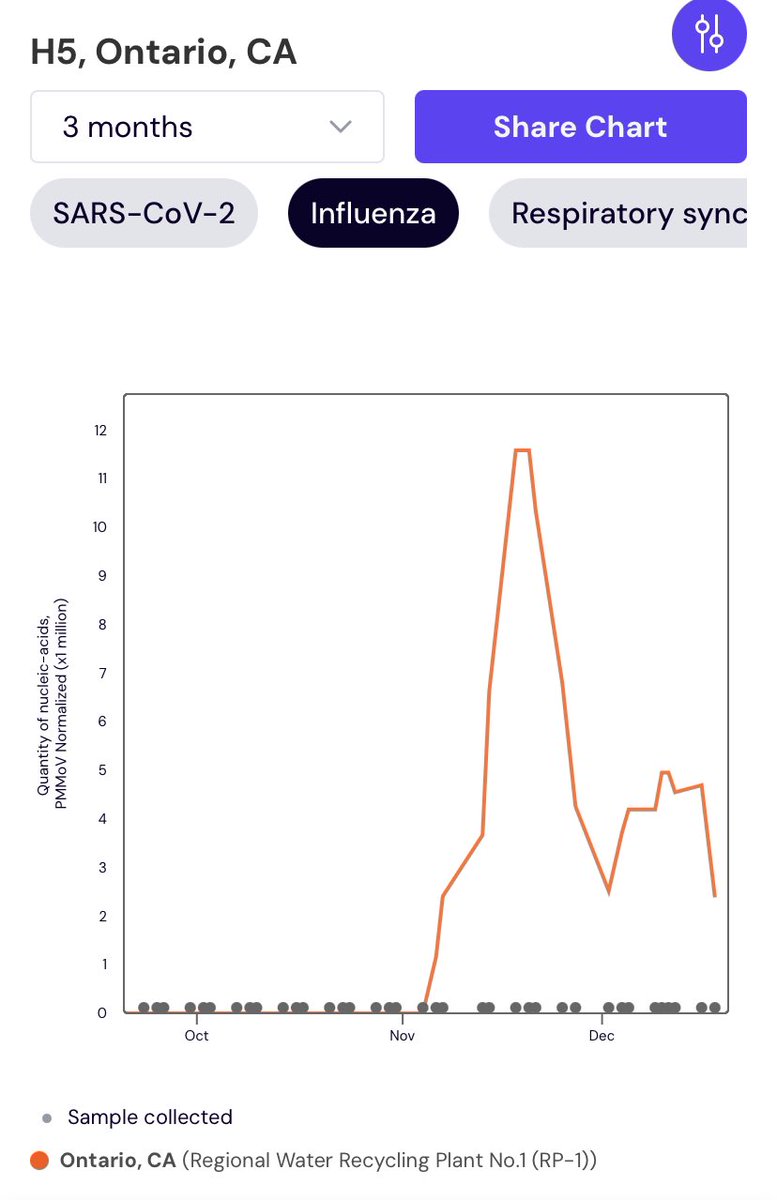
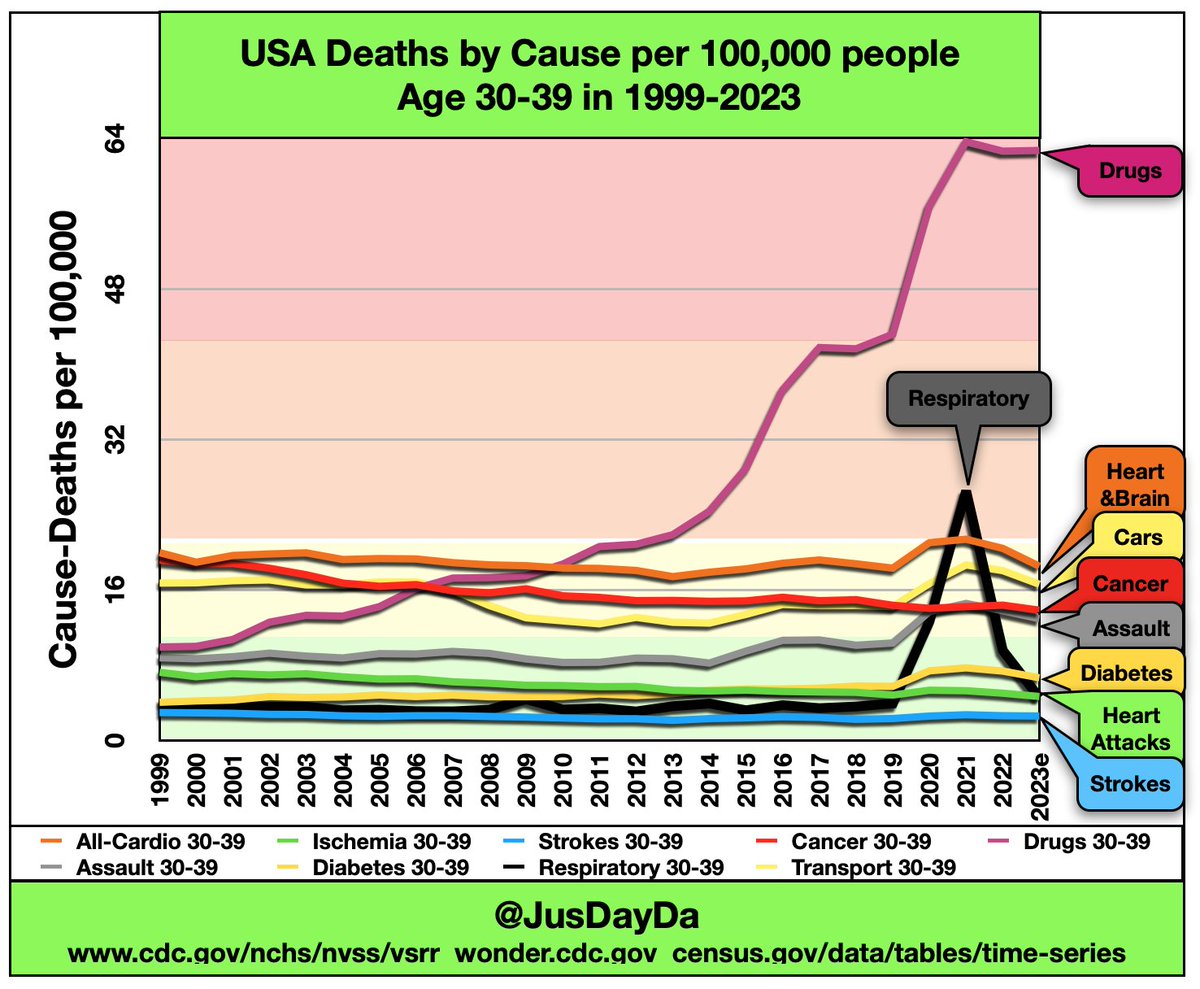
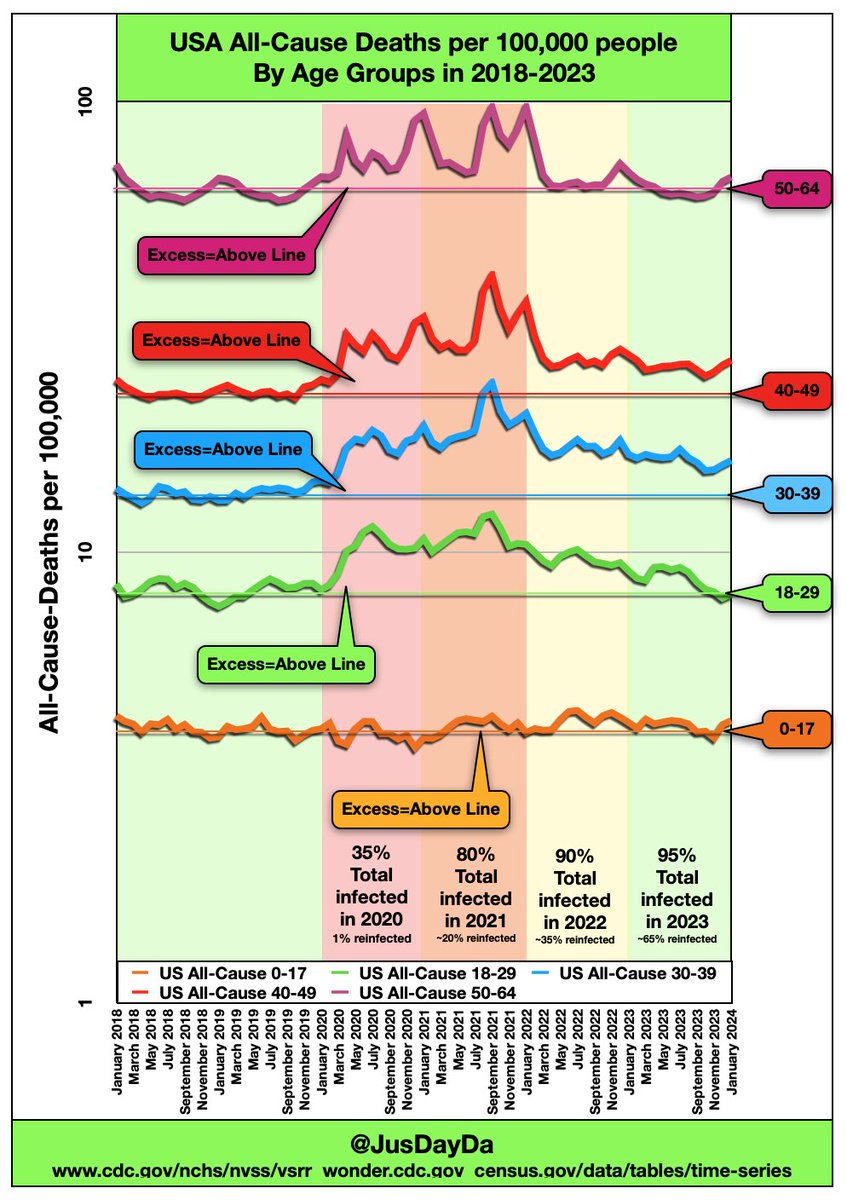
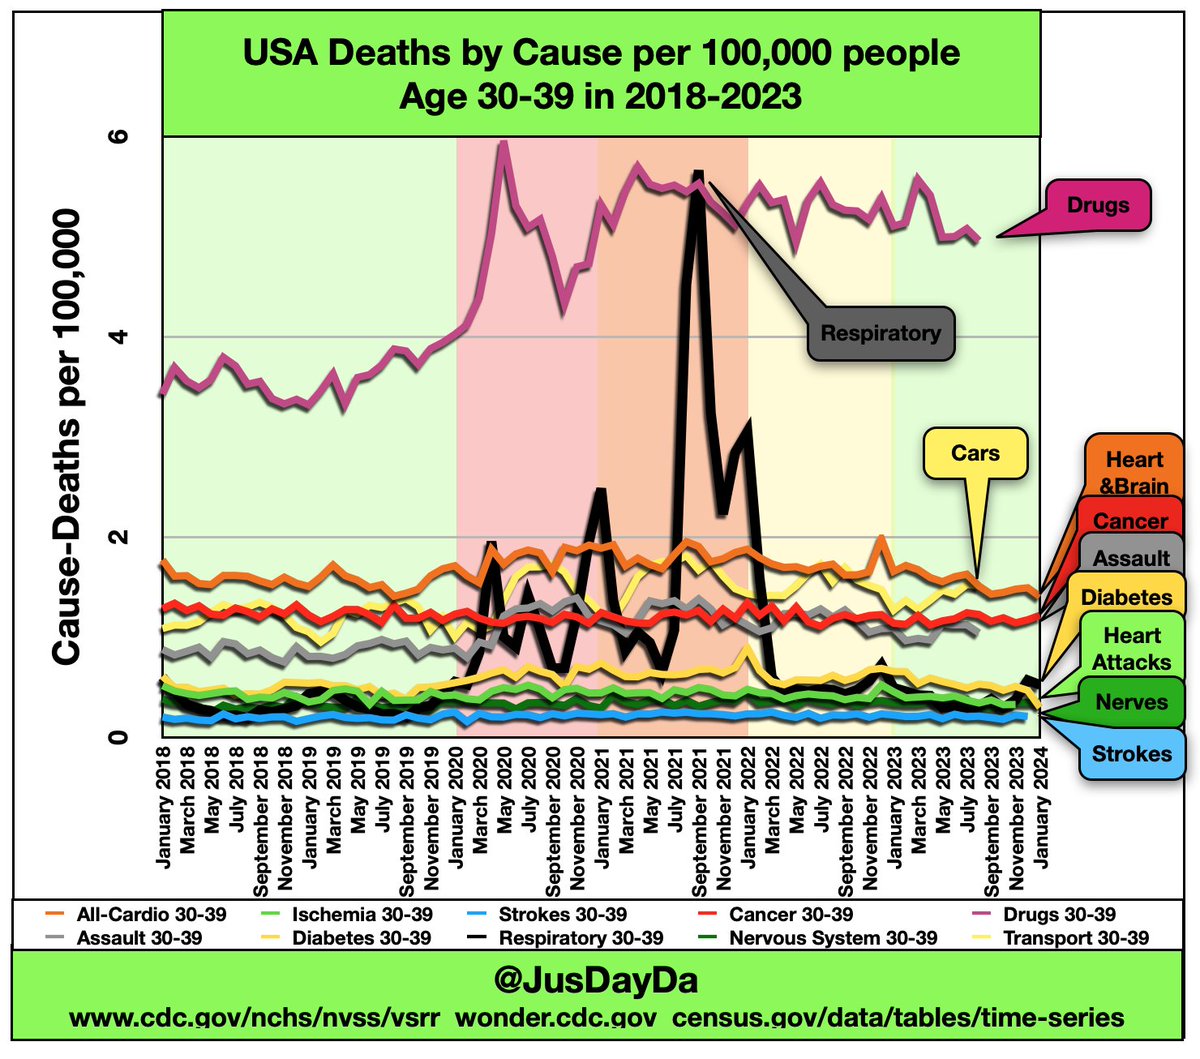
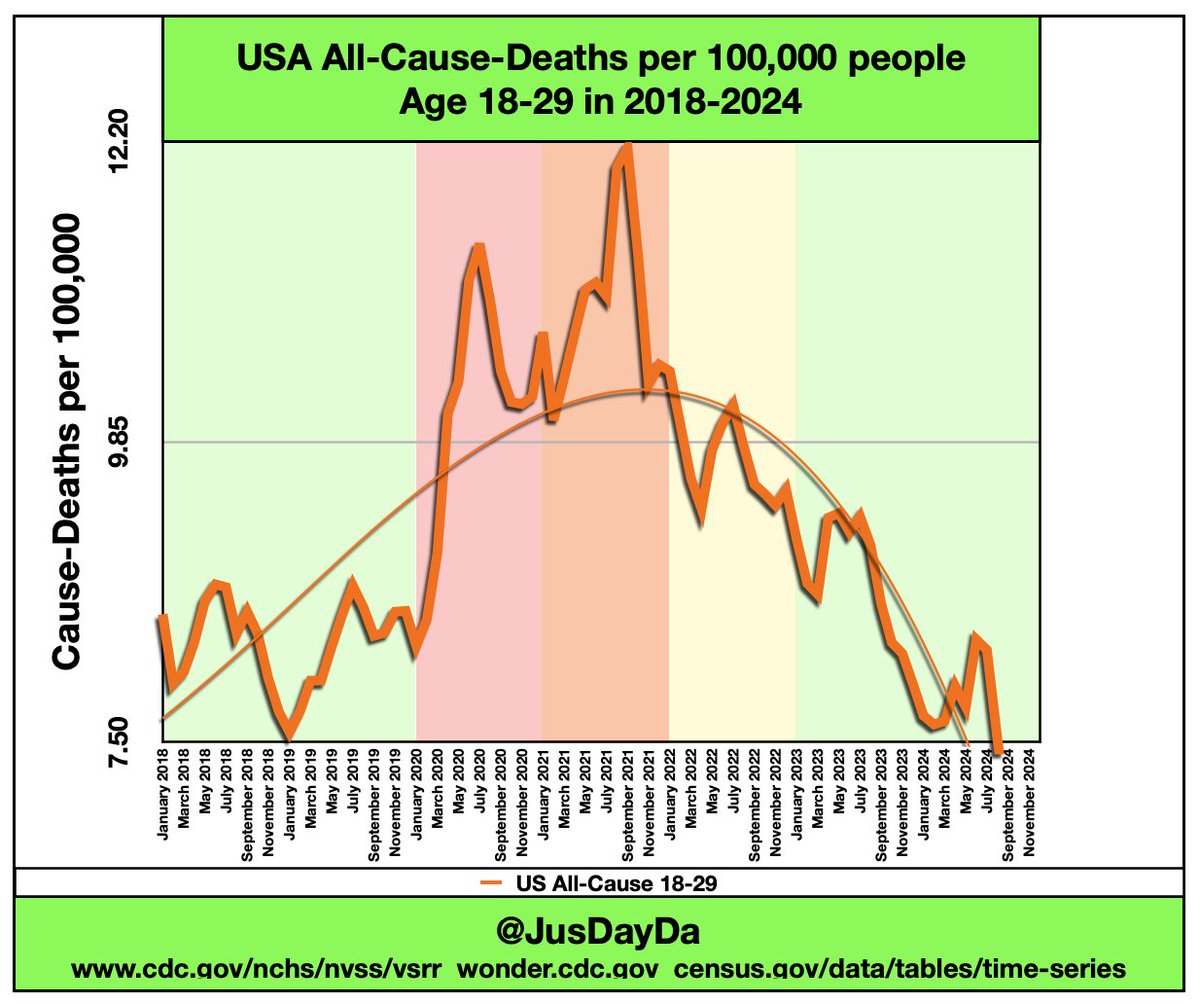
Age 30-39, the hardest hit age group during Covid infection waves, is almost back to pre-pandemic baseline.
Oct 29, 2024 • 6 tweets • 3 min read
FluA Spring 2023
Ottumwa, Iowa
-first off-season peak in Mar 2023
-duplicated in Mar 2024 (alongside Amarillo Texas)
Anchorage, Alaska
-Oct 2023 remarkably high
-Remained high 2024 spring and summer
-very little dairy in Anchorage
Turlock, California
-off the charts Oct 2024
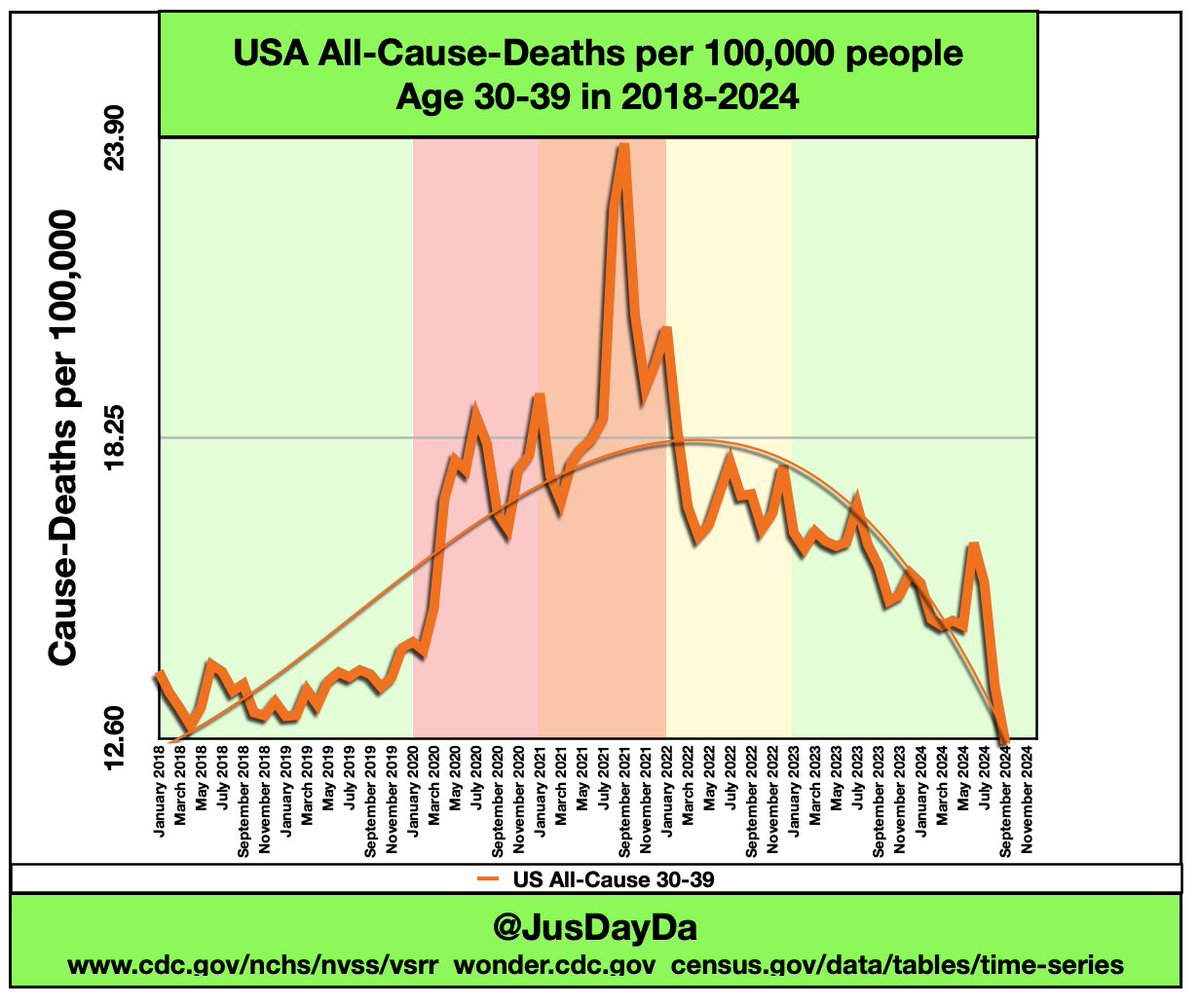
California now has confirmed H5 infections in 186-208 herds out of 1,100-1,300 total
(14%-19% of state total herds confirmed positive in 8 weeks)
All California herds may soon be required to weekly test bulk tanks, including recovered herds.
Oct 27, 2024 • 5 tweets • 2 min read
H5 in California
highest reading of the Bovine outbreak of bird flu
Any Covid reading over 1000 is high
Any FluA reading over 100 is high
Any H5 reading over 50 is high
Turlock is over 1000.. for H5
(that is not an error)
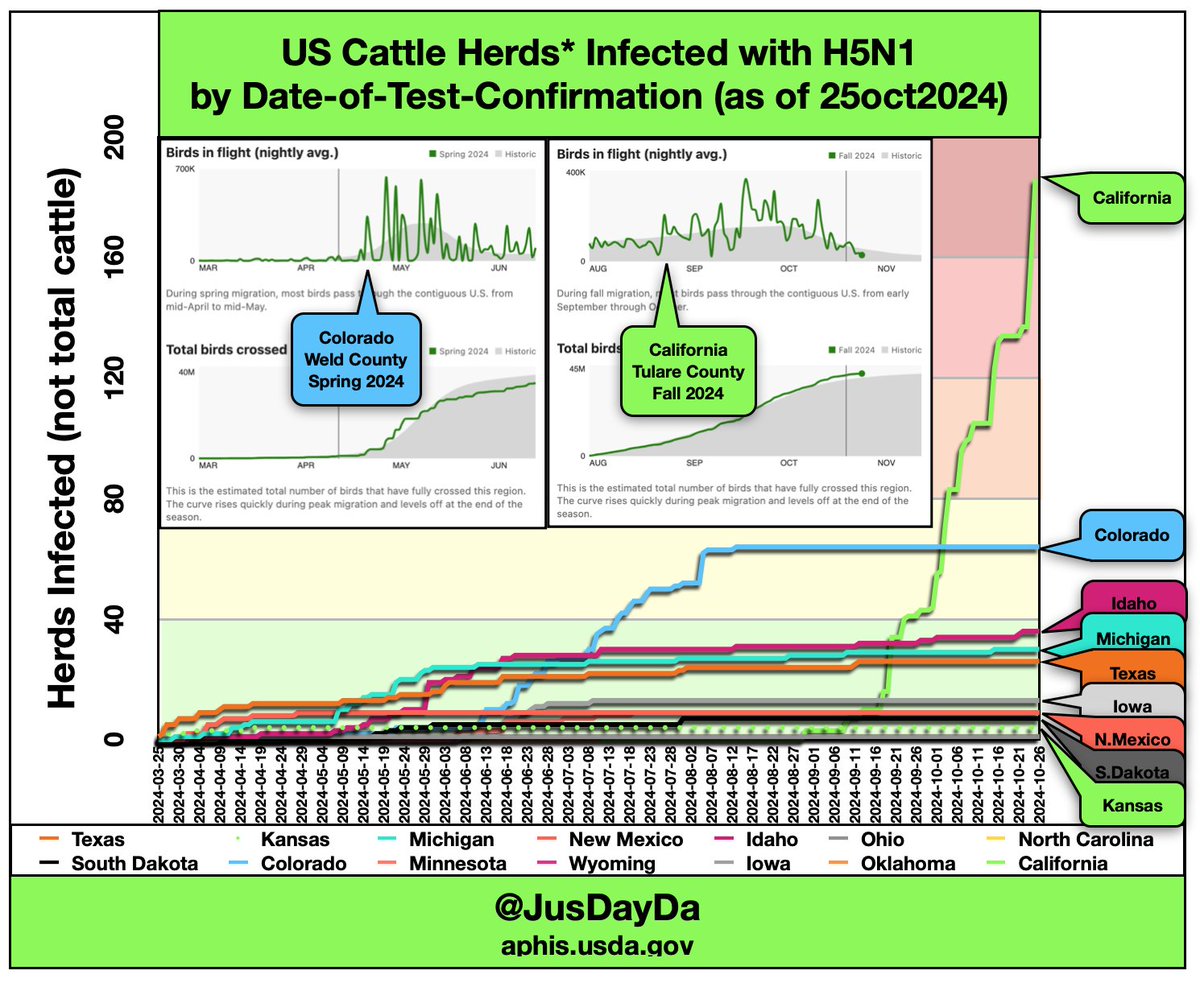
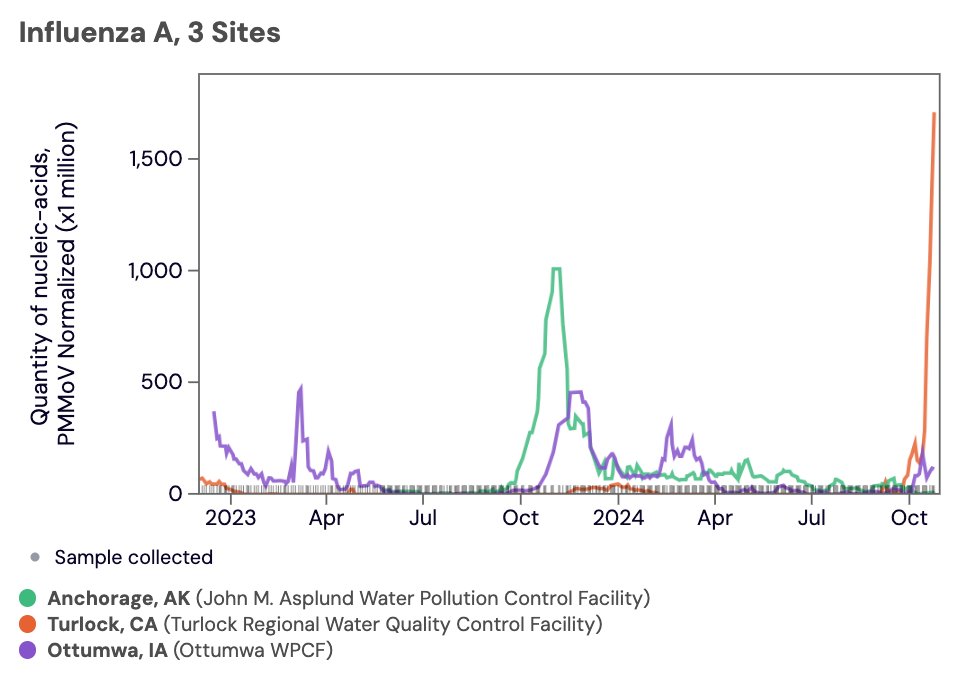
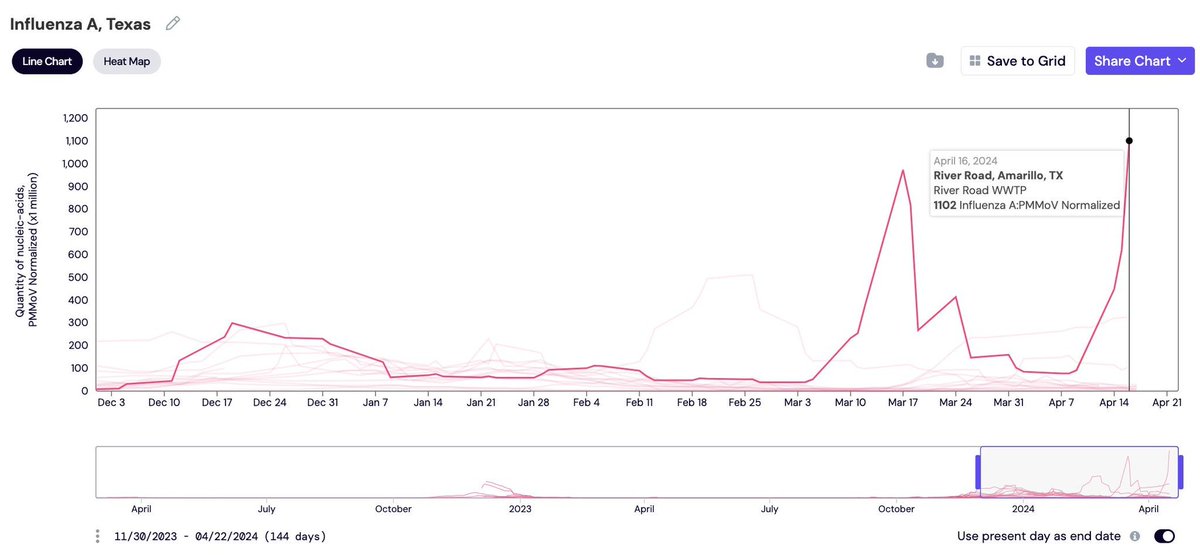
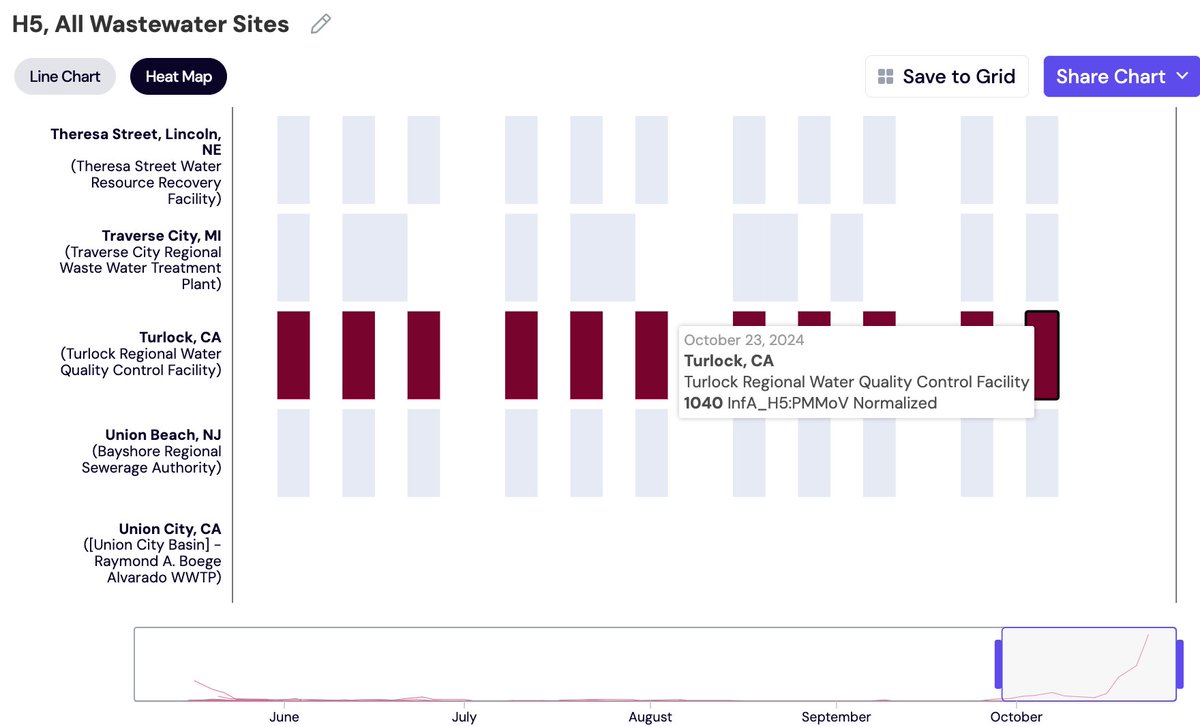
This is H5 in Turlock wastewater (a town that processes milk powder, butter, cheese, other milk products, carcasses)... Whatever is happening there is now significantly exceeding the level of FluA in Amarillo Texas March-April 2024, even higher than Anchorage Alaska in Fall 2023
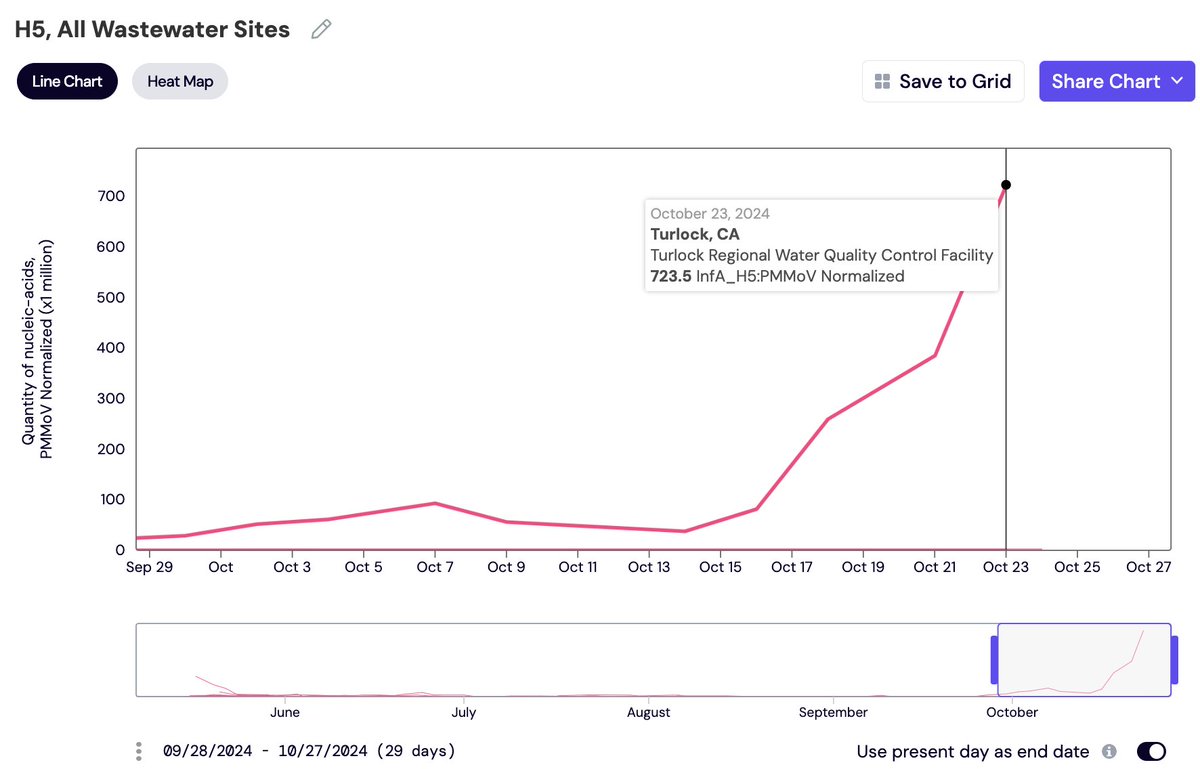
May 8, 2024 • 10 tweets • 4 min read
Younger age groups had higher percentage rises in deaths during Covid...
(wait... what?)
1/10
2/10
All-Cause-Deaths by population
A line drawn through 2018-2019 to show historical averages
Note, we see a wave where older people tend to die in Winter (respiratory season) and younger people tend to die in summer (driving season)
Covid changed things
Apr 30, 2024 • 6 tweets • 2 min read
Now that we know that #H5 was responsible for most Spring Flu A rises in Amarillo Texas and Northeast of Dallas Texas, we can look at Flu A comparing December peaks to current
3 of 4 Dallas area watersheds showing elevated Flu A in late April 2024
Purple line is Dallas Central
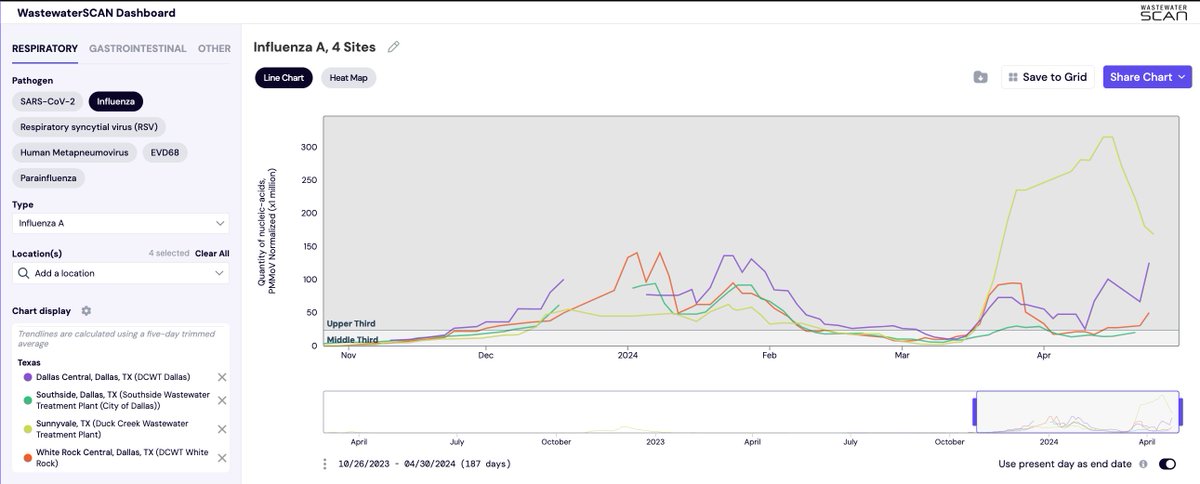
Pre-print discussing @Verily scientists @MarleneKWolfe working alongside @WastewaterSCAN team to identify H5 in wastewater (and backtesting to early March in Texas wastewater)
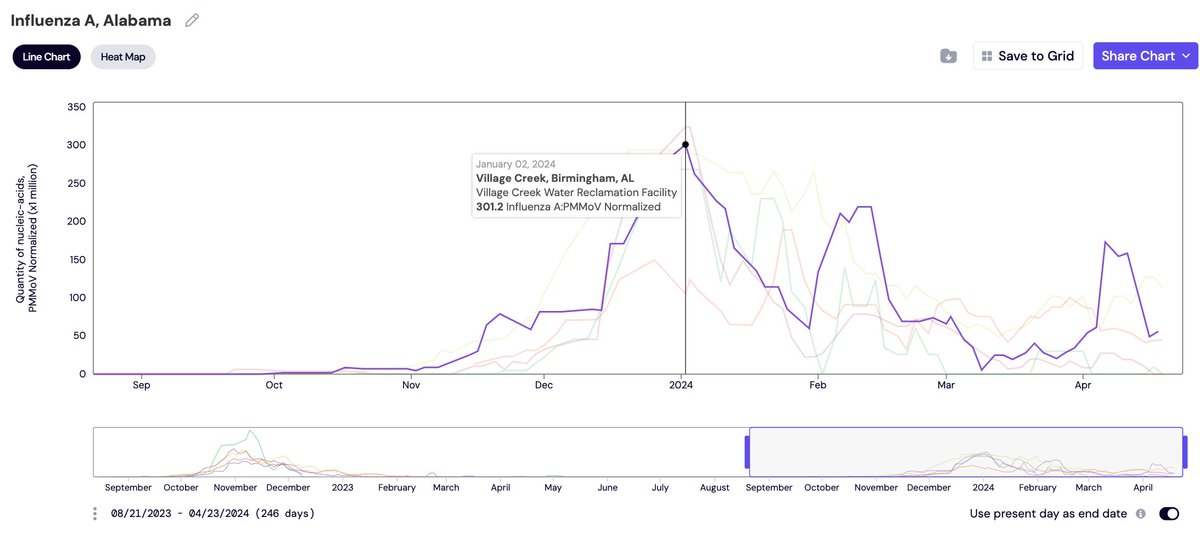
 medrxiv.org/content/10.110…
Apr 24, 2024 • 18 tweets • 5 min read
Some thoughts regarding #H5A1 signals we understand are being closely monitored and researched
"Global Initiative on Sharing All Influenza Data"
@RickABright
Alabama, Village Creek
Late April Flu A
1/16
California, Esparto
Early March Flu A
2/16
Apr 24, 2024 • 12 tweets • 4 min read
Some thoughts on today's FDA announcement of H5N1 in commercial milk
FDA determined milk was safe due to 1) the pasteurization process
-does this cover all forms of pastrurization?
2) the diversion or destruction of milk from sick cows
-where is milk diverted to?
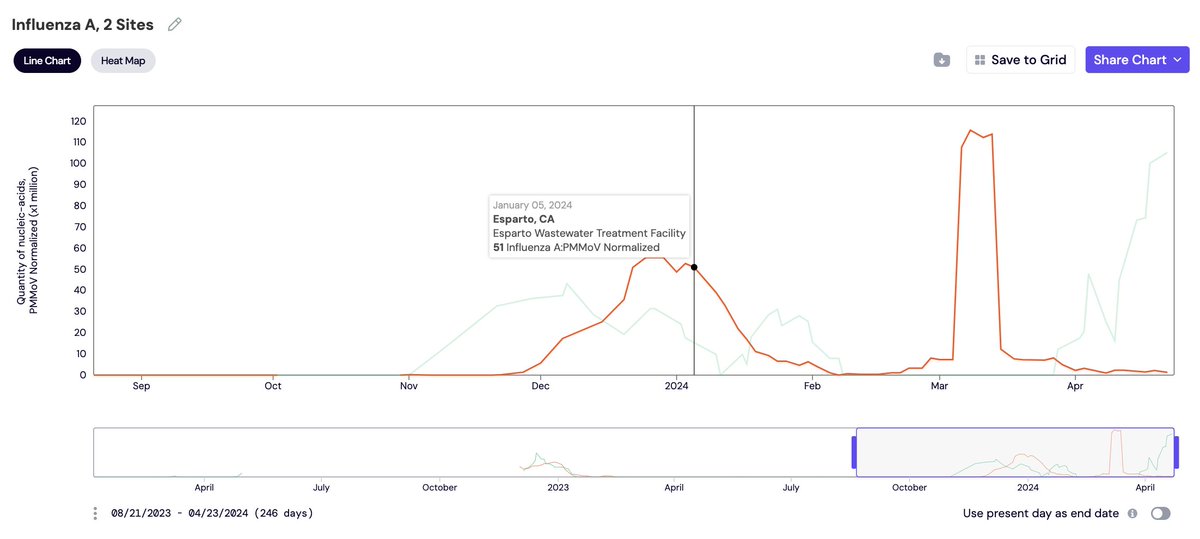
@US_FDA is working with @CDCgov to monitor Emergency department data for iLi.
-have you reviewed Amarillo? (see next slide)
Mar 29, 2024 • 30 tweets • 11 min read
Ethical Skeptic's 35 rules to rule them all.
a.k.a. why Ethical Skeptic doesn't like Beaudoin's or Ben's charts.
The Liar's Method of Pandemic Analytics: 1. Use annualized figures.
—We analyze and deliver
both annualized as well as monthly
Monthly all-cause, age 30-39 below. 
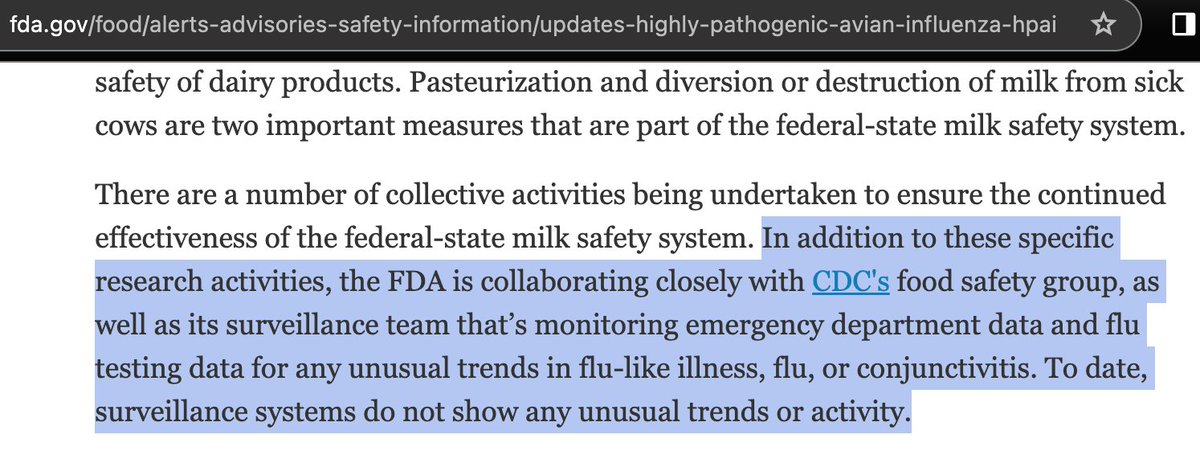
2. Lengthen the retrospective horizon to a decade or more.
—We analyze and deliver monthly 2018-2024 and annual or monthly 1999-2024
Annual 1999-2023 below