
Dad. Husband. Business Owner. Pro European. Centre Right. Commited Realist.
Unbiased talk about the state of UK Water 🌊 and Energy ⚡plus politics.
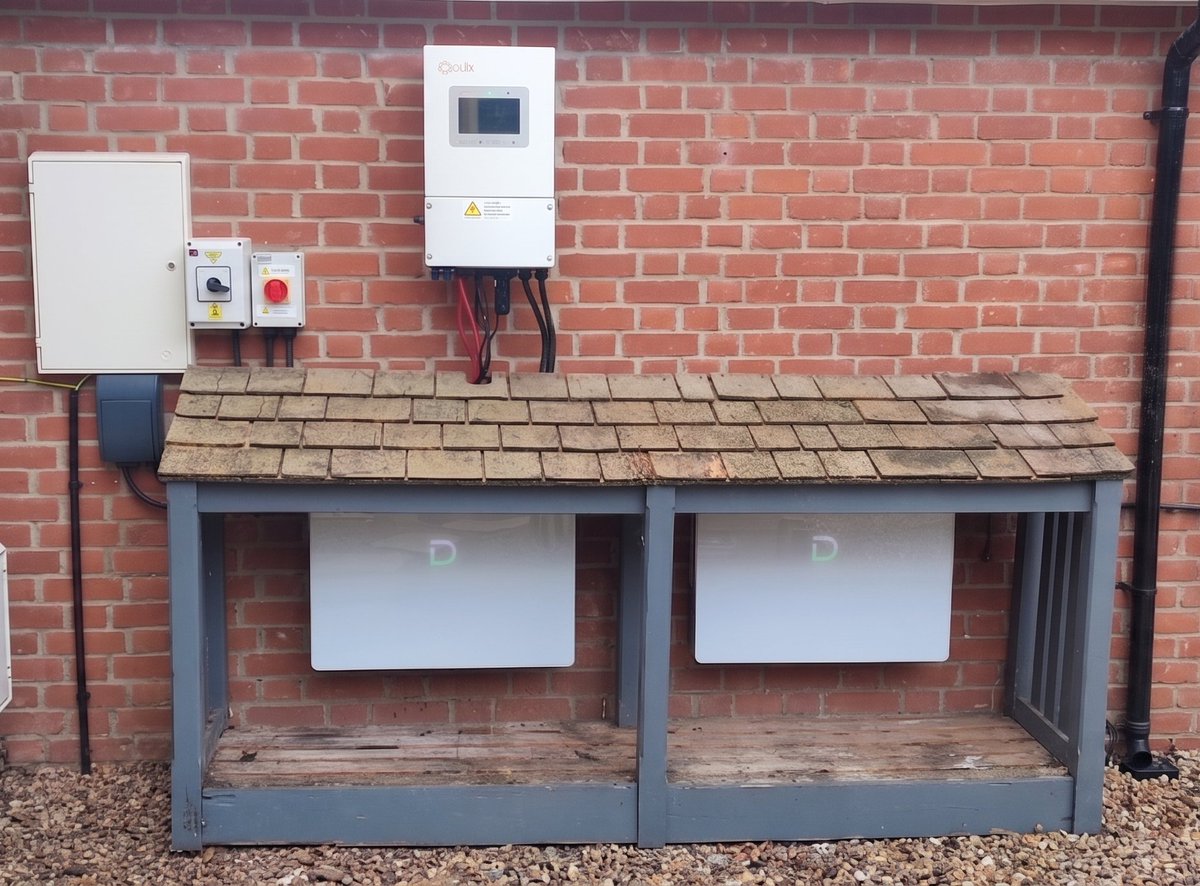 This does not mean all batteries are great and offer the same kind of economic payback.
 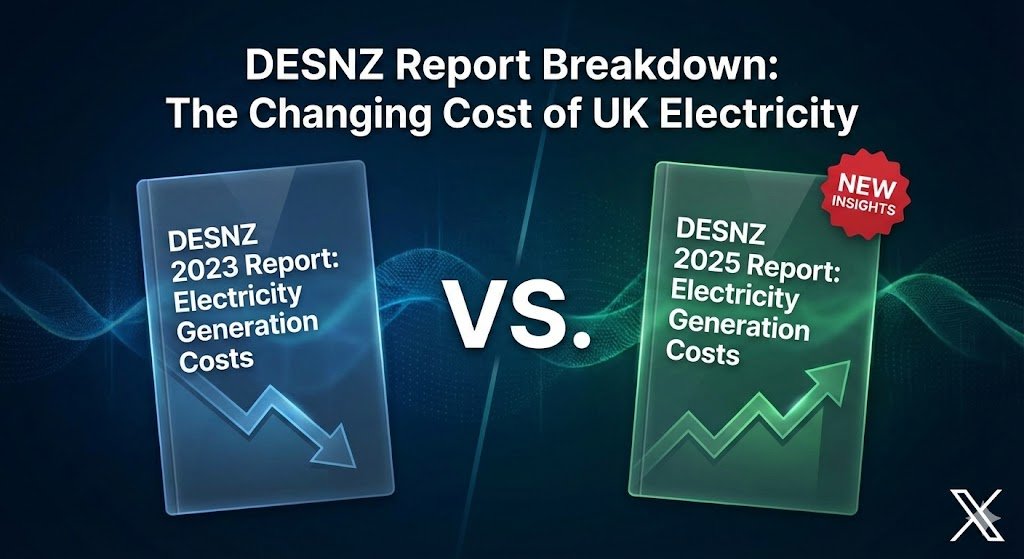 The EGC 2023 report has been widely used by MPs and advocates to show that wind and solar are the only way forward and offer massive future savings.
 1️⃣Levelised Cost of Electricity is the average lifetime cost per unit from a power source.
 1️⃣ We are constantly being fed the same lies.
 1⃣ The EU carbon market (EU-ETS) already commands prices of €80-90 per tonne of CO2 - significantly higher than the UK's current system (which was £31 in Jan). Alignment means adopting these higher carbon costs, immediately driving up electricity prices across Britain.
 Had we stayed in line with 1980, the state pension age should now be 73 years old.
 1️⃣ The commons document makes the following points,
 1⃣ You could be forgiven for thinking that the following points are facts as they are repeated often enough.
  Then in the 2nd map from 1920 to 1946 there were no "Jewish Settlements" it was just British Mandatory Palestine. Some Jewish people lived there, some ethnic Syrians, some Jordanians, some Lebanese, some Egyptians and some native Bedouin tribes.
 2⃣Firstly, there is no Palestine. The name did not exist until Roman occupation when after the defeats of the Jews they renamed Judea as Paleastina. When the Ottoman empire ruled it the whole area was Ottoman Syria.
 For the "It's the school holidays people"

 1⃣ For over 20 years water has been devolved. In this thread we're going to take a look at a number of available metrics to rank & compare each nation.
 @BrknMan @aDissentient @7Kiwi MW not GW, it's late.
