Biostatistician • Assistant Prof @WakeForest • Postdoc @jhubiostat • PhD @vandy_biostat • SoMe Associate Editor @AmjEpi 🎙 @casualinfer • @WomeninStat
3 subscribers
 There’s a bit of a twist, though! It turns out if you’re doing *deterministic* imputation you should NOT include the outcome in the imputation model, with stochastic imputation methods you must!
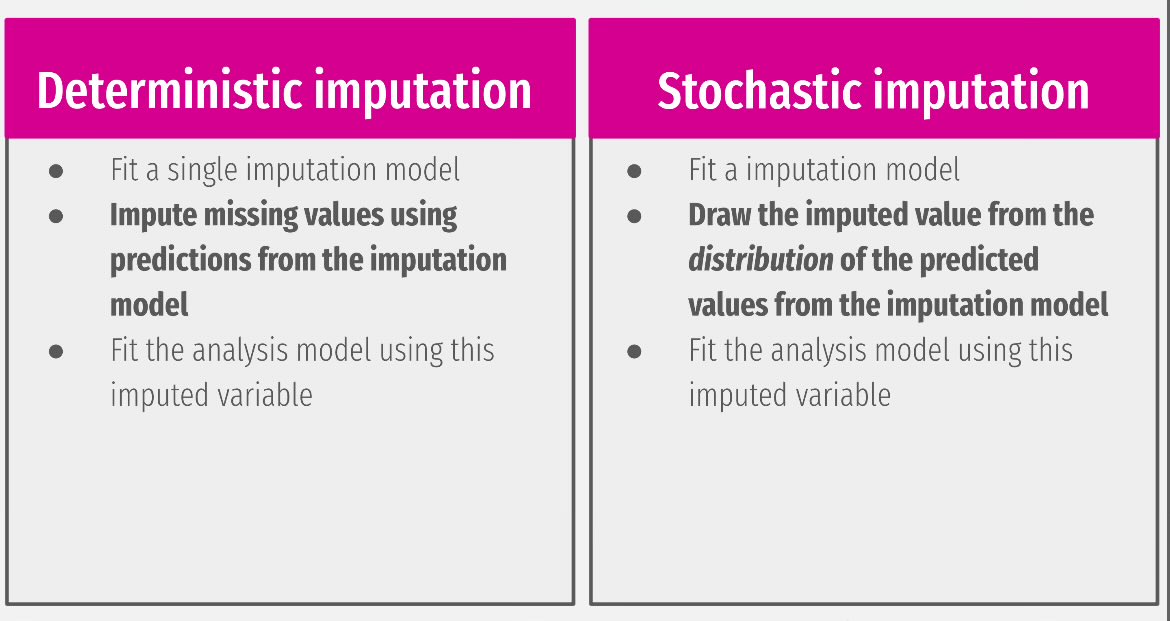
 📦 We simulated a "Causal Quartet" (in the spirit of Ansombe's Quartet & others!) to demonstrate this phenomenon that you (or your students!) can play with in the {quartets} #rstats package
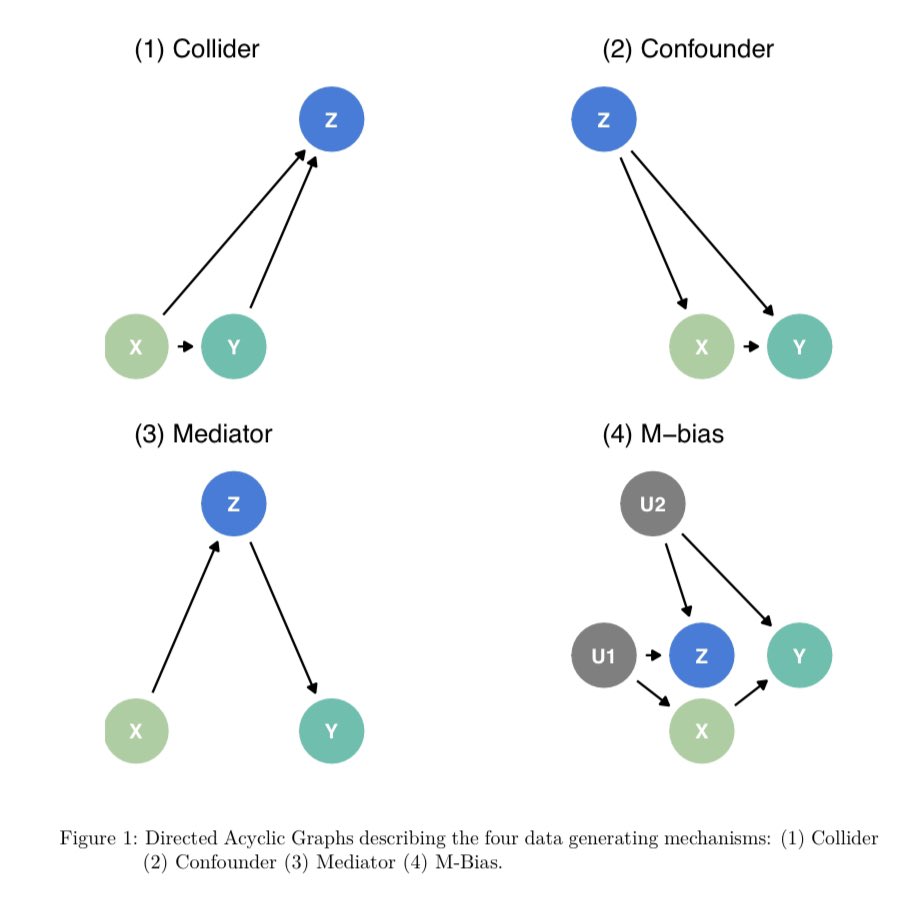
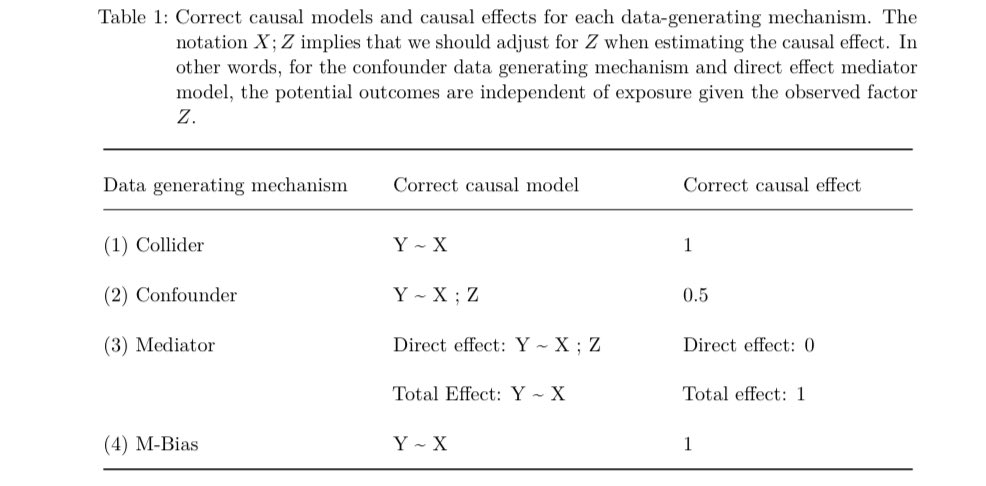
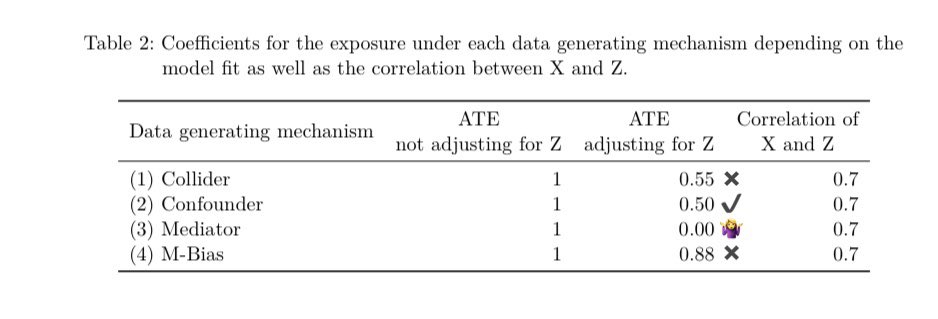
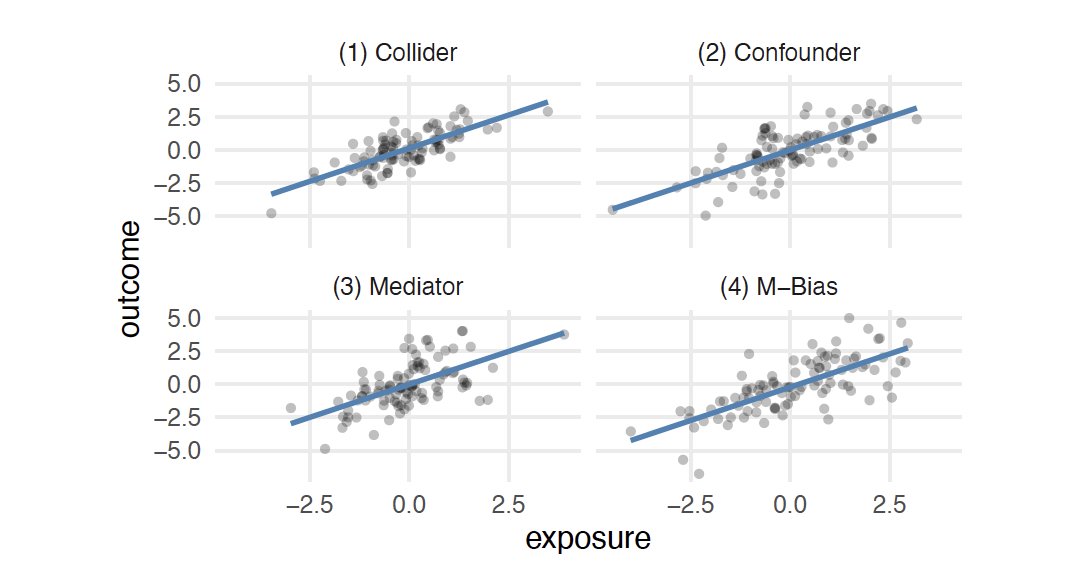
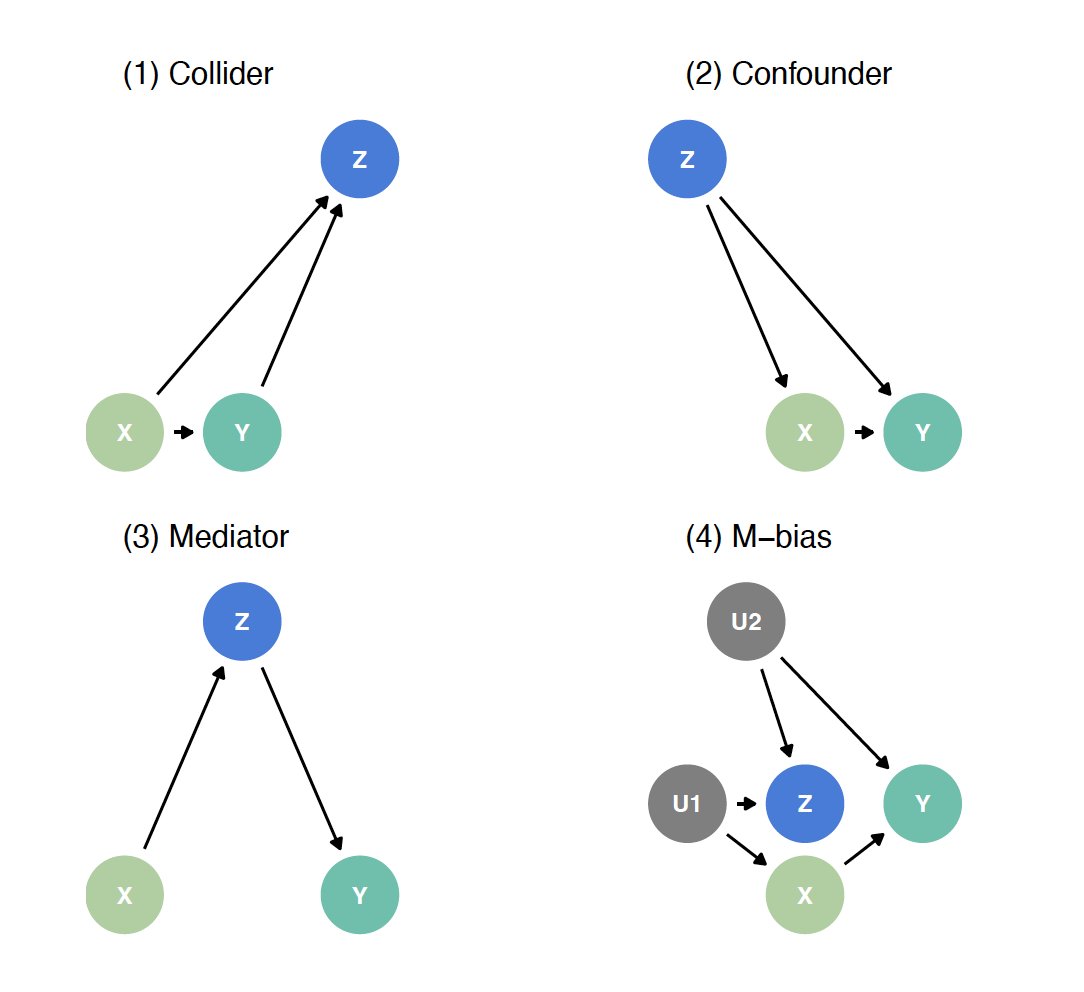
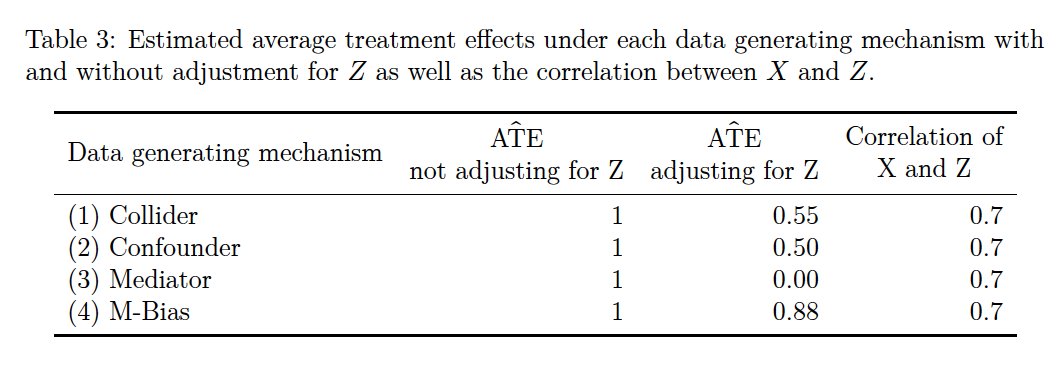
 Given a single dataset with 3 variables: exposure, outcome and covariate (z) how can statistics help you decide whether to adjust for z? It can’t! The correlation between z and the exposure in all 4 datasets is 0.7!