 There are nearly infinite combinations of technical indicators to create complex strategies.
 It identifies two main trade scenarios:
 RSI Multi-Length:
 1: Weekly Stacked Daily Changes
 Monday
 Range Average Retest Model:
 ICT Killzones Toolkit:
 Half Cup:
 SuperTrend AI:
 Squeeze Index:
 Support and Resistance Levels with Breaks:
 Reversal Signals:
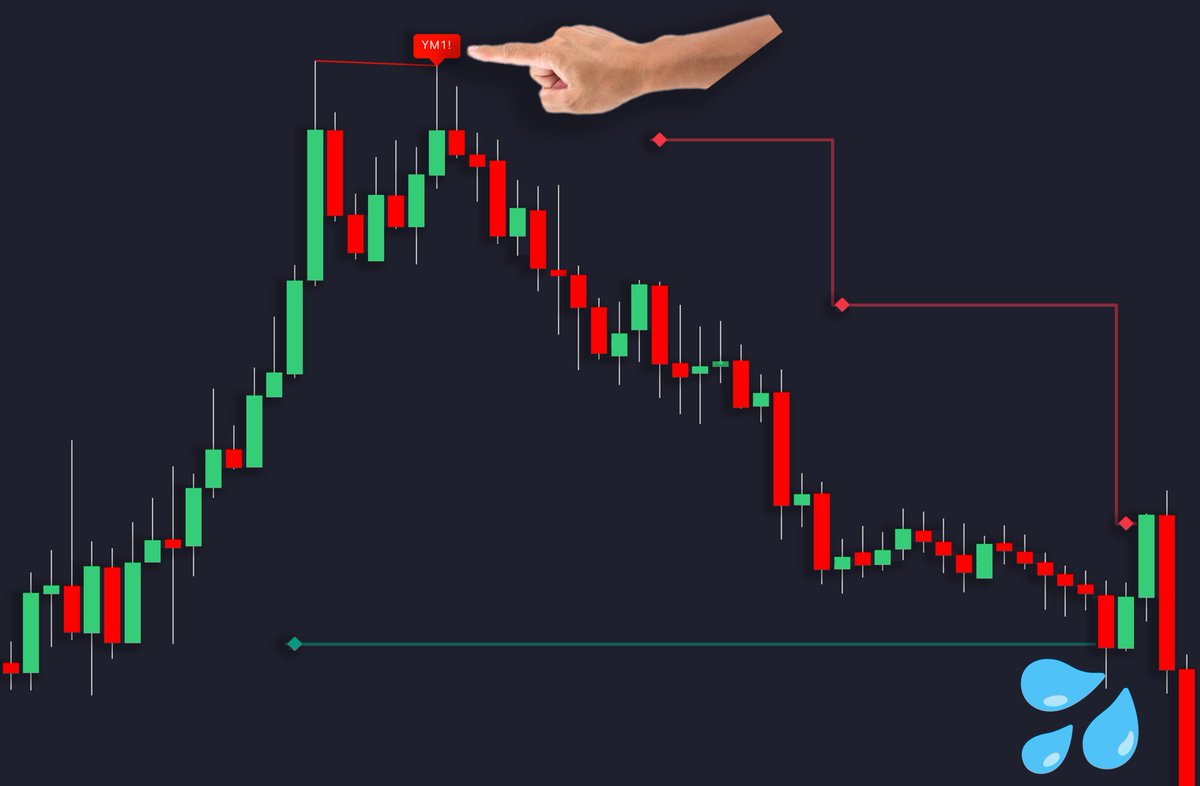
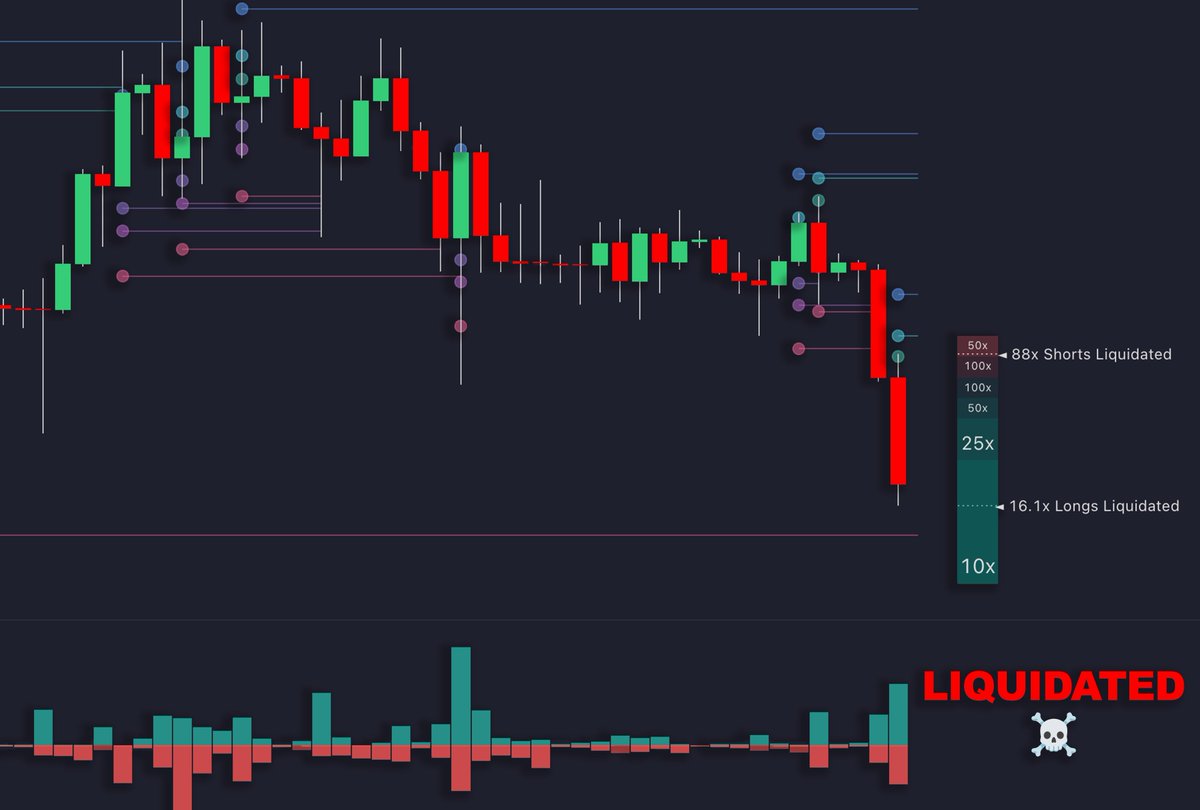 Liquidation Levels:
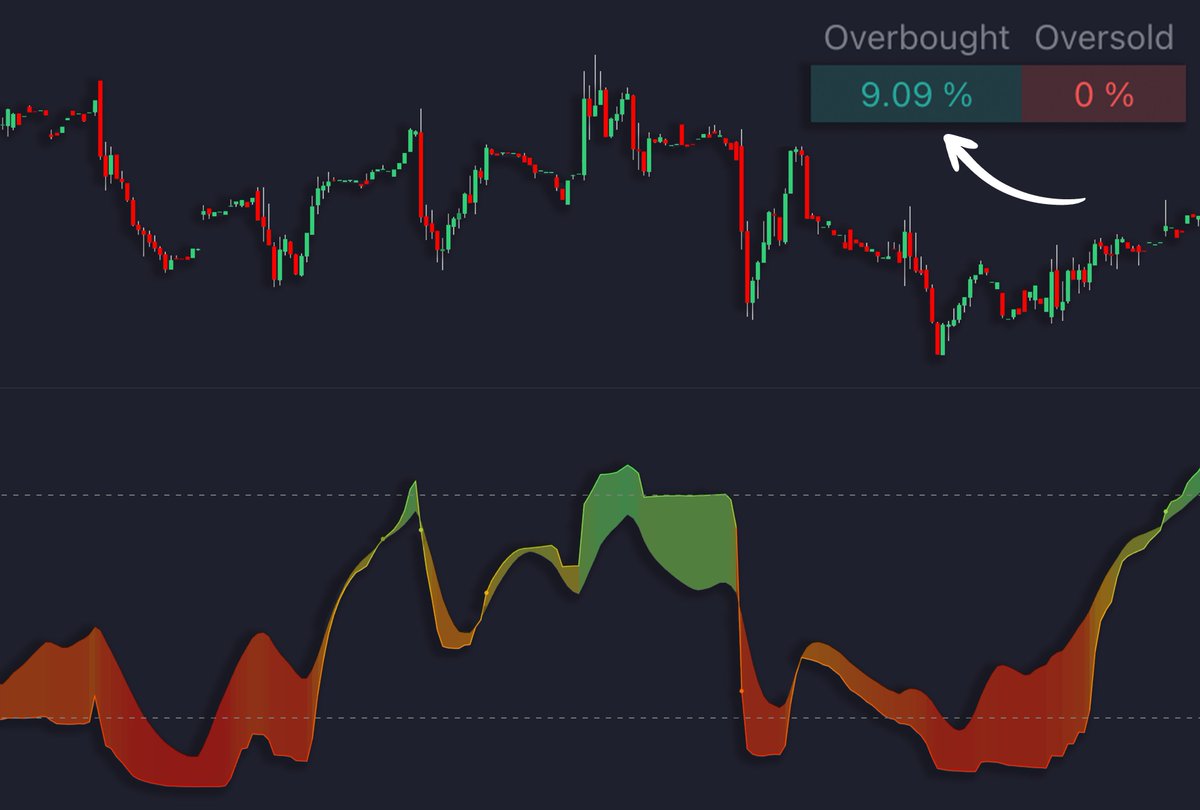 Rainbow Adaptive RSI:
 Reversal Candlestick Structure:
 The indicator detects two types of setups:
 FVG Channel:
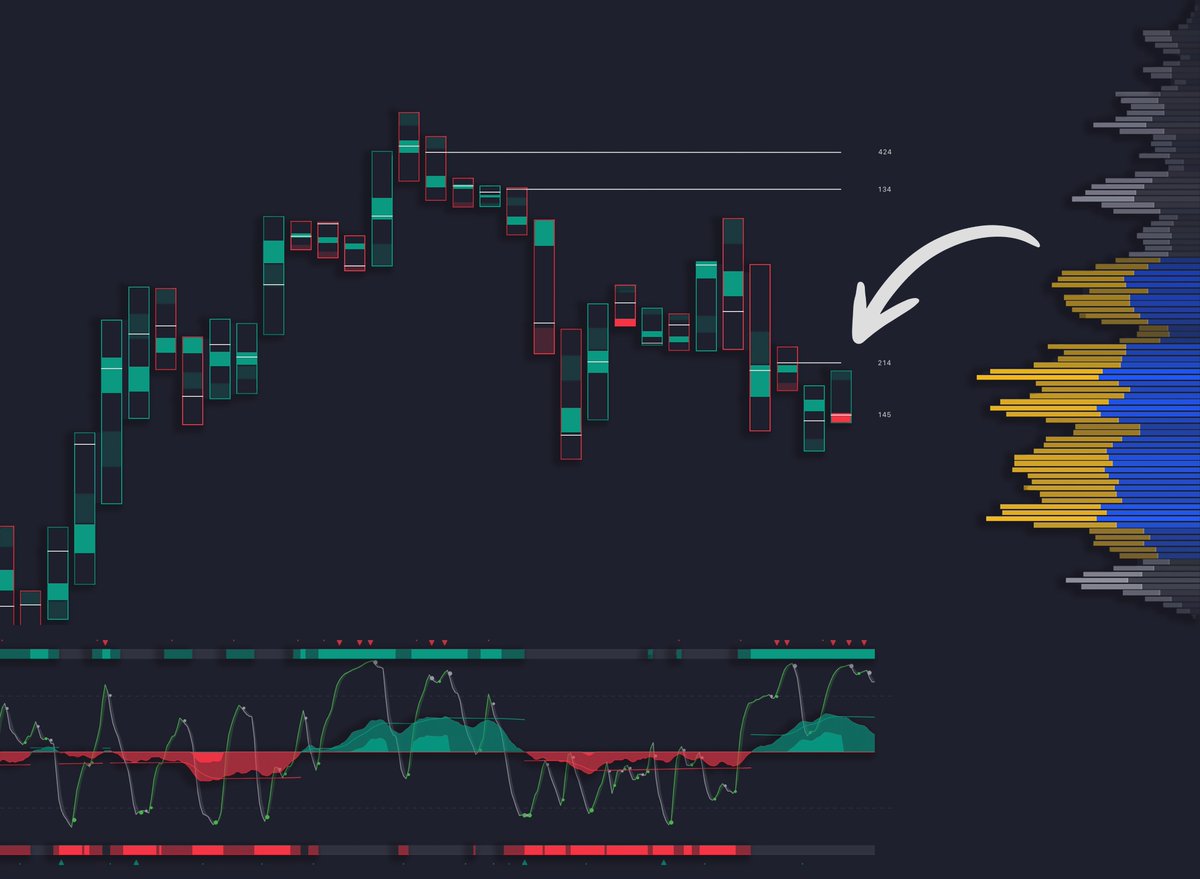 Volume Zones Internal Visualizer:
 Machine Learning Moving Average:
 Predictive Ranges:
