Mashford Mahute Profile picture
Geospatial Consultant | GIS · Remote Sensing · LiDAR · SAR · GEE · WebGIS · AI/ML · Python · R | Architecting Solutions That Move the World
Apr 19 6 tweets 5 min read
21 FREE GOOGLE EARTH ENGINE PYTHON TUTORIALS

🪡🧵 Image 1. Python Flood Detection: youtube.com/watch?v=-2lzKD…

2. Python Vegetation Analysis: youtube.com/watch?v=kVI8Ap…

3. Python Precipitation Patterns: youtube.com/watch?v=UDxwtk…

4. Python Soil Moisture Drought: youtube.com/watch?v=OXZCRD…
Mar 17 4 tweets 3 min read
12 FREE GOOGLE EARTH ENGINE TUTORIALS FOR AGRICULTURE

🪡🧵 Image 1. Phenological Cycle: youtube.com/watch?v=kVI8Ap…

2. Growing Season Length: youtube.com/watch?v=mUXWhh…

3. Crop Irrigation Index: youtube.com/watch?v=OAKstK…

4. Crop Type using SAR: youtube.com/watch?v=1dC6Q0…

5. Crop Type using Sentinel: youtube.com/watch?v=am-5y0…
Mar 14 17 tweets 3 min read
𝗛𝗼𝘄 𝗜 𝗖𝗿𝗲𝗮𝘁𝗲𝗱 𝗧𝗵𝗶𝘀 𝗟𝗮𝗻𝗱 𝗖𝗼𝘃𝗲𝗿 𝗠𝗮𝗽 (𝗦𝘁𝗲𝗽-𝗯𝘆-𝗦𝘁𝗲𝗽 𝗶𝗻 𝗤𝗚𝗜𝗦)

Here is the workflow to produce this 𝗟𝗮𝗻𝗱 𝗖𝗼𝘃𝗲𝗿 𝗠𝗮𝗽 𝗼𝗳 𝗕𝗲𝗻𝗶𝗻 using 𝗘𝗦𝗥𝗜 𝗦𝗲𝗻𝘁𝗶𝗻𝗲𝗹‐𝟮 𝟭𝟬𝗺 𝗟𝗮𝗻𝗱 𝗖𝗼𝘃𝗲𝗿 & elevation data from 𝗨𝗦𝗚𝗦.

🪡🧵 Image 
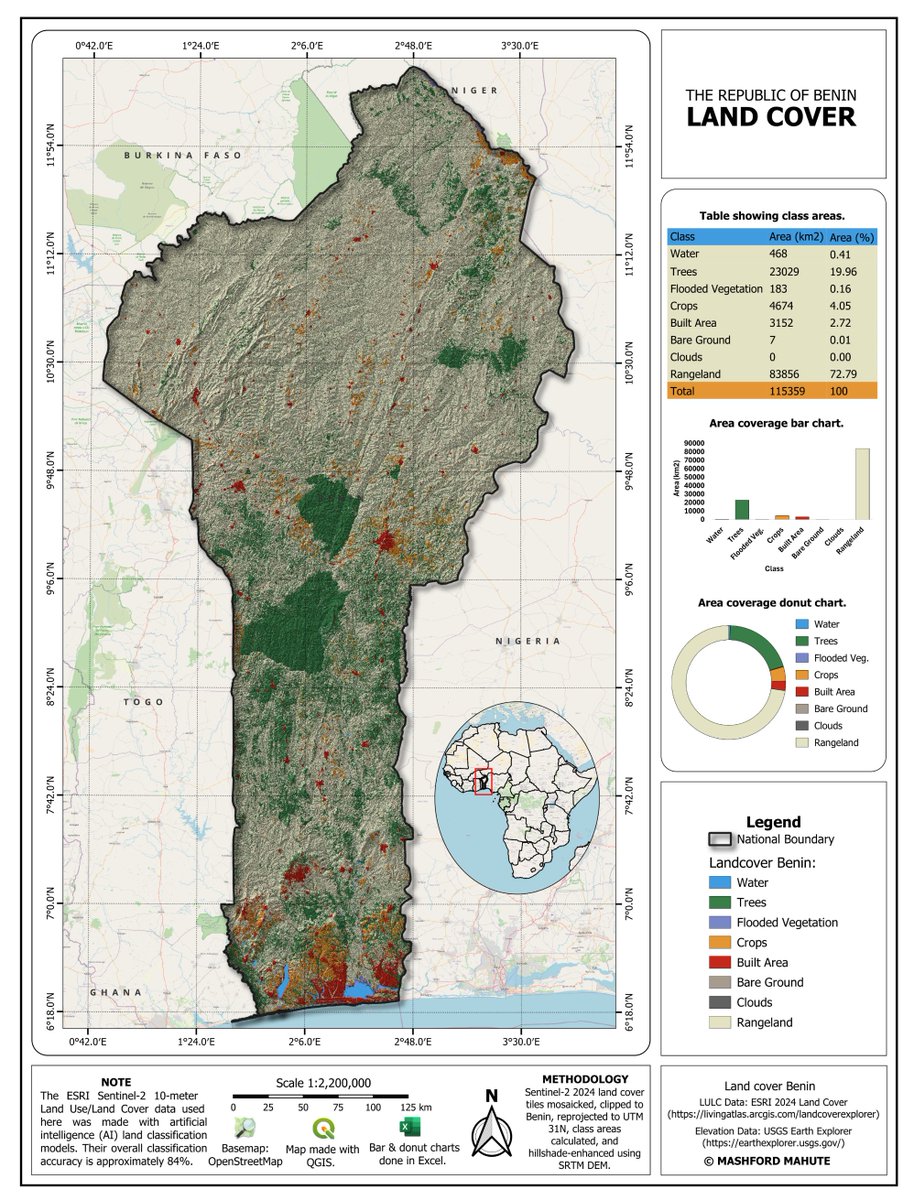
𝟭. 𝗗𝗼𝘄𝗻𝗹𝗼𝗮𝗱 𝘁𝗵𝗲 𝗗𝗮𝘁𝗮

𝗟𝗮𝗻𝗱 𝗖𝗼𝘃𝗲𝗿 𝗗𝗮𝘁𝗮

Download the 𝟮𝟬𝟮𝟰 𝗘𝗦𝗥𝗜 𝗦𝗲𝗻𝘁𝗶𝗻𝗲𝗹-𝟮 𝟭𝟬𝗺 𝗟𝗮𝗻𝗱 𝗖𝗼𝘃𝗲𝗿 𝗱𝗮𝘁𝗮𝘀𝗲𝘁 from:

ArcGIS Living Atlas:

𝗘𝗹𝗲𝘃𝗮𝘁𝗶𝗼𝗻 𝗗𝗮𝘁𝗮: 👇livingatlas.arcgis.com/landcoverexplo…
Jul 30, 2025 6 tweets 1 min read
1. Spatial Resolutions: ASTER, Landsat, Sentinel & UAVs

In EO, spatial resolution determines the size of the smallest object that can be detected by a sensor. Choosing the right dataset often depends on the balance between resolution, cost & coverage. Here's a quick comparison: Image 
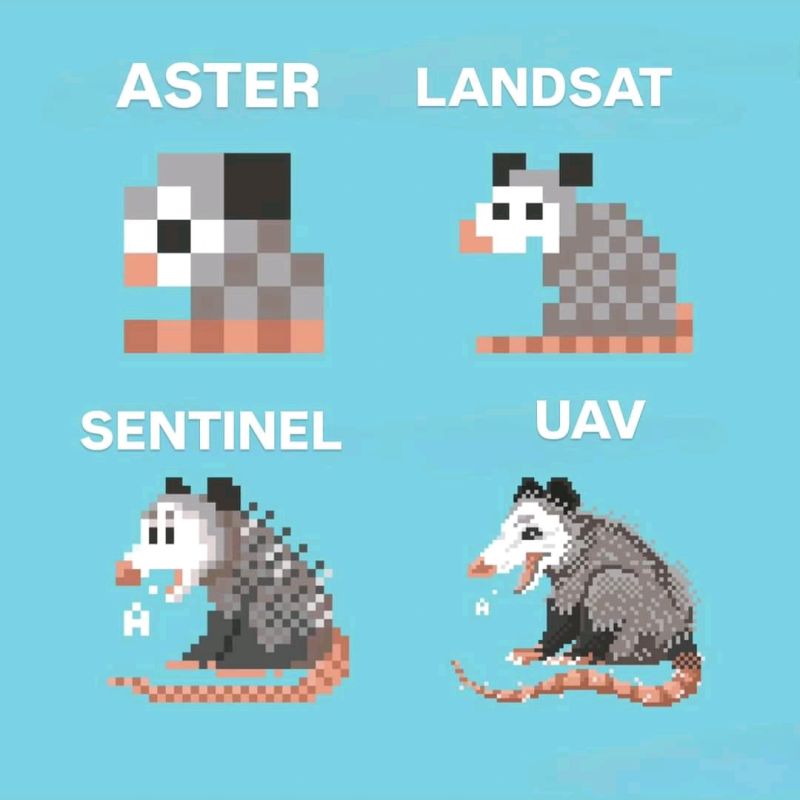
2. ASTER (Advanced Spaceborne Thermal Emission and Reflection Radiometer)

➡️ VNIR: 15 m
➡️ SWIR: 30 m
➡️ TIR: 90 m

Landsat (e.g., Landsat 8/9)

➡️ Multispectral: 30 m
➡️ Panchromatic: 15 m
➡️ Thermal: 100 m (resampled to 30 m)
May 11, 2025 5 tweets 4 min read
13 FREE GOOGLE EARTH ENGINE TUTORIALS FOR BEGINNERS

🪡🧵 Image 1. Get Started with GEE: youtube.com/watch?si=cgwzk…

2. Introduction to Code Editor: youtube.com/watch?v=8rTZS3…

3. Basic JavaScript Data Types: youtube.com/watch?v=W6u1rB…

4. JavaScript Data Types: youtube.com/watch?v=Nd0Ne7…

5. Client Side versus Server Side: youtube.com/watch?v=hsL3hb…
Apr 25, 2025 9 tweets 5 min read
18 FREE GEOAI TUTORIALS

🪡🧵 Image 1. Introducing the GeoAI Python Package: youtube.com/watch?v=teqyY8…

2. Downloading NAIP Imagery and Building Footprint Data for Deep Learning: youtube.com/watch?v=5qfZe_…

3. Viewing Metadata and Raster Clipping: youtube.com/watch?v=GohxJQ…
Apr 22, 2025 10 tweets 8 min read
29 FREE GIS PROGRAMMING TUTORIALS

🧵 Image 1. Introduction to GIS Programming: youtube.com/watch?v=qpxP18…

2. Install Miniconda, VS Code, & Git: youtube.com/watch?v=yM8q9Y…

3. Intro to Conda, Mamba, VS Code, & Git: youtube.com/watch?v=HOSAfy…

4.  Intro to Colab, Python Variables, Data Types: youtube.com/watch?v=33j0cd…
Apr 4, 2025 10 tweets 5 min read
18 FREE RASTER DATA SOURCES

🧵 Image 1. USGS Earth Explorer - Landsat, Sentinel, ASTER, MODIS, and other remote sensing imagery.
earthexplorer.usgs.gov

2. Copernicus Open Access Hub - Sentinel-1, Sentinel-2, Sentinel-3, and other Copernicus datasets.
dataspace.copernicus.eu
Mar 27, 2025 8 tweets 2 min read
HOW TO MAKE A MAP LIKE THIS ONE IN QGIS:

1. Download the SRTM 1 Arc-Second Global data for your region of interest from the USGS Earth Explorer website ().

2. Build a virtual raster in QGIS if you have several tiles. lnkd.in/dhfrySmjImage 3. Clip the virtual raster by your region's boundary. At this point, we have a basic elevation map.

4. Style your elevation map in symbology to show the different elevation ranges.