David Perlmutter Profile picture
Author: 8th Wonder Investment - A Stock Market Compendium Available on Amazon. https://t.co/vbywxAN34e Nothing I ever say or post is financial advice. Ever.
Jan 3 6 tweets 6 min read
1/5
The Brookfield ecosystem is anything but simple. At its core, it consists of a series of businesses which are connected in different ways. They feed off of each other and are each bolstered by their relationships within the system. Let’s break down the way money flows within the system, particularly between Brookfield Asset Management Ltd $BAM, Brookfield Wealth Solutions Ltd $BNT, and Brookfield Corporation $BN. 🧵👇Image 2/5
Brookfield Asset Management Ltd $BAM earns its money by managing capital from institutional investors, private wealth, and insurance float. BAM deploys the capital into long-term private funds of high quality assets in infrastructure, renewable energy, real estate, private equity, and credit.

Where their money comes from:
BAM raises capital organically from institutions who want to invest with them. The amount of money that BAM manages is called fee-bearing capital because BAM charges management fees as a percentage of this money. The more fee-bearing capital is committed, the more fee-related earnings (FRE) BAM makes.

They also take in fee-bearing capital from Brookfield Wealth Solutions (BWS), the insurance business. The insurance float, which is just premiums paid to them from insurance customers, is trusted to BAM for investing, adding to BAM’s committed pool of capital and, hence, its FRE.

Flywheel element:
As BWS grows its insurance/annuities business, BAM grows in turn.

Finally, BAM makes “realized carried interest” when their investment funds clear hurdles for their investors. This is basically a performance fee for reaching a return goal.

Where their money goes:
Almost all of the FRE translates directly to Distributable Earnings (DE). This is like free cash flow in the Brookfield universe. BAM takes the DE and pays almost all of it out as a dividend to shareholders. Brookfield Corporation $BN is its biggest shareholder (72% of total shares), so they get most of the dividends.

Flywheel element:
As BAM grows FRE, $BN’s earning power grows in turn.

BAM also pays a 33% royalty on all realized carried interest (performance fee from surpassing return goals) to $BN. It retains the rest for redeployment.

Flywheel element:
As BAM’s AUM and fund sizes grow, realized carried interest grows, which in turn grows $BN’s royalties earnings/DE.Image
Image
Dec 22, 2025 10 tweets 8 min read
1/10
$GE Aerospace was officially spun-off in April 2024 as the last part of a massive corporate restructuring. The ticker GE gives the investor a pureplay position in the aerospace engines business.

Chris Hohn of TCI Fund keeps $GE as a whopping 27.12% of his portfolio. When you are managing other people’s money, keeping an allocation like that makes quite a statement. This is especially true given Hohn’s investing style, where he only chooses businesses that have multiple competitive advantages (multiple moats, not just one or two), and those which he is quite certain will be around 30 years from now. At 27.12% of his portfolio, Hohn’s certainty about this business is seemingly off the charts. Let’s see why. 🧵👇Image 2/10
$GE Aerospace operates in a duopoly, its counterpart being Pratt & Whitney. Lack of competition means that the business has plenty of room for continued growth and margin expansion. 3 out of 4 commercial flights are powered by GE’s engines.

The business model is quite simple. GE designs and sells jet engines for some of the biggest planes in the world (Airbus A320neo, Boeing 737 MAX, Boeing 777, and for defense/military fighters like the F-15, F/A-18, etc., bombers, and transport aircraft.) Once these engines are out in the world, GE has a lock on the high margin, recurring maintenance and services contracts needed for keeping them operational. Customers must use GE because these are some of the most advanced engines in the world, with proprietary technologies permeating the systems and GE being the only one equipped to properly manage their own technologies.Image
Image
Oct 13, 2025 7 tweets 3 min read
Focus on what’s important and tune out the rest. These 5 charts tell the real story of $AMZN 👇🧵 Image Over the past 2 decades, $AMZN has grown revenue at a 25% CAGR.
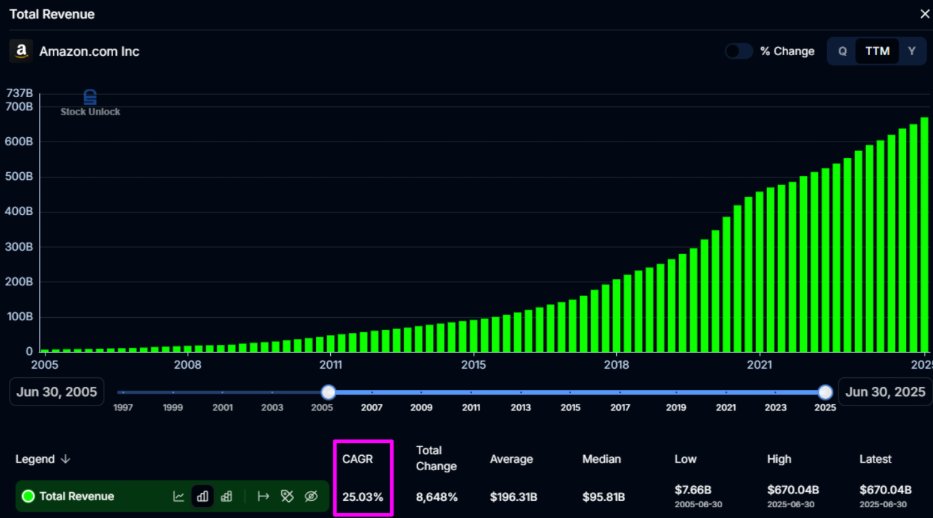
 Image
Oct 7, 2025 5 tweets 4 min read
[1/5]

$MELI A Peak into the Current Valuation 🧵
(Not financial advice)

Mercado Libre’s cash flows are key to understanding what the stock is worth. Specifically, it is important to try and wrap our heads around what the business could produce in cash right now if it suddenly decided that there was no higher priority than cash generation. We want to understand the underlying business’s true current ability to generate cash.

However, an assessment of the business’s potential cash flow generation is not exactly straight-forward. Mostly, it is complicated by the workings of its fintech arm, Mercado Pago, and capital investments into all facets of the overall business. Luckily, Mercado Libre outlined a succinct explanation of cash flows in the last quarterly earnings presentation which we can use to good effect. If we can go through the cash flows and look line-by-line through the lens of arriving at true potential cash flows, we can value the business. So, let's do exactly that. The image below outlines our logic for each line item.

Note: In the scenario where MELI is not expanding its loan book/credit portfolio, there is likely a portion of Restricted customer funds and regulatory requirements that would not be subtracted from Cash from Operations. Some of this value is likely customer balances, and some of it is likely regulatory reserves tied to the expanding loan portfolio. Ideally, we would refrain from subtracting out any portion of regulatory reserves that would have been tied to Loans receivable since this scenario sees no Loans receivable expansion. However, we can’t know the amounts here so we can’t change it. Just realize that the potential FCF number we come up with would likely be a bit higher for the quarter.Image [2/5]

What did $MELI's business have the ability to generate this quarter if expansions were put on hold?

✅$2,917M operating cash flow
✅- $1,451M restricted funds
❌- $1,621M loans receivable
❌+$805M fintech funding
❌- $287M capex
✅+ $91M reconciliation adjustments
= $1,557M potential FCF for the quarter

Annualize the value:
$1,557 X 4 = $6,228M forward (potential) FCF

Currently there are 50.7M diluted shares outstanding
$6,228M / 50.7M = $122.84 FCF per share

The current $MELI share price at the time of writing is $2,148.75

$2,148.75 / $122.84 FCF per share = a forward (potential) P/FCF of 17.49

But is this cheap or expensive?

On the surface, this appears very cheap. The reason is that over the last 2 years, $MELI has grown its Cash from operations by a 36.59% CAGR. If we zoom out further, the CAGR increases. Mimicking a PEG ratio by substituting in FCF and FCF growth, the ratio looks to be < 0.5, implying extreme undervaluation.Image
Aug 26, 2025 15 tweets 11 min read
$KSPI, Kaspi.kz AO, is a monopolistic, flywheel-driven e-commerce marketplace and fintech ecosystem in Kazakhstan that just keeps delivering results year after year after year, a true compounder. The stock is not without risks, but I think the risks are vastly outweighed by potential upside. I don’t hear anyone talking about this one. 👇🧵Image The Kaspi.kz app has become an indispensable tool for daily life in Kazakhstan, integrating a vast array of financial, e-commerce, and government services into a single, user-friendly platform. Its ecosystem is built on three core business segments: Payments, Marketplace, and Fintech, which together offer a seamless and comprehensive user experience. As of the second quarter of 2025, the Kaspi.kz Super App has 14.2 million monthly active users in Kazakhstan. With the total population of the country being 20 million, this represents 71% of the entire country. That’s how dominant $KSPI is, and this figure continues to grow.

Although there is plenty of growth runway ahead in Kazakhstan for each of Kaspi’s segments, ambitions to grow the ecosystem led them to acquire 65% of Hepsiburada, an e-commerce platform in Turkiye. This effectively added about 400% to Kaspi’s TAM, and it only just happened a few months ago.Image
Jun 21, 2025 8 tweets 4 min read
$AMZN is one of the greatest businesses on Earth. Surely, with a big wide moat, global expansion, and increasing margins, there is a lot to look forward to. But is it undervalued? The usual look into P/OCF doesn't even begin to tell the story. The thread below outlines a different take on the valuation which suggests the stock will casually triple over the next 5 years. 👇🧵
Chart from @stock_unlockImage 
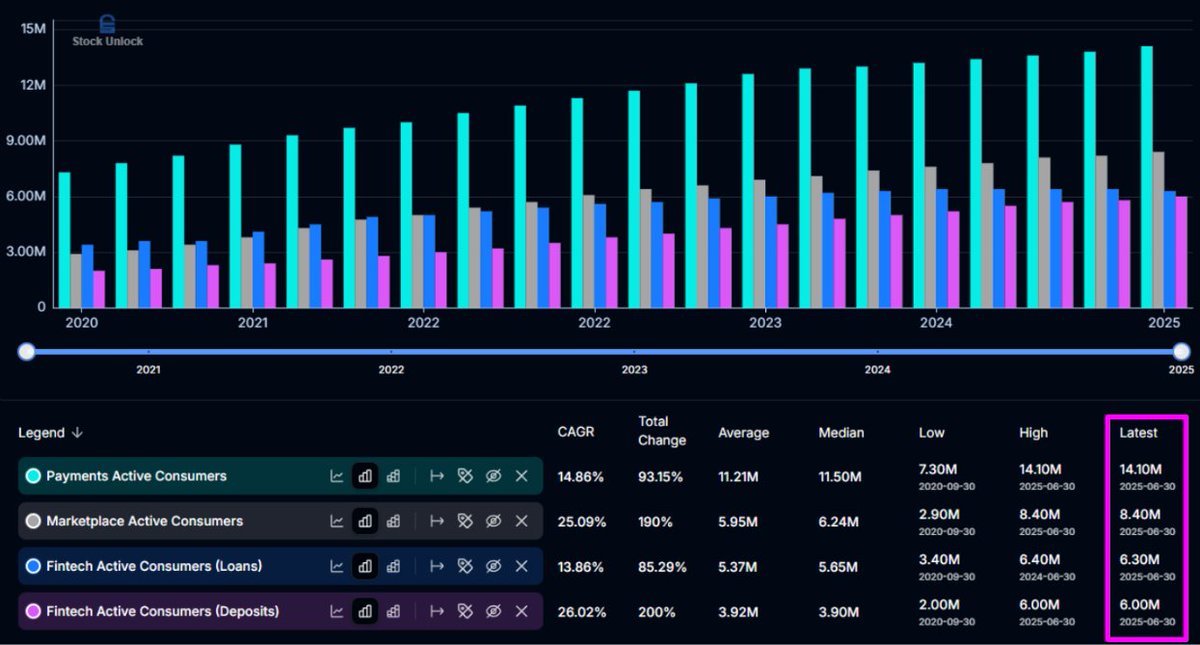
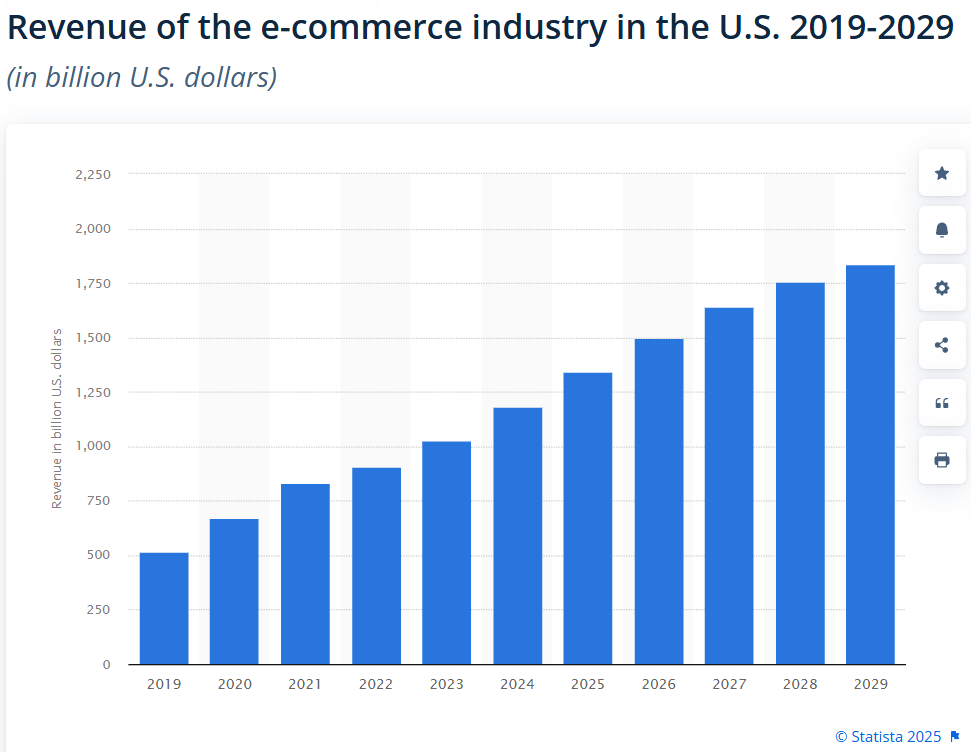
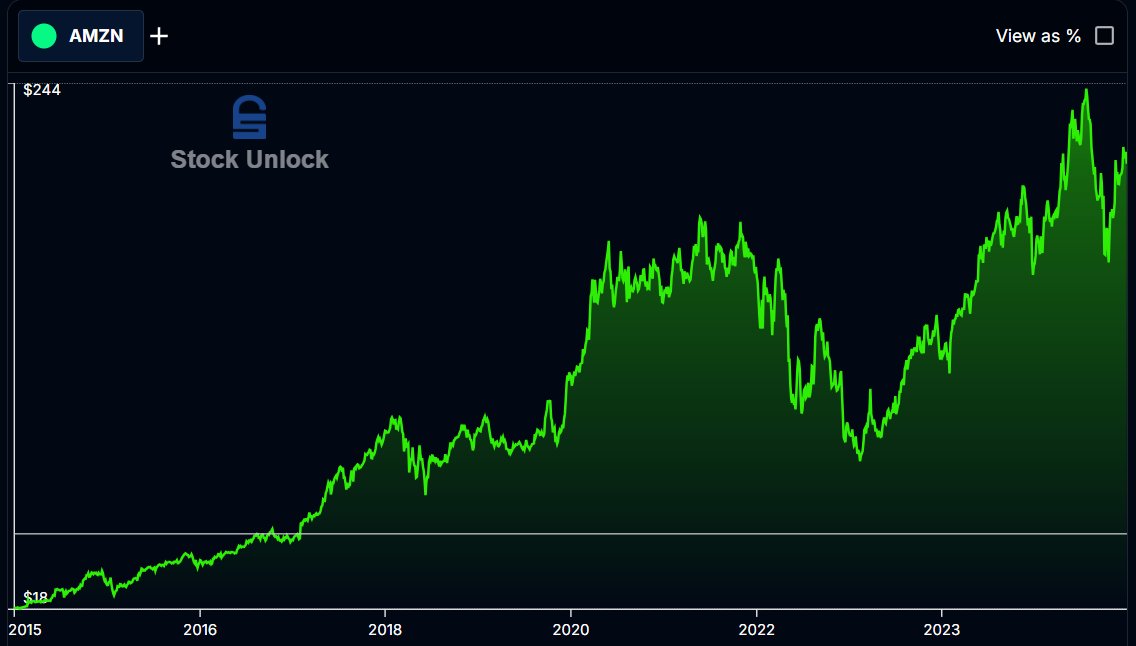
While most analysts are hyper-focused on the extremely impressive AWS business, zooming in on the e-commerce business shows something surprising. Market research suggests that the US e-commerce TAM will expand over the next 5 years to $1.8T. What does this mean for $AMZN?

Source: statista.com/statistics/272…Image