
Official X account for the National Weather Service Salt Lake City Utah. Details: https://t.co/tPnNVW4fva
 Here's one model's representation of how convective activity could play out throughout the day and evening. Given the cloud cover and convective inhibition in place, the delayed start of more significant convection (likely not until 1-2PM) appears appropriate. (2/4)
 2/9 The September 2020 wind storm was a complex meteorological event combining elements of strong synoptic winds associated with deep low pressure system with components of a classic downslope wind event. It was this combination that led to a widespread, long-duration event #utwx
 2/7 Here are the peak wind gusts for the event across northern Utah. Wind gusts as high as 99 mph were reported (with unofficial reports near the U over 100 mph).
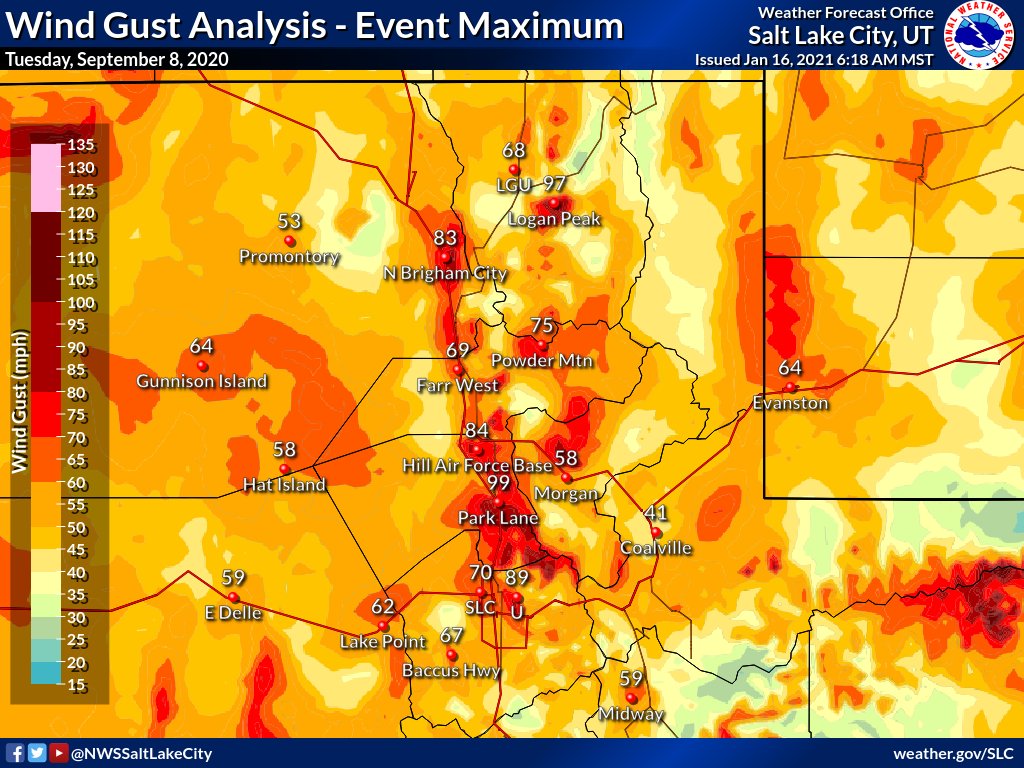
 2/8 This oversimplified graphic shows how the stable layer/temperature inversion creates a cap that traps a shallow layer of pollution near the surface in winter, while under warm and well mixed summer conditions, these pollutants (like smoke) are distributed throughout.