1) Chemical - Tata Chemical 2) Banking - Axis Bank, ICICI Bank 3) FMCG - Tata Consumer, ITC 4) Pharma - Sun Pharma, Marksan Pharma 5) Auto - Bajaj Auto, Tata Motors 6) Petrochemical - Reliance Ind
7) Retail - Avenue Super Mart, Trent 8) Fertilizer And Chemical -- Coromandel, RCF 9) IT -- TCS, HCL Tech 10) Power -- Tata Power, Powergrid 11) PVC Pipes -- Astral, Finolex Ind 12) PSU - IRCTC, REC, IOC, BEL
Aug 6, 2023 • 48 tweets • 7 min read
Golden Rules for Mastering Intra-Day And Positional Trading:
Every Trader Must Follow Strictly :
There is a lot to know when you start trading. This list of tips will help you make sure you get started right away today, plan on the spot, and learn how to manage your risk...
- Create a trading plan :
Before even a single real rupee is put at risk, the trader needs to have a little idea of how they will make a profit. The steps that will be taken to achieve that potential profit are laid out in the trading plan.
Jul 30, 2023 • 27 tweets • 6 min read
Free Technical Analysis Series Part 1 Start Today :
Top 12 Major Strong Reversal Chart 📈Pattern Thread 🧵🧵
Please Maximum Retweet🔁 this thread to reach all the traders' friends.
Thank you.
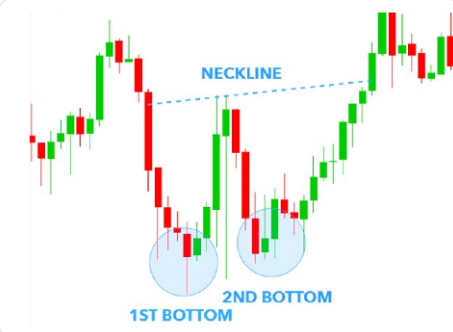
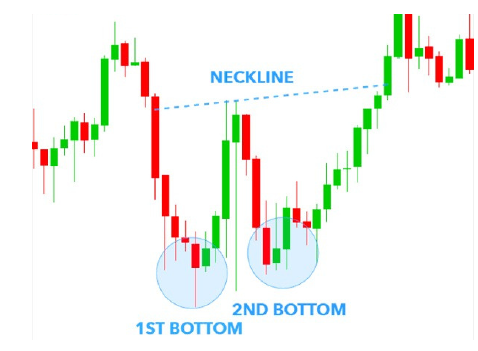
1) Double Bottom (Buy)
The double bottom pattern is a bullish reversal pattern that occurs at the bottom of a downtrend and signals that the sellers, who were in control of the price action so far, are losing momentum...
Sep 10, 2022 • 26 tweets • 6 min read
Major Strong Reversal Chart Pattern Thread 🧵🧵
1) Double Bottom (Buy)
The double bottom pattern is a bullish reversal pattern that occurs at the bottom of a downtrend and signals that the sellers, who were in control of the price action so far, are losing momentum...
The pattern resembles the letter “W” due to the two-touched low and a change in the trend direction from a downtrend to an uptrend.