Paul Mainwood Profile picture
Used to study physics. Now my job title has "strategy" in it.
Peter English #FBPE Profile picture Henry Madison Profile picture 3 subscribed
Feb 28, 2023 7 tweets 2 min read
Mathsy question.
Say you've a disease adding 50% to the all-cause mortality rate.
Your scientists develop a safe vaccine with 95% effectiveness vs death. 90% of people take it. Your national statistics office plots mortality rates like this: unvaccinated ~46% higher mortality.
1/ Image Now, assume you don't like the vaccine and want to show it kills people. But the *only* thing you can touch is the total population number - you can propose an alternative. By what percentage do you have to inflate that number to make the vaccine look dangerous?
2/
Feb 27, 2023 4 tweets 2 min read
Good to see the IEA finally dragging themselves in the direction of reality.
It’d be rational to expect that it will go faster than they project though. It always does.
ft.com/content/beaed1… Some justification for that last point from something I wrote 4 years ago, pointing out that the IEA always underestimate renewables - updated for 2021 and trying to reconcile their historical definitions (no hydro counted in renewables for some reason).
corporateknights.com/perspectives/v…
Feb 22, 2023 5 tweets 2 min read
Beautiful example to reveal the nature of an LLM (a sophisticated statistical model trained on a large corpus of text). An obvious extension:
Feb 21, 2023 4 tweets 2 min read
The ONS have updated the age-adjusted all-cause mortality rates by vaccination status for England to cover all of 2022.
It's nice because it's simple. No diagnosis question, just counting deaths from all causes to give age-adjusted mortality rates for each group. Simple is *not* the same as easy. Main issue is counting unvaccinated people (coverage high, so any uncertainty in population => big uncertainty in unvaccinated number).
ONS solve this by counting deaths in the (~90%) subset of the population where they can link to NHS records.
Feb 21, 2023 5 tweets 2 min read
A first, very rough attempt to extract IFRs from the ONS's incidence and death certificates in England. Unchecked, and a bunch of things are off here; e.g., fixed 28 day lag infections -> deaths, hence the wavy patterns at the end.
~40x reduction in IFRs seems about right though. Interpreting this chart, it helps to remember than IFR = deaths / infections. So, e.g., rolling out a programme with a perfect infection-prevention vaccine would give no change in level. The lines change with a *difference* between protection vs death and protection vs infection.
Feb 9, 2023 4 tweets 2 min read
Confirmed. For January, Category 2s were down to a mean of 32 minutes vs a target of 18.
Category 1s down to a mean of 8 minutes 30 seconds vs a target of 7. The leading indicator of handover times suggests this better picture should be continued into the start of February, though the South West is still having issues.
Jan 16, 2023 4 tweets 1 min read
Haven't looked at vaccines for a while - and was wondering where we were on monovalent vs bivalent in the ongoing booster programme.
In order to make the reported figures work, I think just about all the Autumn boosters must be bivalent - about half Pfizer, half Moderna. Image (Adds some credibility to the thought that perhaps the December wave didn't impact hospitalisations or deaths as much as one would expect from ONS infection numbers, because the majority of the vulnerable population had just been upgraded from monovalent to bivalent protection.)
Jan 12, 2023 4 tweets 2 min read
Don't really know what to say.
Category 2 ambulance calls include those for suspected heart attacks and strokes.
The mean response time in December was 1 hour 32 minutes across England; 2 hours 39 in the South West.
The target is 18 minutes. Even the time to pick up the phone is out of control - the mean is now 1 minute 28 seconds, with one in ten having to wait 3 mins 50 seconds before being connected.
If you don't think this sounds bad, imagine an emergency, hold a phone to your ear and count to 230 VERY slowly.
Dec 20, 2022 5 tweets 2 min read
Some new ONS stats on symptoms of people testing PCR negative allows some dirty Bayesian estimates.

Got a cough? Suspect COVID?
~95% probability it's not.

(~2% COVID prevalence; ~45% with Omicron have a cough. And ~16% of the 98% without COVID report a cough.) Image Most diagnostic single symptom for COVID? That'd be a fever, and it's still really unhelpful.
With a fever, it's 16% likely you have COVID - about 84% likely you don't. Much less diagnostic, you're a child.
Diagnostics is hard, especially in children.
More as we get it. Image
Dec 20, 2022 4 tweets 2 min read
HSJ being sent figures that would spike some days in December 2022 to twice the worst month ever.
Some regions would disappear off the top of the chart. Voices from front line corrorborating.
Very conscious there's strike politics in here too, but my best guess is this is real. Image To be clear:
a) These times are so appalling they will be killing people - back-of-envelope suggests they could be enough to see in excess deaths over the next few weeks.
b) These times are *before* any strike action.
Dec 7, 2022 6 tweets 3 min read
Wytham Abbey: one of the most stunning stately homes in in Britain, situated just outside Oxford.
Past residents include Elizabeth I, Oliver Cromwell, and Joachim von Ribbentrop.
Together with the gardens, estate was on sale for £15m last year.
Three guesses who just bought it? Image Such cynicism in the replies! No, not a bunch of people linked to corruption scandals.
It's the Centre for Effective Altruism. The EA group dedicated to spending money in the most effective way to do good.
In this case, by buying themselves a stately home.
effectivealtruism.org
Dec 5, 2022 4 tweets 1 min read
There's a UK politician or commentator, and you want to know if they want to improve things, or are just an idiotic, self-promoting bullshitter?
One way: get them to talk about the NHS. Any self-promoting bullshitter will - within seconds - start ranting about cutting managers. The NHS is a fabulously complicated organisation.
To manage its £150b budget, around 2% of its workforce are managers, ~5x lower than the general UK economy and the lowest of any major health system worldwide (tricky to get comparable data, but it's clearly incredibly low).
Dec 5, 2022 5 tweets 2 min read
One reason it's taken so long to get attention on ambulance response times is this Parliamentary Library report, and its underplaying of the crisis: from the sarcastic title to its exclusive focus on Category 1 times: ones NHS staff protect at all cost.
lordslibrary.parliament.uk/ambulance-resp… The report's only chart is this one, which shows Cat 1 times: times are just nudging above target (and in the case of 90th percentile, laregly beating it). It then states "Response times for the same period for categories 2 to 4 show a similar trend to the category 1 data." Image
Oct 4, 2022 15 tweets 4 min read
No one:
Absolutely no one:

OK, yes I *will* offer yet another explanation of Bell's inequality and why it's important.

Because Nobel Prize.
(1/) Start with a thought experiment, which we can alter later into real experiments: the ones that won the Nobel.

Thought experiment. You and a friend have an unlimited supply of matched pairs of boxes.
Each box has buttons marked "0" and "1", and a light on top.
That's all.
(2/)
Sep 9, 2022 9 tweets 2 min read
A clear winner (loser?).
A lot of people skeptical that ice cubes melting in water requires a big bang state (or similar) in our past.
Maybe it's more about how I expressed each statement than their inherent surprisingness/implausiblity.
But I guess I should explain that one. Melting ice-cubes are a thermodynamical process, with laws underwritten by some kind of statistical mechanics.
Assumption: the microphysical dynamics that underly ice cube melting are time symmetric (i.e., any time asymmetries deep in the Standard Model don't affect ice melting).
Aug 22, 2022 5 tweets 2 min read
Time-to-answer 999 ambulance calls: time between a connection to the emergency operations centre and the call being answered, 95th percentiles.
Target time to arrive at a Category 1 call is seven minutes.
In London, 1 in 20 people are waiting that long even to speak to someone. Image With all response targets hopelessly missed, there's worrying signs of desperation within the system.
The total number of responses has not changed much. But more are being categorised into the most serious category, from about May 2021.
Two possible reasons for this. Image
Jul 18, 2022 25 tweets 7 min read
So, I honestly thought that these ONS age-standardised mortality rates by vaccination status were so clear, even the most dishonest couldn't find a way to misinterpret them.
I was wrong.
There is a way.
It's not easy though - you have to work at it.
(1/5) Age-standardised Mortality (adjusting death rates for the age of the person) gets rid of major confounders. So rates over time are valid and clear (thread above) and doses over the whole period works too.
Headlines show a true picture, so to mislead, you have to dig deep.
(2/5) Image
Jul 17, 2022 5 tweets 2 min read
Ambulance response times for category two calls (includes 999 calls for suspected heart attack or strokes).
Target: 18 mins.
England average: 51.
Timing of COVID peak suggests a nowcast: Ambulance times right now (July) are likely >1 hour, and the worst since records began. Image 
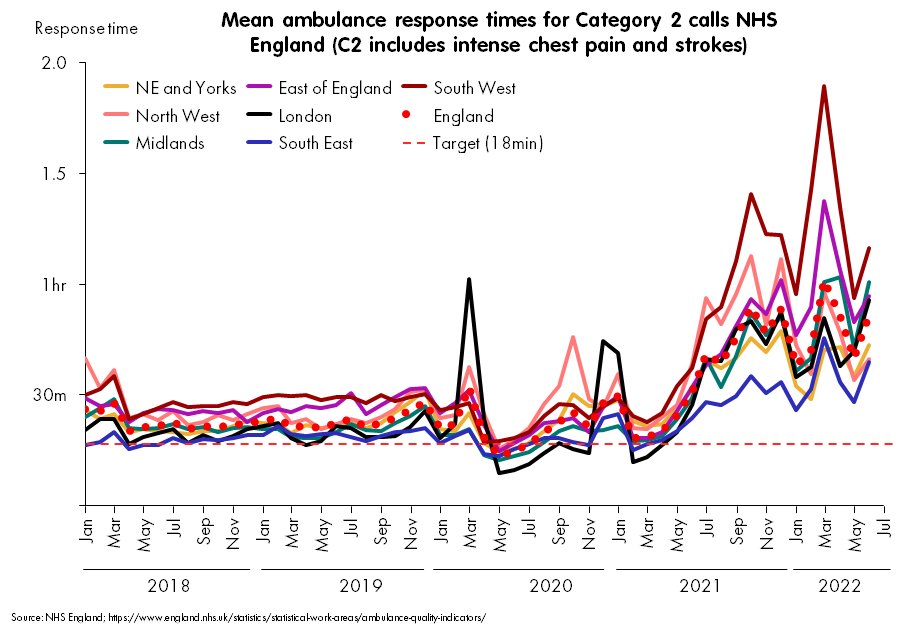
Note these spiralling times are NOT because there are many more calls for heart attacks/strokes.
There aren't - see chart.
The NHS is under huge systemic pressure, and the extra straw of each new COVID peak reliably & predictably sends it spiraling it further into meltdown. Image
May 19, 2022 13 tweets 4 min read
Only two countries have really been hit by BA.4/5 so far: South Africa and Portugal, and are both exceptional in that they escaped a BA.2 wave.
So it might seem odd to say we should expect a BA.4 jolt in the firmly BA.2-ed UK.
Especially as - well - there's no sign of it.
(1/n) Image The reason for expecting one is based entirely on relative growth of sequences in the UK sequencing data.
Very simply: BA.4 (and, to a lesser extent, BA.5) are growing as proportion of sequenced cases, and doing so fast - best-fit line is ~4-day doubling. (2/n) Image