TW - The Wealthy Trader Profile picture
Investor $SPY & options trader ๐Ÿฆ Helping struggling traders become profitable is my mission in life
11 subscribers
Nov 23 โ€ข 8 tweets โ€ข 2 min read
๐‡๐Ž๐– ๐“๐Ž ๐‚๐‡๐€๐๐†๐„ ๐˜๐Ž๐”๐‘ ๐“๐‘๐€๐ƒ๐ˆ๐๐† ๐ˆ๐ ๐Ÿ” ๐Œ๐Ž๐๐“๐‡๐’

Hereโ€™s how to go from losing $100โ€™s and $1,000โ€™s to becoming a profitable trader in 6 months

๐Ÿงต๐Ÿ‘‡

$SPY $SPX $QQQ FOCUSED ON ONE SETUP

- Focus on one setup and master it

- Trading is about being patient and executing

- No setup no trade and stick to that

- My favorites are Breakout to the upside when market is trending up and Breakout to the downside when itโ€™s trending down
Nov 16 โ€ข 12 tweets โ€ข 2 min read
After trading for 11+ years and experiencing $100,000โ€™s of losses and $1,000,000โ€™s worth of profits

Below is what I wish I would have known to make money trading to quit my job ๐Ÿงต
$SPY $QQQ $SPX 1. Risk Management

Full porting and risking most of my account is what I thought would make me the most money. In the end it lost me the most.

Protection of your capital is key in growing your account.

REMEMBER: No trade and No loss is better than trade and a loss.
Oct 19 โ€ข 10 tweets โ€ข 3 min read
I went from losing money day trading to making $1,000โ€™s a day.

What helped me become profitable is understanding ๐‹๐ข๐ช๐ฎ๐ข๐๐ข๐ญ๐ฒ ๐†๐ซ๐š๐›๐ฌ, and ๐๐ซ๐ข๐œ๐ž ๐€๐œ๐ญ๐ข๐จ๐ง to enter and exit trades

Here is the strategy I use on how to find and read them ๐Ÿ‘‡

$SPY $SPX $QQQ $TSLA Image 1. ๐—œ๐——๐—˜๐—ก๐—ง๐—œ๐—™๐—ฌ๐—œ๐—ก๐—š ๐— ๐—”๐—ฅ๐—ž๐—˜๐—ง ๐—ฆ๐—ง๐—ฅ๐—จ๐—–๐—ง๐—จ๐—ฅ๐—˜๐—ฆ/๐—ง๐—ฅ๐—˜๐—ก๐——๐—ฆ

Uptrends - Are identified by Higher highs and higher lows

Downtrends - Are identified by Lower high and Lower lows

Sideways - Is identified by the lows and highs almost if not equal forming a box Image
Oct 3 โ€ข 10 tweets โ€ข 3 min read
๐‡๐จ๐ฐ ๐ญ๐จ ๐ƒ๐ซ๐š๐ฐ ๐’๐ฎ๐ฉ๐ฉ๐ฅ๐ฒ ๐š๐ง๐ ๐ƒ๐ž๐ฆ๐š๐ง๐ ๐™๐จ๐ง๐ž๐ฌ

After 11 years of trading these are the best and easiest methods to draw and trade Supply and Demand zones

๐Ÿ‘‡๐Ÿ‘‡
$SPY $SPX $QQQ $TSLA Image Things To Know First ๐Ÿ’ก

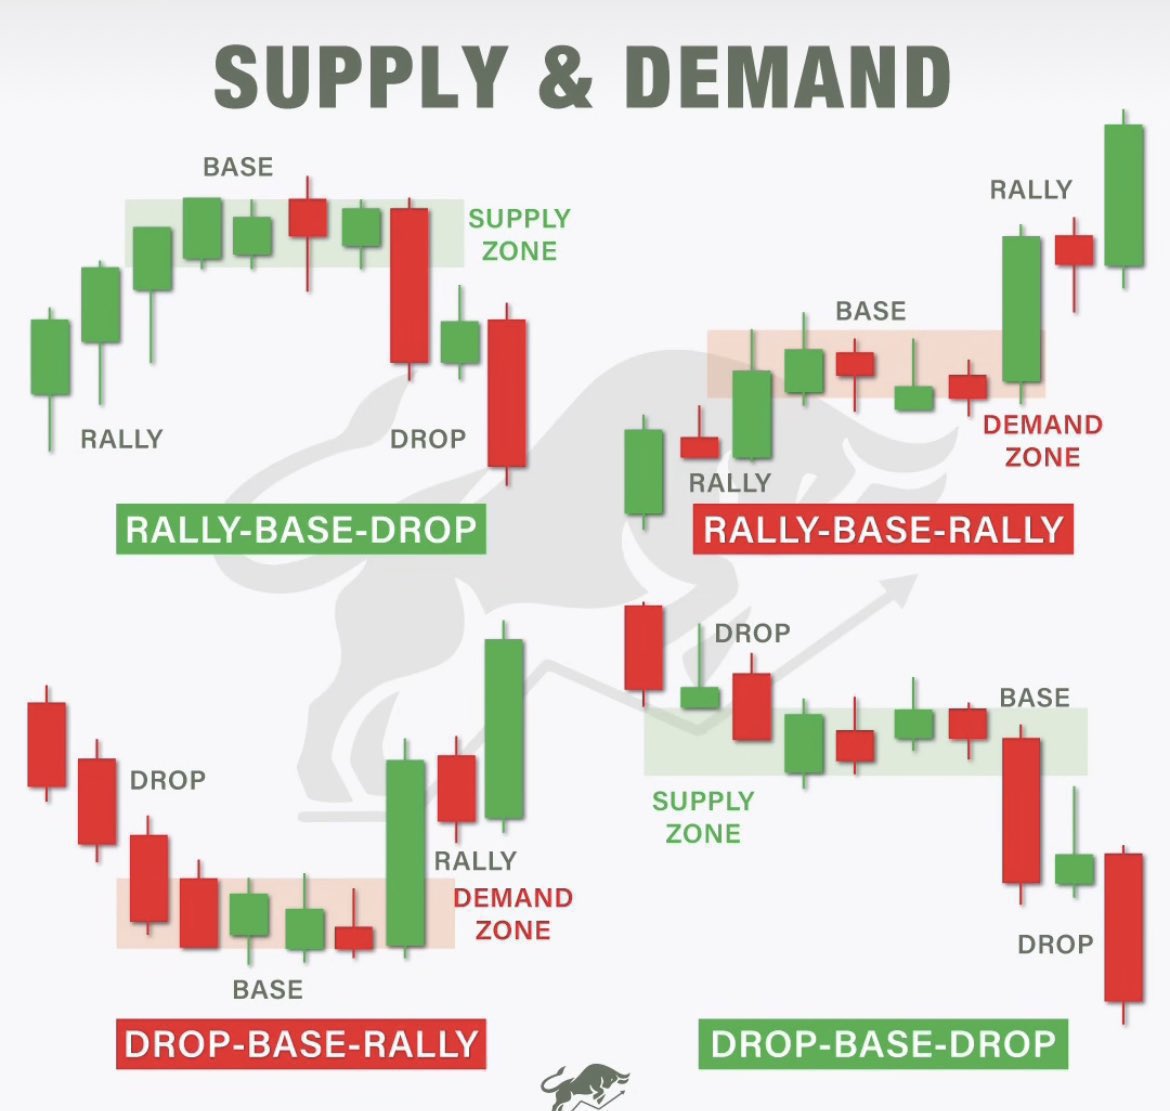
Supply zones are either rally-base-drop or drop-base-drop. You can draw it with the three methods described below ๐Ÿ‘‡
Sep 21 โ€ข 10 tweets โ€ข 3 min read
I went from losing money day trading to making $1,000โ€™s a day.

What helped me become profitable is understanding ๐‹๐ข๐ช๐ฎ๐ข๐๐ข๐ญ๐ฒ ๐†๐ซ๐š๐›๐ฌ, and ๐๐ซ๐ข๐œ๐ž ๐€๐œ๐ญ๐ข๐จ๐ง to enter and exit trades

Here is the strategy I use on how to find and read them ๐Ÿ‘‡

$SPY $SPX $QQQ $TSLA Image 1. ๐—œ๐——๐—˜๐—ก๐—ง๐—œ๐—™๐—ฌ๐—œ๐—ก๐—š ๐— ๐—”๐—ฅ๐—ž๐—˜๐—ง ๐—ฆ๐—ง๐—ฅ๐—จ๐—–๐—ง๐—จ๐—ฅ๐—˜๐—ฆ/๐—ง๐—ฅ๐—˜๐—ก๐——๐—ฆ

Uptrends - Are identified by Higher highs and higher lows

Downtrends - Are identified by Lower high and Lower lows

Sideways - Is identified by the lows and highs almost if not equal forming a box Image
Sep 14 โ€ข 22 tweets โ€ข 5 min read
Trading in the Zone by Mark Douglas

Summarized in 20 quotes so you donโ€™t have to read it ๐Ÿงต

$SPY $SPX $QQQ $VIX Image $SPY $SPX $QQQ $VIX Image
Sep 12 โ€ข 9 tweets โ€ข 3 min read
Supply and Demand zones have taken my $100 days to $1,000 days

๐“๐ก๐ž๐ฌ๐ž ๐š๐ซ๐ž ๐ญ๐ก๐ž ๐ฆ๐š๐ข๐ง ๐ญ๐ฒ๐ฉ๐ž๐ฌ ๐š๐ง๐ ๐ญ๐ก๐ž ๐ž๐š๐ฌ๐ข๐ž๐ฌ๐ญ ๐ฐ๐š๐ฒ๐ฌ ๐ญ๐จ ๐Ÿ๐ข๐ง๐ ๐ญ๐ก๐ž๐ฆ ๐Ÿงต

$SPY $SPX $QQQ $TSLA Image It's important to know the patterns involved in supply and demand zones.

Like traditional price pattern analysis, supply and demand zones also have reversal and continuations patterns.
Aug 31 โ€ข 12 tweets โ€ข 2 min read
After trading for 11+ years and experiencing $100,000โ€™s of losses and $1,000,000โ€™s worth of profits

Below is what I wish I would have known. ๐Ÿงต
$SPY $QQQ $SPX 1. Risk Management

Full porting and risking most of my account is what I thought would make me the most money. In the end it lost me the most.

Protection of your capital is key in growing your account.

REMEMBER: No trade and No loss is better than trade and a loss.
Aug 24 โ€ข 10 tweets โ€ข 3 min read
I went from losing money day trading to making $1,000โ€™s a day.

What helped me become profitable is understanding ๐‹๐ข๐ช๐ฎ๐ข๐๐ข๐ญ๐ฒ ๐†๐ซ๐š๐›๐ฌ, and ๐๐ซ๐ข๐œ๐ž ๐€๐œ๐ญ๐ข๐จ๐ง to enter and exit trades

Here is the strategy I use on how to find and read them ๐Ÿ‘‡

$SPY $SPX $QQQ $TSLA Image 1. ๐—œ๐——๐—˜๐—ก๐—ง๐—œ๐—™๐—ฌ๐—œ๐—ก๐—š ๐— ๐—”๐—ฅ๐—ž๐—˜๐—ง ๐—ฆ๐—ง๐—ฅ๐—จ๐—–๐—ง๐—จ๐—ฅ๐—˜๐—ฆ/๐—ง๐—ฅ๐—˜๐—ก๐——๐—ฆ

Uptrends - Are identified by Higher highs and higher lows

Downtrends - Are identified by Lower high and Lower lows

Sideways - Is identified by the lows and highs almost if not equal forming a box Image
Aug 17 โ€ข 10 tweets โ€ข 3 min read
How to Draw Supply and Demand Zones

After 11 years of trading these are the best and easiest methods to draw and trade Supply and Demand zones

๐Ÿ‘‡๐Ÿ‘‡
$SPY $SPX $QQQ $IWM $TSLA Image Things To Know First ๐Ÿ’ก

Supply zones are either rally-base-drop or drop-base-drop. You can draw it with the three methods described below ๐Ÿ‘‡
Aug 14 โ€ข 11 tweets โ€ข 4 min read
How to Identify Supply and Demand Zones on the Chart

After 11 years of trading these are the best and easiest methods to Identify Supply and Demand Zones ๐Ÿงต

$SPY $SPX $QQQ Image Things To Know ๐Ÿ’ก

Identifying market imbalances is the first step to finding supply and demand zones. In simple words, market imbalances refer to big price shifts in one direction (either upward or downward) based on fluctuating supply and demand.
Aug 10 โ€ข 22 tweets โ€ข 5 min read
Trading in the Zone by Mark Douglas

Summarized in 20 quotes so you donโ€™t have to read it ๐Ÿงต

$SPY $SPX $QQQ $VIX Image $SPY $SPX $QQQ $VIX Image
Aug 3 โ€ข 12 tweets โ€ข 2 min read
After trading for 11+ years and experiencing $100,000โ€™s of losses and $1,000,000โ€™s worth of profits

Below is what I wish I would have known. ๐Ÿงต
$SPY $QQQ $SPX 1. Risk Management

Full porting and risking most of my account is what I thought would make me the most money. In the end it lost me the most.

Protection of your capital is key in growing your account.

REMEMBER: No trade and No loss is better than trade and a loss.
Jul 27 โ€ข 10 tweets โ€ข 3 min read
I went from losing money day trading to making $1,000โ€™s a day.

What helped me become profitable is understanding ๐‹๐ข๐ช๐ฎ๐ข๐๐ข๐ญ๐ฒ ๐†๐ซ๐š๐›๐ฌ, and ๐๐ซ๐ข๐œ๐ž ๐€๐œ๐ญ๐ข๐จ๐ง to enter and exit trades

Here is how to find and read them ๐Ÿ‘‡

$SPY $SPX $TSLA Image 1. ๐—œ๐——๐—˜๐—ก๐—ง๐—œ๐—™๐—ฌ๐—œ๐—ก๐—š ๐— ๐—”๐—ฅ๐—ž๐—˜๐—ง ๐—ฆ๐—ง๐—ฅ๐—จ๐—–๐—ง๐—จ๐—ฅ๐—˜๐—ฆ/๐—ง๐—ฅ๐—˜๐—ก๐——๐—ฆ

Uptrends - Are identified by Higher highs and higher lows

Downtrends - Are identified by Lower high and Lower lows

Sideways - Is identified by the lows and highs almost if not equal forming a box Image
Jul 16 โ€ข 10 tweets โ€ข 3 min read
How to Identify Supply and Demand Zones on the Chart

After 11 years of trading these are the best and easiest methods to Identify and trade Supply and Demand Zones ๐Ÿงต

$SPY $SPX $QQQ $TSLA Image Things To Know ๐Ÿ’ก

Identifying market imbalances is the first step to finding supply and demand zones. In simple words, market imbalances refer to big price shifts in one direction (either upward or downward) based on fluctuating supply and demand.
Jul 13 โ€ข 12 tweets โ€ข 2 min read
After trading for 11+ years and experiencing $100,000โ€™s of losses and $1,000,000โ€™s worth of profits

Below is what I wish I would had known to grow a SMALL ACCOUNT

This method gave me my first $100,000 year trading ๐Ÿงต
$SPY $QQQ $SPX $VIX 1. Risk Management

Full porting and risking most of my account is what I thought would make me the most money. In the end it lost me the most.

Protection of your capital is key in growing your account.

REMEMBER: No trade and No loss is better than trade and a loss.
Jul 6 โ€ข 10 tweets โ€ข 3 min read
I went from losing money day trading to making $1,000โ€™s a day.

What helped me become profitable is understanding ๐‹๐ข๐ช๐ฎ๐ข๐๐ข๐ญ๐ฒ ๐†๐ซ๐š๐›๐ฌ, and ๐๐ซ๐ข๐œ๐ž ๐€๐œ๐ญ๐ข๐จ๐ง to enter and exit trades

Here is how to find and read them ๐Ÿ‘‡

$SPY $SPX $META $TSLA Image 1. ๐—œ๐——๐—˜๐—ก๐—ง๐—œ๐—™๐—ฌ๐—œ๐—ก๐—š ๐— ๐—”๐—ฅ๐—ž๐—˜๐—ง ๐—ฆ๐—ง๐—ฅ๐—จ๐—–๐—ง๐—จ๐—ฅ๐—˜๐—ฆ/๐—ง๐—ฅ๐—˜๐—ก๐——๐—ฆ

Uptrends - Are identified by Higher highs and higher lows

Downtrends - Are identified by Lower high and Lower lows

Sideways - Is identified by the lows and highs almost if not equal forming a box Image
Jun 29 โ€ข 22 tweets โ€ข 5 min read
Trading in the Zone by Mark Douglas

Summarized in 20 quotes so you donโ€™t have to read it ๐Ÿงต

$SPY $SPX $QQQ $NVDA Image $SPY $SPX $QQQ $NVDA Image
Jun 22 โ€ข 12 tweets โ€ข 2 min read
After trading for 11+ years and experiencing $100,000โ€™s of losses and $1,000,000โ€™s worth of profits

Below is what I wish I would had known to grow a SMALL ACCOUNT

This method gave me my first $100,000 year trading ๐Ÿงต
$SPY $QQQ $SPX $VIX 1. Risk Management

Full porting and risking most of my account is what I thought would make me the most money. In the end it lost me the most.

Protection of your capital is key in growing your account.

REMEMBER: No trade and No loss is better than trade and a loss.
Jun 15 โ€ข 10 tweets โ€ข 3 min read
I went from losing money day trading to making $1,000โ€™s a day.

What helped me become profitable is understanding ๐‹๐ข๐ช๐ฎ๐ข๐๐ข๐ญ๐ฒ ๐†๐ซ๐š๐›๐ฌ, and ๐๐ซ๐ข๐œ๐ž ๐€๐œ๐ญ๐ข๐จ๐ง to enter and exit trades

Here is how to find and read them ๐Ÿ‘‡

$SPY $SPX Image 1. ๐—œ๐——๐—˜๐—ก๐—ง๐—œ๐—™๐—ฌ๐—œ๐—ก๐—š ๐— ๐—”๐—ฅ๐—ž๐—˜๐—ง ๐—ฆ๐—ง๐—ฅ๐—จ๐—–๐—ง๐—จ๐—ฅ๐—˜๐—ฆ/๐—ง๐—ฅ๐—˜๐—ก๐——๐—ฆ

Uptrends - Are identified by Higher highs and higher lows

Downtrends - Are identified by Lower high and Lower lows

Sideways - Is identified by the lows and highs almost if not equal forming a box Image
Jun 8 โ€ข 11 tweets โ€ข 4 min read
How to Identify Supply and Demand Zones on the Chart

After 11 years of trading these are the best and easiest methods to Identify Supply and Demand Zones ๐Ÿงต

$SPY $SPX $QQQ Image Things To Know ๐Ÿ’ก

Identifying market imbalances is the first step to finding supply and demand zones. In simple words, market imbalances refer to big price shifts in one direction (either upward or downward) based on fluctuating supply and demand.