1/ If we look at total tx vol & daily tx vol '19 fell below both '17 & '18 levels at $768bn / $2.1bn respectively (using adjusted tx vol per @coinmetrics The theoretical cost basis of $BTC for all holders closed the year +21% to go along with that 85.4% increase in price.

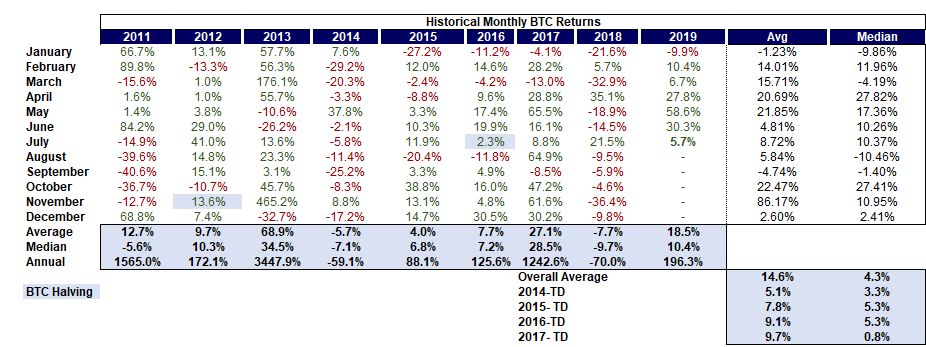
 1/ Historically 4Q is the best quarter of the year for $BTC (followed by 1Q) last year was the first down 4Q since 2014 and the first down November since 2011.
 1/ This meant $BTC finished 3Q (23.5%) the 5th worst quarterly performance dating back to 2012. Perhaps this shouldn’t have come as a surprise as this following 2Q’s +163.5% or the 3rd best quarter of all time
 1/ The difference between the theoretical $BTC cost basis and current value is now at a 100%+ premium back to levels not seen since Jan '18. At the start of the last rally these are levels first seen in December of '16.
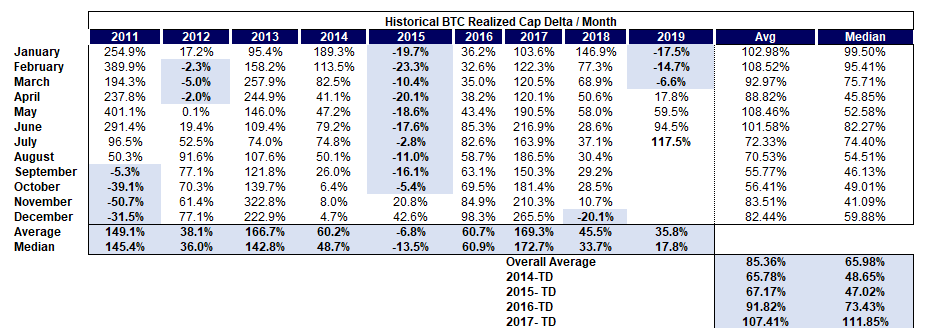
 1/ Looking at other top weekly $BTC performances during that time the subsequent weekly performance skews slightly + (57%) with the monthly performance negative (57.1%) that said 2 of the 8 weeks happened within the last month and those occurrences in '19 have been positive
 1/ Following a top performing month, $BTC subsequent performance skews surprisingly positive in the 1-3 months post which is likely attributable to the reflexivity of the asset class with these outlier months kicking off bull runs (or happening within them)
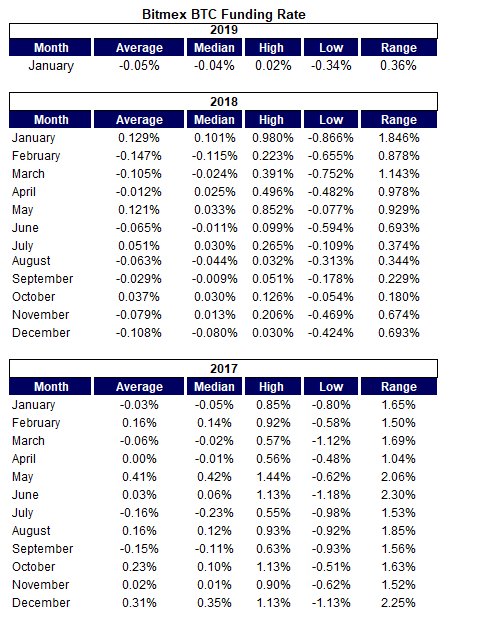
 1/ Looking at historical $BTC funding periods >0.35% there's been 107 such occurrences with the overwhelming majority occurring in 2017 before Bitmex had any real market impact (for some reason May has been the most popular month with 25 observations or ~23.4%).
 1/ Notably $BTC vol was ~50% annualized over the course of the month. The lowest volatility month that had positive $BTC performance since April ’17 (+32.5% and / 31.2% annualized vol).
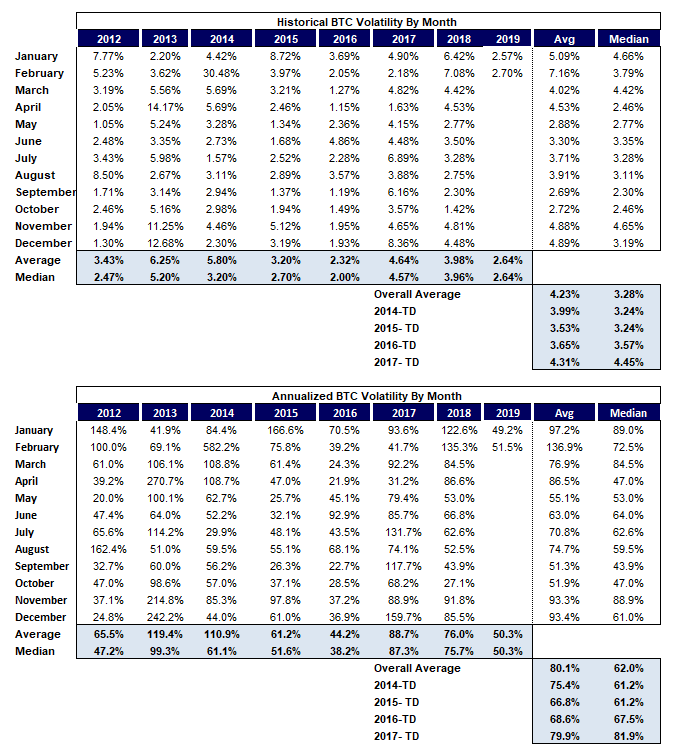
 1/ Looking at $BTC adjusted transaction volume January of ’19 saw the lowest average daily volume since April of ’17 at ~$1.3bn/day
 1/ This is notable as it we’re starting to very slowly see signs of @Bitmex's influence retreating which should lead to a healthier spot market. Jan will mark the lowest % increase in the $BTC insurance fund since January of ’18 (when it was at 2,720 BTC vs. 21,600 last).
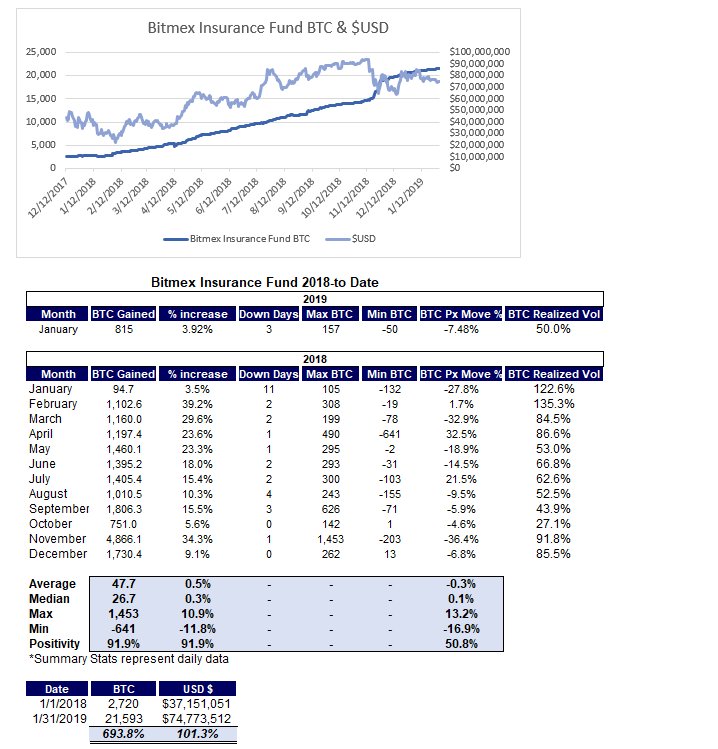
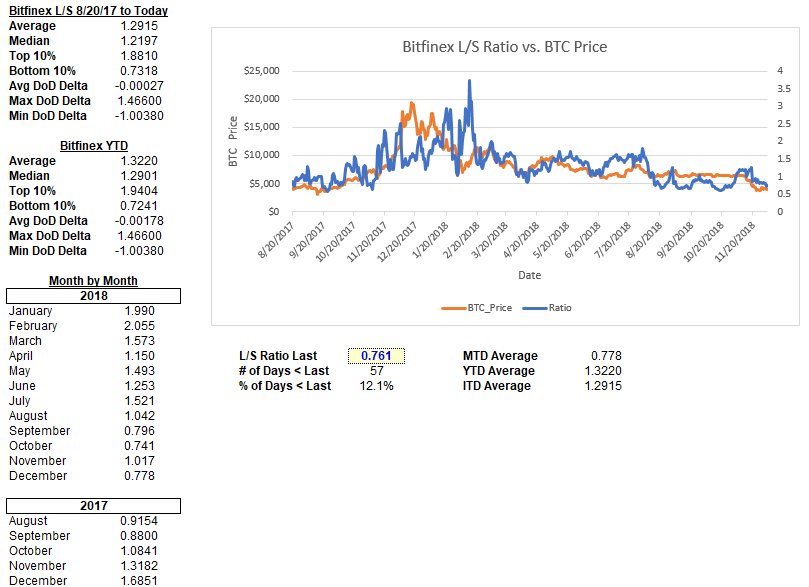
 1/ Looking at prior instances where the ratio decreased that much on a % basis the subsequent 1-3D period skews slightly positive while the ~5-20D post continues the downward trend in $BTC price action.
 1/ Looking @ $BTC's realized cap (thanks again @Coinmetrics) we saw the greatest divergence in mid-Dec b/w RC & spot price since the end of the bear market in Jan ’15 both bottoming -30.0% (this isn’t to suggest the selloff is done yet as ’15 bottomed at -43.3% vs. ’18 -30.7%).
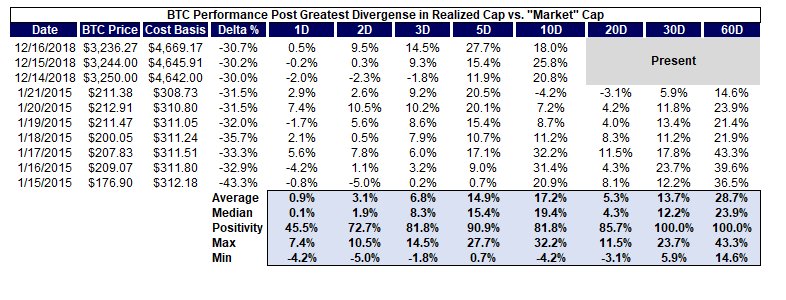
 1/ At present the $BTC market cap is ~30.0% below the realized cap which is a bottom 0.3% of observed periods going back to 2013. The only periods of greater divergence was during January of 2015.
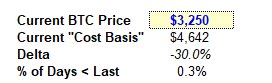
 1/ The market has a much different feel when that performance is off of previous YTD lows as opposed to the ATH. You continue to see near ATH levels of $BTC “turnover” which would seemingly suggest some signs of capitulation.
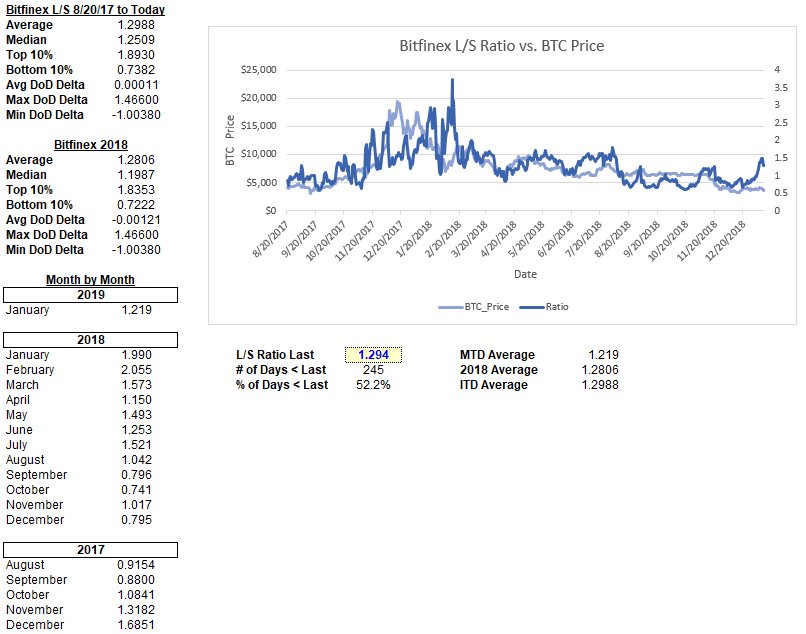
 1/ This coincides with the @bitfinex L/S ratio in the bottom ~12.0% of observed periods down to 0.76 last.