SQUARED2 Profile picture
📈 | Automated Trading Systems @ https://t.co/GP053tHNIR 💻 | ProRealCode Market @ https://t.co/CXAyE7nAec 🔌 | Compatible with IG & Interactive Brokers
Jun 19, 2025 8 tweets 2 min read
Most people obsess over annual return.

But in trading, how you get there matters more than what you get.

Why? Because:
📉 Volatility compounds
⏳ Sequence matters
💥 Drawdowns destroy potential

Let’s go deeper 👇 Arithmetic vs Geometric Mean
- Arithmetic Return = Avg of returns
- Geometric Return = Compounded return

If you gain 50% and then lose 50%, your arithmetic return is 0%.

But your capital?
📉 Down -25%

Compounding punishes variance.
Jun 12, 2025 12 tweets 2 min read
Building a Multi-System Portfolio from the Ground Up

“Don’t optimize one system. Build thirty uncorrelated ones instead.”

After a lot of development, I now run 30+ systems using a 4-layer diversification framework.

Here’s what I’ve learned. 👇 Why Multi-System?

No single strategy wins in all regimes.
Markets change. Volatility flips.

The best way to survive and compound is through layered, engineered diversification.

It’s not “don’t put all eggs in one basket” — it’s “design 30 baskets.”
Jun 5, 2025 8 tweets 2 min read
Sharpe & Sortino Are Dead (for Algos)

Most trading algos don’t have Gaussian returns.
So why do we use metrics that assume they do?

Let’s break this down. 👇 What’s Sharpe?

It’s a risk-adjusted return metric:
Sharpe = (Mean Return - Risk-free Rate) / Std Dev of Returns

Nice on paper. But it assumes:

- Normal distribution
- Linear return paths
- Stationarity

That’s rarely the case in algorithmic trading.
Jun 3, 2025 11 tweets 2 min read
Signal too rare?

Edge case looks amazing in backtest?

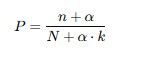
Let’s talk about Laplace smoothing and how it can de-bias your algorithmic trading systems. 👇 In trading systems, especially when dealing with conditional probabilities or rare signal events, raw frequencies lie.

A signal that won 4 out of 4 times isn’t 100% reliable.
It’s undersampled noise.
May 29, 2025 10 tweets 2 min read
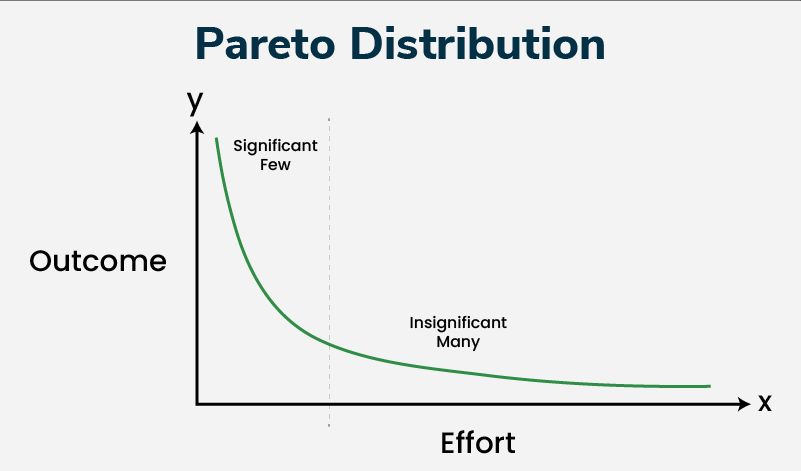
Your trading system or portfolio performance probably follows a Pareto distribution — whether you realize it or not.

This means a minority of trades or systems produce the majority of gains.
Let’s break it down. 👇 Image The Pareto distribution is a power-law probability distribution:

Where:

Xm = Minimum Possible Value
α = shape parameter, a.k.a. the Pareto index Image
May 27, 2025 11 tweets 2 min read
Last week, we broke down collinearity in parameter sensitivity when designing trading systems - This week, we zoom out

Let’s talk multicollinearity in technical indicators—where using too-similar tools can destroy the integrity of your signals.👇 Multicollinearity = using indicators that rely on the same underlying inputs, manipulated in slightly different ways.

The result?

They appear to confirm each other… but you’re just looking at the same thing twice.
May 22, 2025 9 tweets 2 min read
Parameter Sensitivity & Collinearity

Most traders test system robustness by varying parameters. But many ignore collinearity—a silent killer of true sensitivity analysis.

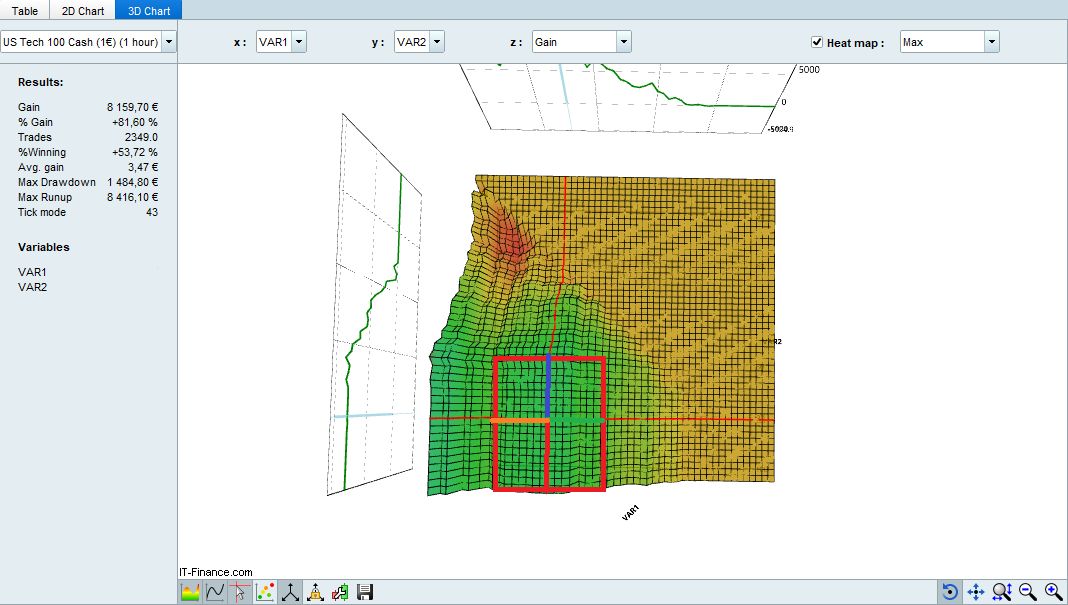
Let’s cut through the noise. Here’s what you need to know 👇 Image What is collinearity?
In trading systems, it means two or more parameters are linearly correlated.

Example:
Fast MA = 50
Slow MA = 200
Now you test 50/200, 60/210, 70/220...

You think you’re testing "sensitivity." You're not. You’re just shifting the same ratio.
May 20, 2025 8 tweets 3 min read
Most traders only look at return and max drawdown - But that’s just scratching the surface.

If you’re serious about system robustness, you need to go deeper.

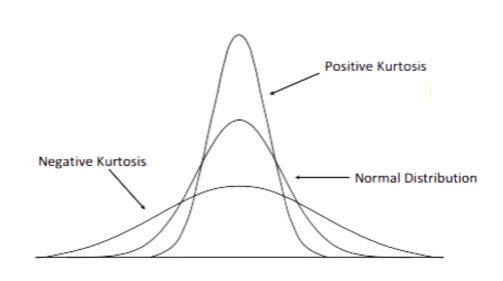
I’m talking skew, kurtosis, CV, and serial correlation.

Let’s break these down and why they matter. 👇 Image Skewness measures the asymmetry of a return or drawdown distribution.
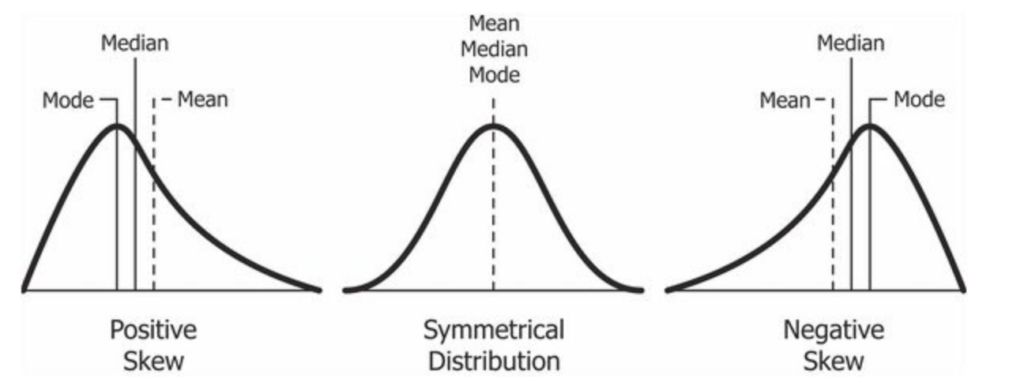
- Positive skew: long tail on the right — rare large gains

- Negative skew: long tail on the left — rare large losses

I actively avoid systems with strong negative skew in drawdowns - It’s a sign that “the real pain” might still be ahead.Image
May 15, 2025 10 tweets 2 min read
My background is in physics — quantum physics, specifically.

I spent years working with lasers, coherence, and wave interference.
Now I build trading systems.

Surprisingly, the math behind robust portfolios isn’t far from optics.
Let’s talk Monte Carlo, interference, and system design 🧵 👇 Each trading strategy can be modeled like a waveform.
Returns = amplitude
Trade frequency = wavelength
Timing of wins/losses = phase offset

Combine multiple systems, and you’re performing a form of time-domain signal superposition.
May 7, 2025 9 tweets 2 min read
🧵Why the Best Systems Are BORING.

You know the ones trucking along, making 20-30% a year?

The ones that are ROBUST - None of that overfitted 500% bullshit you see posted all over Twitter.

I'm talking the real deal - The boring ones. The grinders.

Let’s unpack why the most effective trading systems are often the least exciting 👇 We’re wired to crave action.

Fast trades. Quick profits. Constant stimulation.

An overfitted backtest? SIGN ME THE FUCK UP.

But trading like that is often just gambling with a better outfit.

True consistency? It’s methodical, repetitive… even boring. Image
Apr 29, 2025 9 tweets 2 min read
🧵 Time-based exits: an underrated risk control

Most traders obsess over:

Stop loss size

Profit targets

Technical indicators

But there’s one thing that often quietly improves systems…

Time-based exits — and here’s why they work 👇 Every trade has a half-life.

The longer you’re in, the more randomness takes over.

If it hasn’t moved in your favor after X bars — especially on lower timeframes (5–30M) — your edge is likely gone.

A time-based exit helps you cut the noise and reset.
Holding for hours on a 5-minute setup? Makes no sense.
Apr 24, 2025 9 tweets 2 min read
The SL/TP optimization trap and how to avoid it.

We’ve all been there — tweaking stop-loss and take-profit levels in search of perfection.

But here’s the thing: optimizing SL/TP can actually backfire.

Let’s break down why this happens and how to avoid it 👇 Overfitting your strategy

When you optimize your SL/TP too much, you’re likely overfitting to historical data.

This means:

- The strategy is tailored to past market conditions

- It probably won't perform well in live markets

- Optimization doesn’t equal robustness, it's quite the opposite.
Apr 18, 2025 8 tweets 2 min read
You launched your algo.

It runs smooth… until it doesn’t. (These last few weeks anyone?)

You see a red streak.

You panic.

Should you shut it down?

Here’s how I decide whether to intervene or stay the hell out:

👇 Is this within expected drawdown?

Every system has a statistical signature — and that includes pain.

Before going live, you should know:

- Max DD from backtest

- Monte Carlo worst-case DD

- Stdev of returns

🔍 If the current drawdown is within expected boundaries: DO NOT TOUCH.
Apr 15, 2025 10 tweets 2 min read
Parameter Sensitivity Optimization: Where to Start and Why It Matters

Optimization is key to a robust trading system—but if you go in blindly, you're just curve-fitting noise.

So where do you start? Trigger, filter, SL/TP?

Let's break it down 👇 First things first: optimize the logic that creates the signal, not the exits.

That means your trigger and filters come before any SL/TP tuning.
Why? Because without a consistent entry logic, exits are just damage control.
Apr 11, 2025 11 tweets 2 min read
As a developer of algorithmic systems, I rarely optimize more than two parameters. Why?

Because well-built strategies don’t need heavy curve fitting.
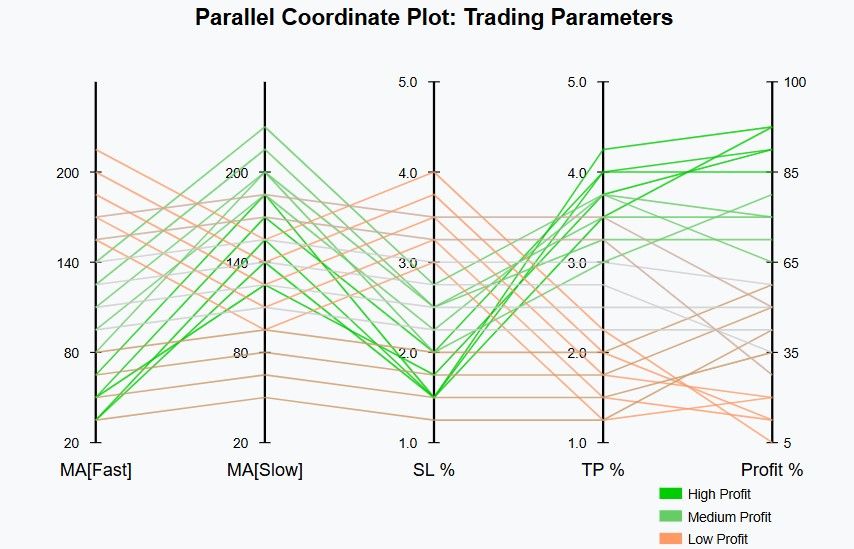
That said, when I do explore beyond 2D… I use Parallel Coordinate Plots

Here’s how 🧵👇 Multivariate Parameter Sensitivity

This is the process of understanding how multiple parameters interact to influence performance.

Instead of just testing MA[Fast] vs MA[Slow] on a 2D grid, what if you added SL, TP, or Filter settings too?

It gets complex fast.
Dec 17, 2024 12 tweets 3 min read
Parameter Sensitivity!

I keep going on and on and on about it.

Why is it important?

Let's have a look! --> Image In algorithmic trading, every strategy has parameters that guide how it makes decisions. BUY when MA50 crosses over MA200 for example.
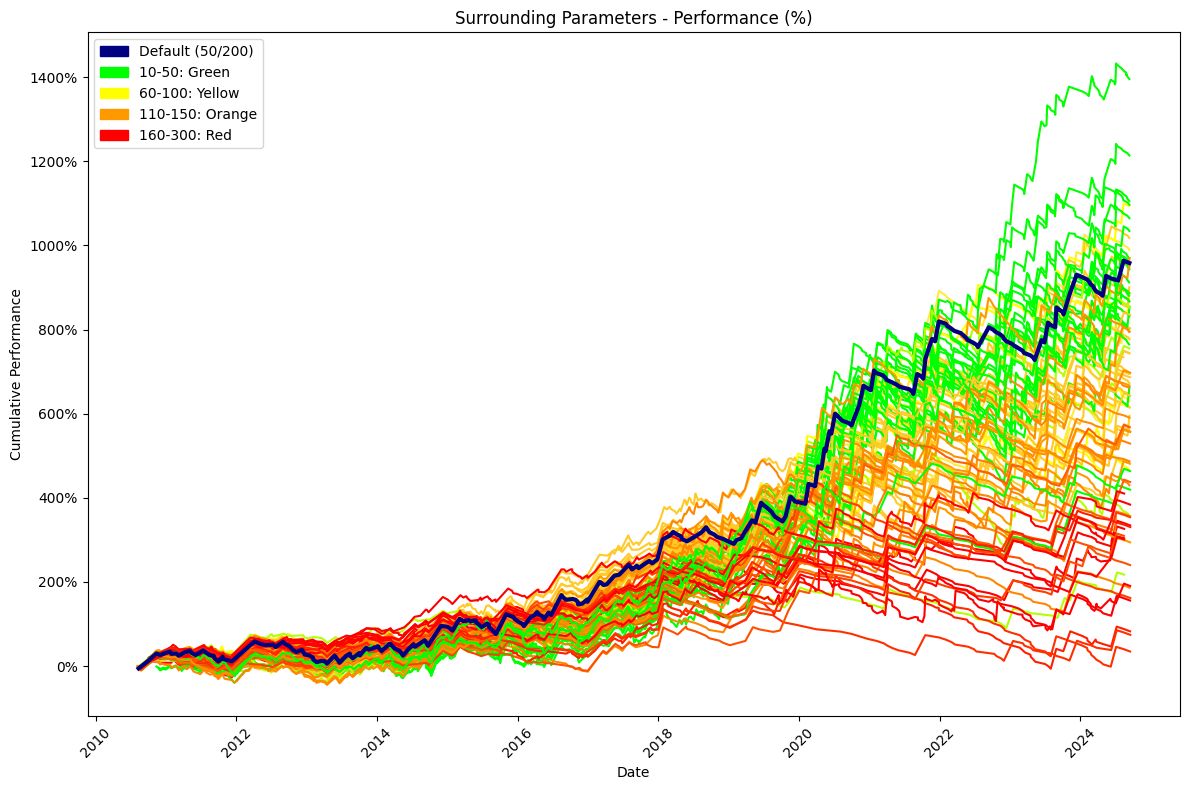
But what if your strategy's performance depends too much on specific parameter values? That's where parameter sensitivity comes in.
Oct 4, 2024 9 tweets 4 min read
Last Friday we showed another tool for Robustness testing, with the "Up & Down" method.

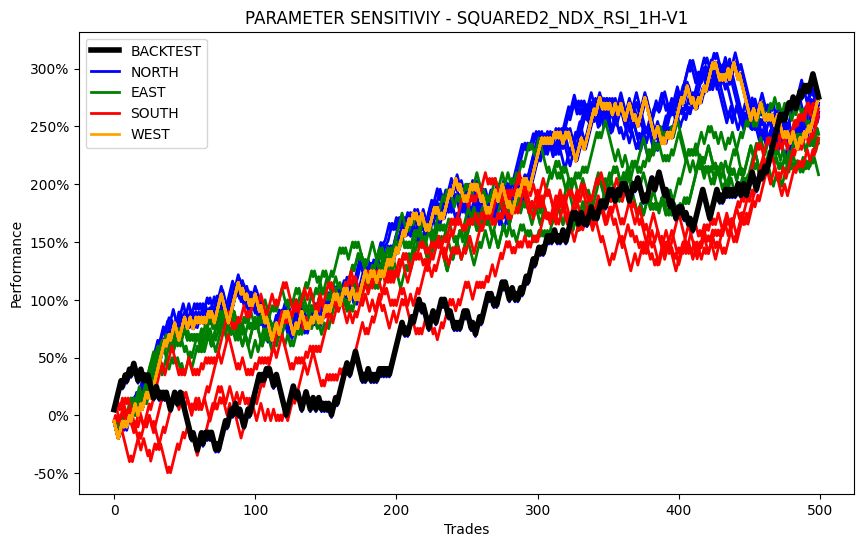
Today we'll dive deeper into Parameter Sensitvity, and show an additional way to illustrate this.

This is one of the methods that was mentioned in the repost by @snalanningen about a week back.

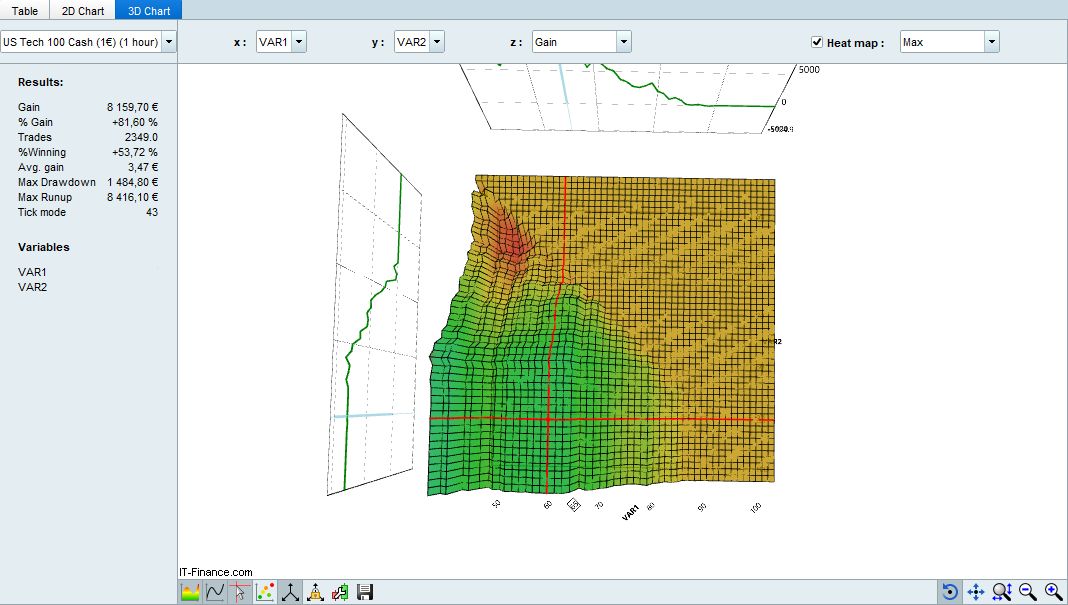
Let's go!Image @snalanningen More than likely, you've come across the topography of the parameter space.
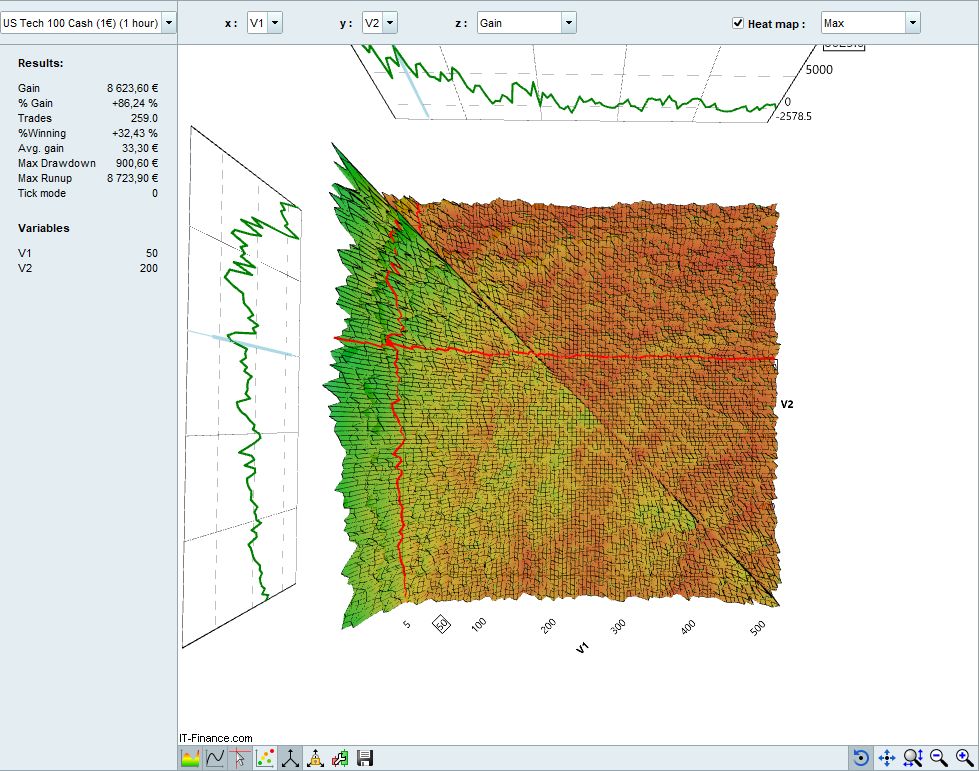
While very useful, it might be hard to visualize what it actually means in terms of the equity graph.

In this thread, we'll show you an alternate way to illustrate this --> Image
Sep 27, 2024 8 tweets 4 min read
Last friday we looked at yet another method to confirm robustness of your system, with the "Up & Down" method.

Today I want to show you what it looks like when you try to quantify the results of this method.

Let's go! Image A week ago we took our Larry Connors 2RSI system that we developed using ChatGPT and ran it through the "Up & Down" test.
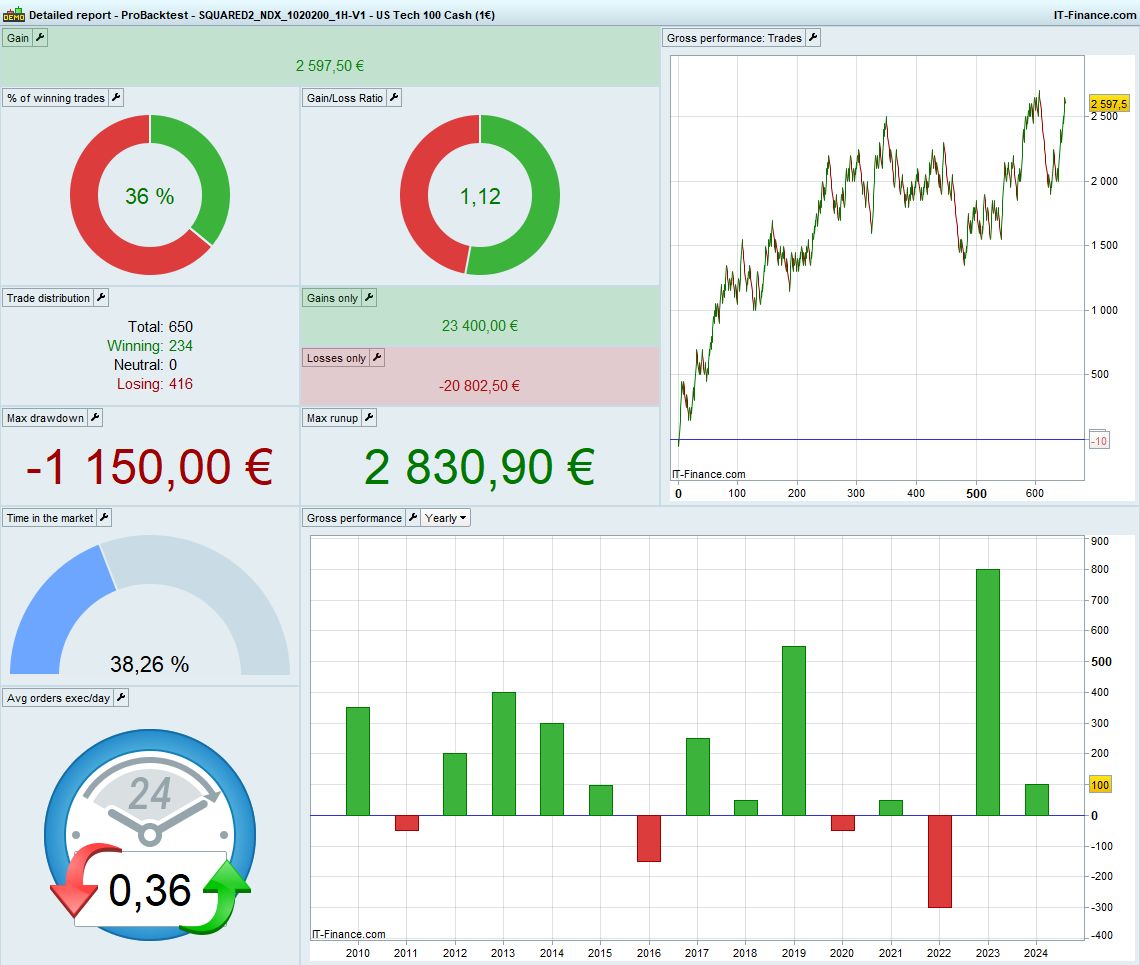
"Up & Down" means that we test the system two timeframes up, and two timeframes down.

The system developed was intended for the 1H timeframe, so we tested it on the 4H, Daily and Weekly for the "Up" portion, and 30M, 15M, 10M for the "Down" portion.

We did three each way just for the sake of it.
Sep 17, 2024 16 tweets 5 min read
The Larry Connors 2RSI method.

Most of you have probably heard of it - some of you might have tried it!

Can ChatGPT to come up with an updated version of this legendary system?

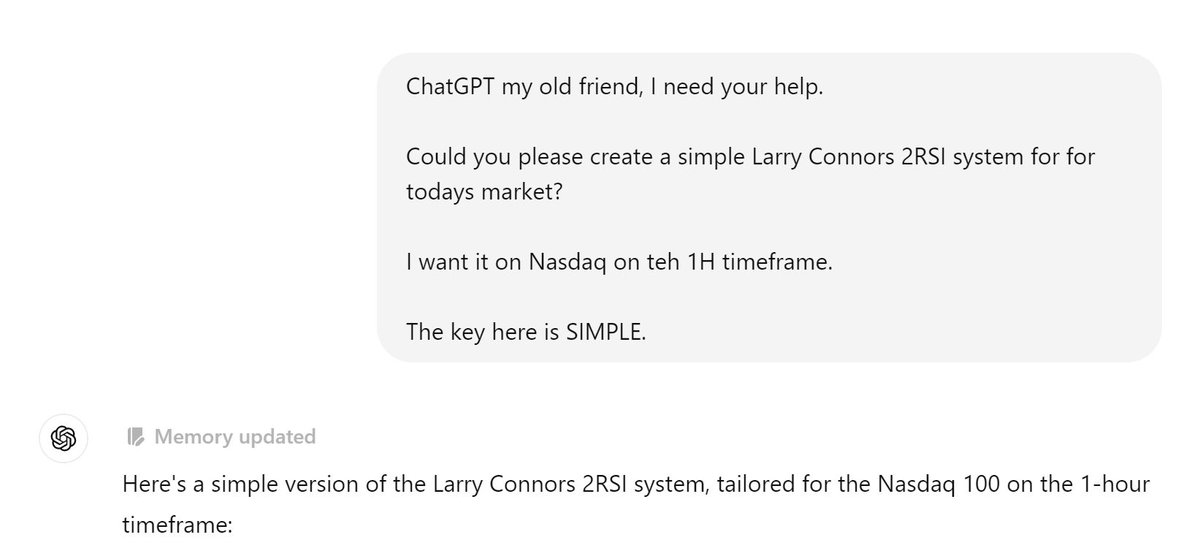
Let's go! We'll start with the prompt. Image
Sep 6, 2024 19 tweets 6 min read
It's Friday!

Should we look at automated alternatives?

Last week we looked into the 10/20/200-method on lower timeframes of the DAX - 3M, 5M, 10M.

The 5M seemed to be the most promising - Might make it work with some additional work.

Let's look at the 1H, 4H and Daily timeframes.

I rarely trade below the 1H timeframe (too noisy), so I'm really excited about these ones.

Let's dive in! --> Let's start from the bottom - the 1H

I went ahead and set the initial SL and TP to 100 and 200 respectively.

Not a good look initially! But, we've gotta look at the Parameter Space Image
Aug 28, 2024 22 tweets 8 min read
Yesterday I posted about the 10/20/200 method.

We looked at how it performs on the NASDAQ - specifically on the 3M, 5M and 10M timeframes.

But how about the 1H, 4H and Daily timeframes?

Let's dive in! --> Let's start from the bottom with the 1H timeframe.

I'll start by setting the SL and TP to 50/100 - I doubt this will be our final values, but it's a good start for the Parameter Sensitivity.

Alright, we've got something to work with. Image