Matt Harney Profile picture
SaaS Analyst @CloudRatings. Previously in software PE. Subscribe to my newsletter below:
Aug 2, 2024 β€’ 8 tweets β€’ 3 min read
πŸ†• excerpts from @ICONIQGrowth "State of Go To Market In 2024" (38 slides, n = 150)

Many of these growth rates = below the IPO-track Mendoza line Image πŸ‘€ at $25m-$100m new logo velocity Image
Jan 12, 2024 β€’ 8 tweets β€’ 3 min read
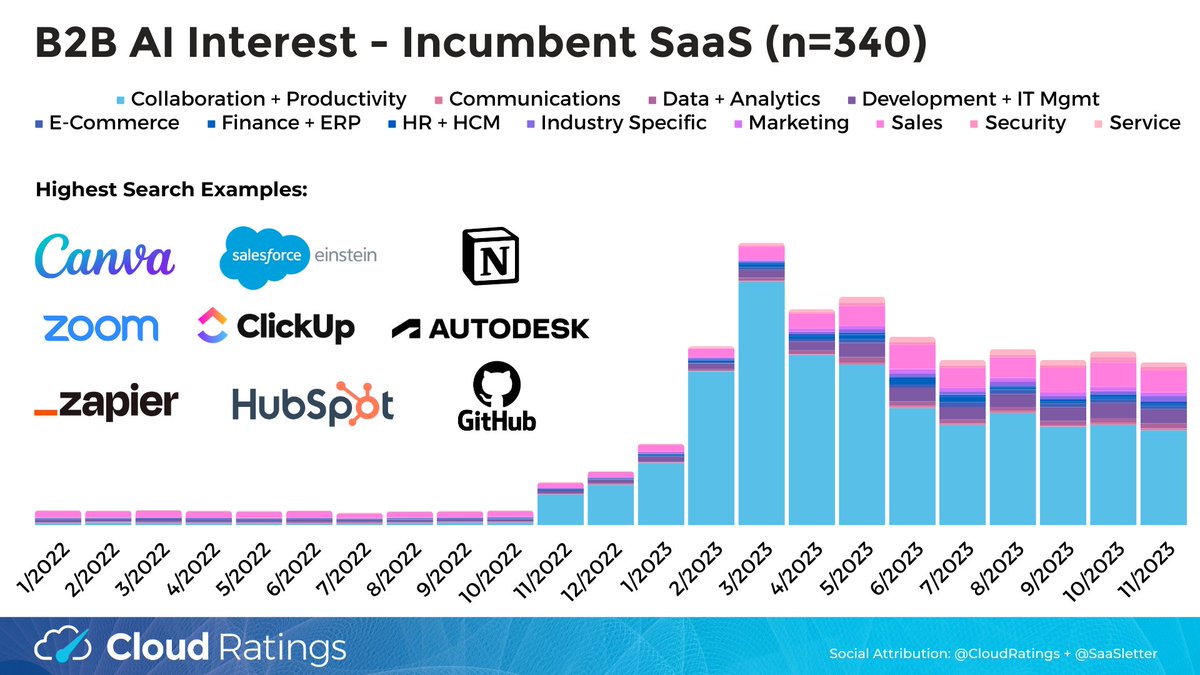
πŸ†• B2B AI Interest Index

Excited to debut this ongoing series.

Key points:
- underwhelming trends vs AI narrative

- interest is at "Atomic" level (i.e. productivity apps), "Compound" apps TBD

---

Trends for incumbent SaaS - majority at Atomic level: Image Trends for Blue Chip Basket:

Dominated by Microsoft Copilot (due to product announcement cycle).

Salesforce (distant) #2 with consistent interest since Dec 2021 Image
Jan 4, 2024 β€’ 6 tweets β€’ 2 min read
AI-led gains in Sales + Marketing and Engineering

should (???) be a margin tailwind for SaaS...

McKinsey data re-cut:

/1 Image Given the cost structure of SaaS (GTM ~40%, R&D ~25%), AI should have a disproportionate impact vs other industries

As born out by McKinsey's estimates...

/2 Image
Nov 30, 2023 β€’ 7 tweets β€’ 3 min read
πŸ‘€ new 148-slide report from @insightpartners - "Post-Sales Go-to-Market (GTM)" -> so customer success + expansion

Excerpts below

More on next week

πŸ‘€ NPS by ARR saasletter.com
Image πŸ”₯ GRR + NRR data, especially transactional vs consultative split Image
Nov 14, 2023 β€’ 5 tweets β€’ 2 min read
πŸ‘€ on CPI day, here is latest SaaS inflation data via @verticeHQ Image I believe these comparisons are too unadjusted CPIs Image
Sep 26, 2023 β€’ 7 tweets β€’ 3 min read
My excerpts from @BatteryVentures's new "State of Enterprise Tech Spending"

Beyond obvious AI boom, their summary slide points to stabilizing market:

/1 Image Stability - even an uptick - shown here w/ drivers

/2
Image
Image
Sep 13, 2023 β€’ 5 tweets β€’ 2 min read
πŸ‘€notes from @lightspeedvp "2023 GTM & Sales Benchmark Report"

n = 143, w/ core in Series A to C, data thru Q2 2023

πŸ†˜"only 33% of reps hitting quota" -> continue theme of early stage vendors hit hardest

/1 Image πŸ†˜ "In the first half of the year, 63% of companies missed their revenue targets.

πŸ†˜"... 27% of those companies missed their revenue targets by more than 21%"

/2 Image
Sep 6, 2023 β€’ 5 tweets β€’ 2 min read
A *few* excerpts from an excellent @MeritechCapital "Software Pulse" update:

"shows that growth is 3.0x as correlated with multiple vs. FCF margin. Said another way, a 1% increase in growth would have the same impact on multiple as a 3.0% increase in FCF margin."

/1 Image Meritech itself uses an adjusted Rule of 40 (with a 3x weighting on revenue growth)...

their approach less volatile than traditional Rule of 40 method

/2 Image
Jul 6, 2023 β€’ 9 tweets β€’ 4 min read
*NEW SAAS BENCHMARKS (n = *1,880*)

from @rayrike + @Benchmarkitai

before getting into excerpts, wanted to flag *interactive* capabilities here:

https://t.co/K6xHFMrgSIsaasbenchmarks.ai/widget/saas-pe…
Now excerpts from report at :

πŸ‘Unique for the benchmark genre, historical + trended data https://t.co/c0wcGaU9Q6benchmarkit.ai/benchmarks