Prof. Shamika Ravi Profile picture
Mom. Economist. Professor. Member @EACtoPM. Thinking & writing on Econ Growth & Development. Here to share research. Past: @BrookingsInst @ISBedu @NYUniversity
30 subscribers
Mar 22 4 tweets 2 min read
It’s five years since I began the daily ritual of #COVID19India #DailyUpdate on the 10th of March 2020. They were the worst of times, that I had known as an economist, a mother and a citizen. The uncertainty was crushing! It was to anchor the escalating chaos, therefore, that we went back to the basics. It started as simple moving averages of a few variables. By the end of 2021, we had done >5L analyses - on all kinds of data related to the pandemic across India (& some global studies). Knowledge gave us perspective & helped us in mobilizing scholars & professionals. Research helped us to survive initially & overtime to thrive. We prevailed, as people and a nation. Some have documented our initial efforts:
openthemagazine.com/features/shami…
Sep 5, 2024 6 tweets 3 min read
There are major changes unfolding in India’s food consumption pattern - across all classes- with serious implications for our national policies in agriculture, health & nutrition and overall welfare. Here is our latest research: ‘Changes in India’s Food Consumption and Policy Implications: A Comprehensive Analysis of Household Consumption Expenditure Survey 2022-23 & 2011-12’.
eacpm.gov.in/wp-content/upl…Image 1) Big reduction in share of cereals:
Rural: 11% (2011-12) to 5% (2022-23)
Urban: 7% to 4%
Larger decline for poorer classes.
2) Big increase in share of conveyance- for all classes - rural & urban
3) Big increase in processed & packaged food - for all classes, but more for richer classes.
4) Big increase in pan/tobacco/intoxicants - for rural hhs, particularly poorer classes.Image
Feb 19, 2024 8 tweets 3 min read
Using excellent quality high resolution daytime satellite data, we study the growth rates at local levels (districts, sub-districts & parliament constituencies) - across India &compare b/w different political regimes. Main results:
1)18% higher growth rates on average under Modi. Image 
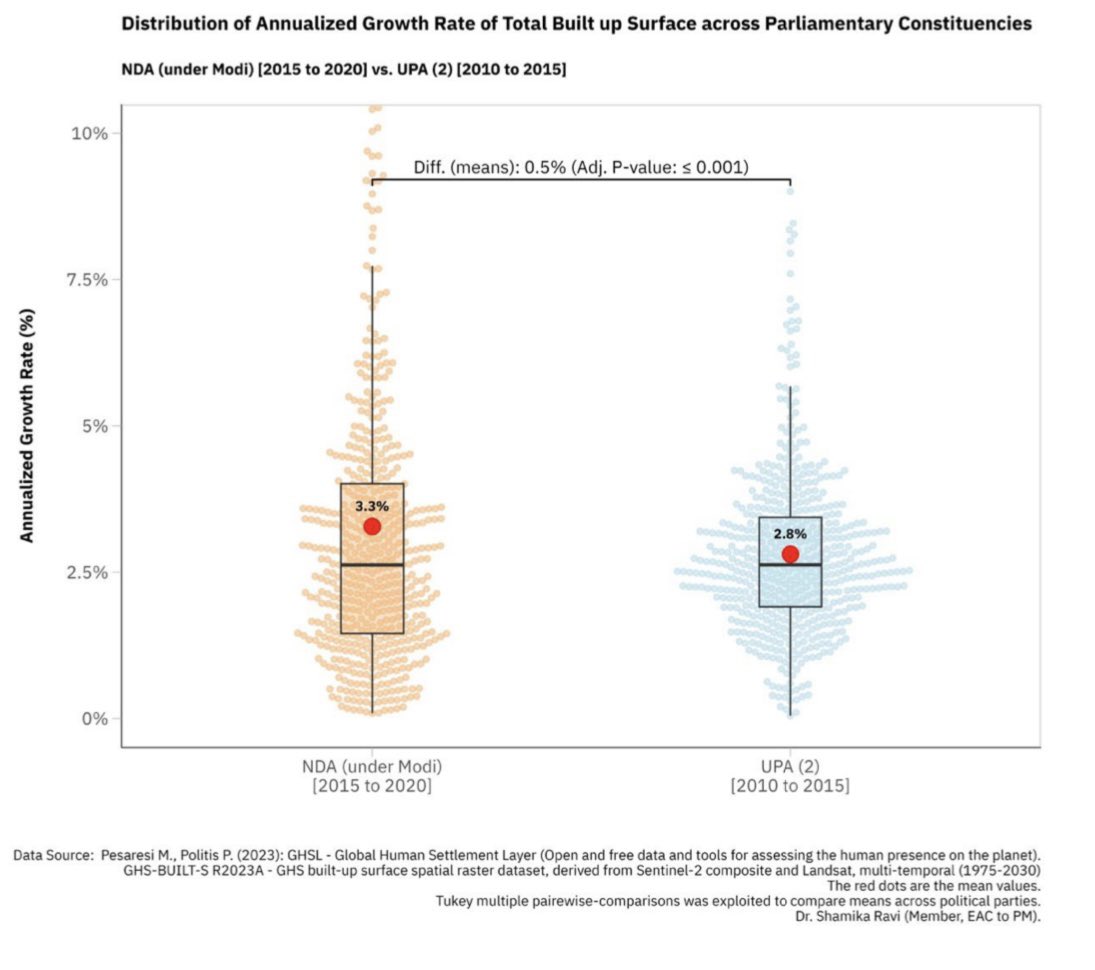
2) How is growth distributed across parliamentary constituencies? UPA(2) Vs. NDA(Modi) years:
Red denotes high growth rates - which is more widespread under Modi regime. Image
Dec 14, 2023 4 tweets 2 min read
Some troubling aspects of state budgets:
1) Interest payment has been consistently high (much above all-state average shown by red line) for: Kerala, West Bengal & Punjab. Image 
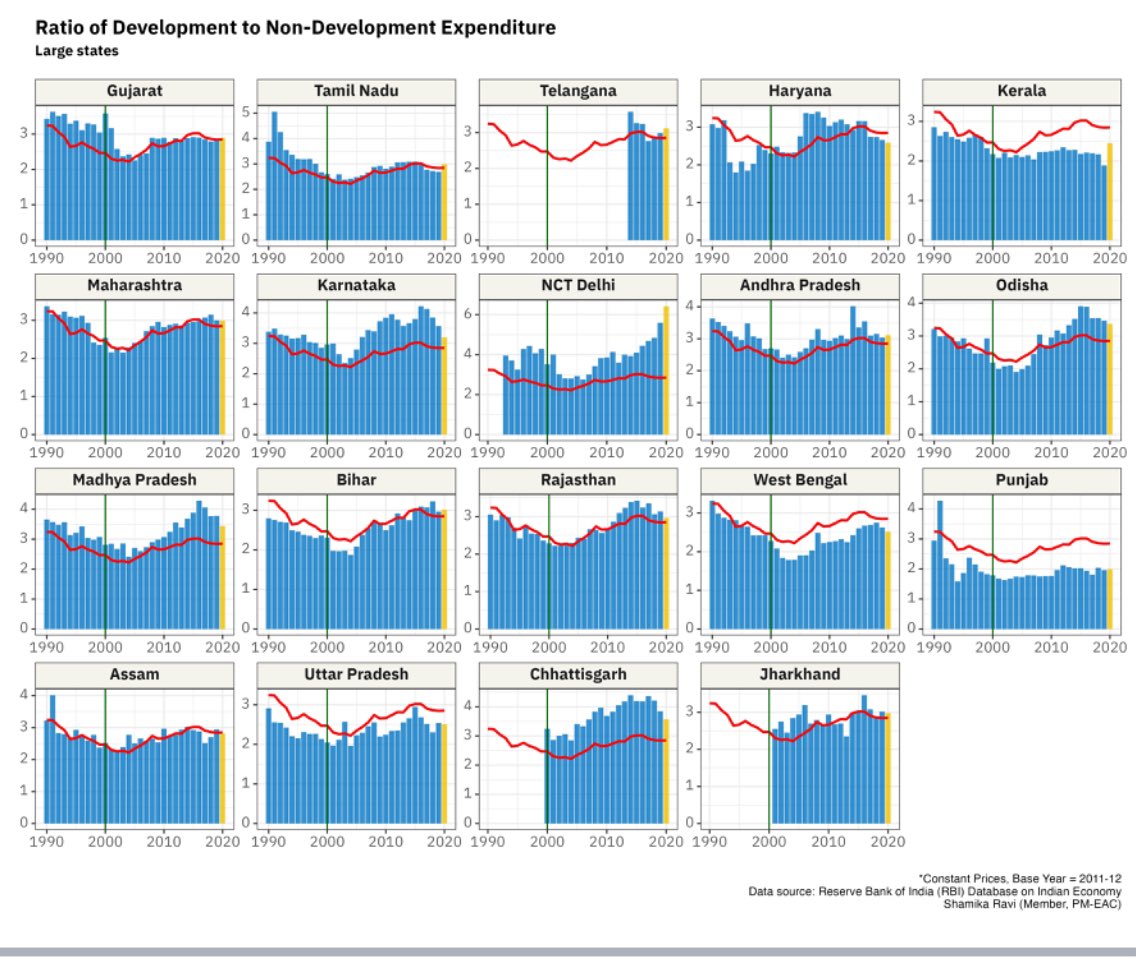
2) The Development Expenditure of states (in comparison to their Non-development Expenditure ) is least in Kerala & Punjab. This doesn’t portend well for their future growth & development. Image