
Electrotech, AI power/DCs, Sustainable Investing, NBA, & Rap posts. PM- public equities. Prior: HY credit, ibanking. All views expressed = personal. Not advice.

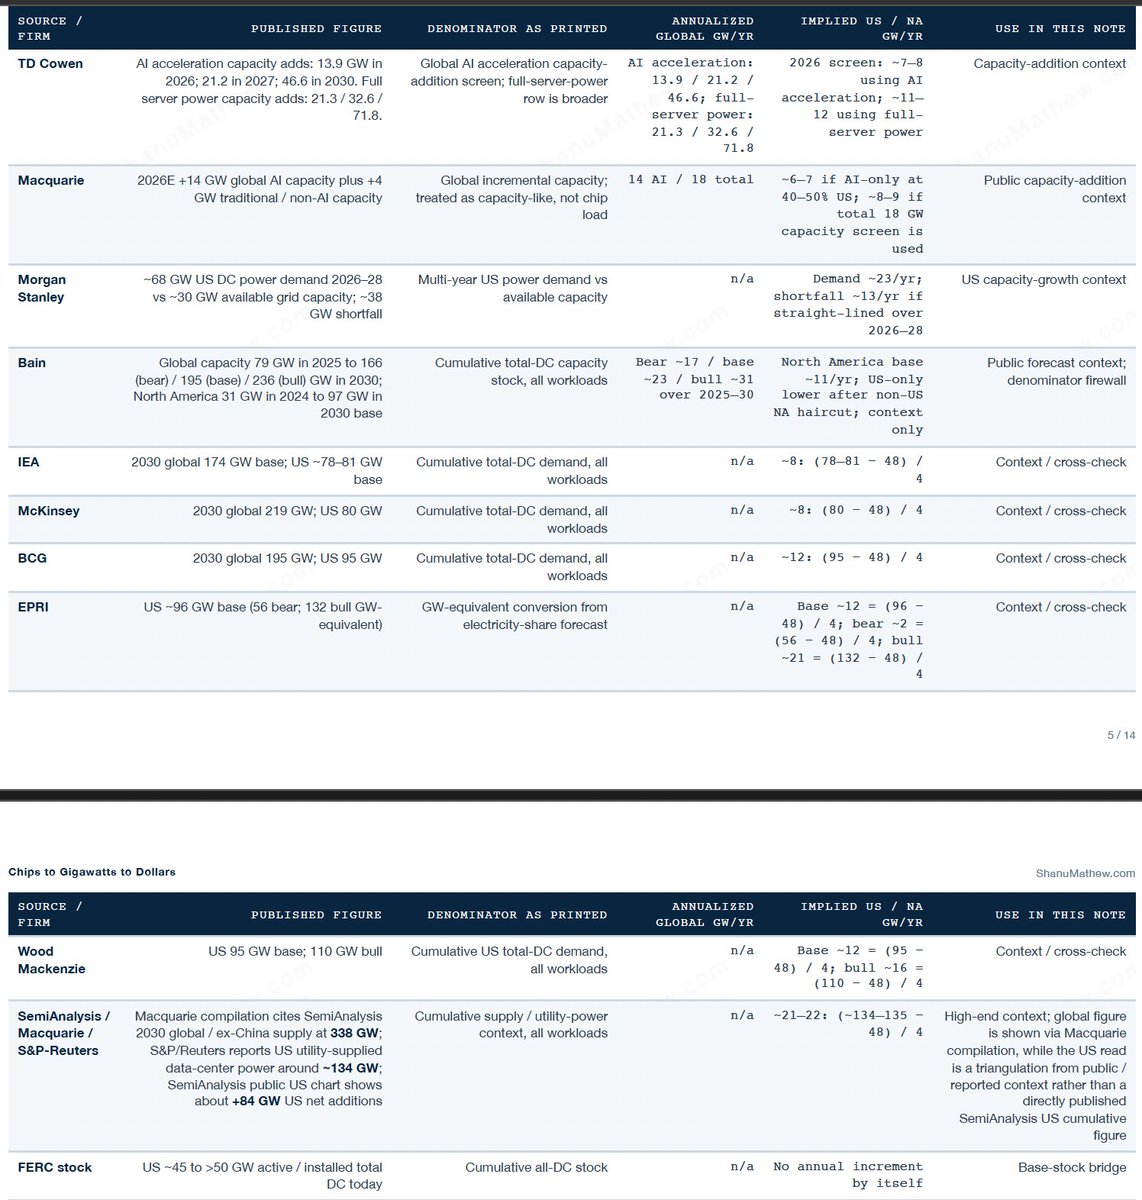
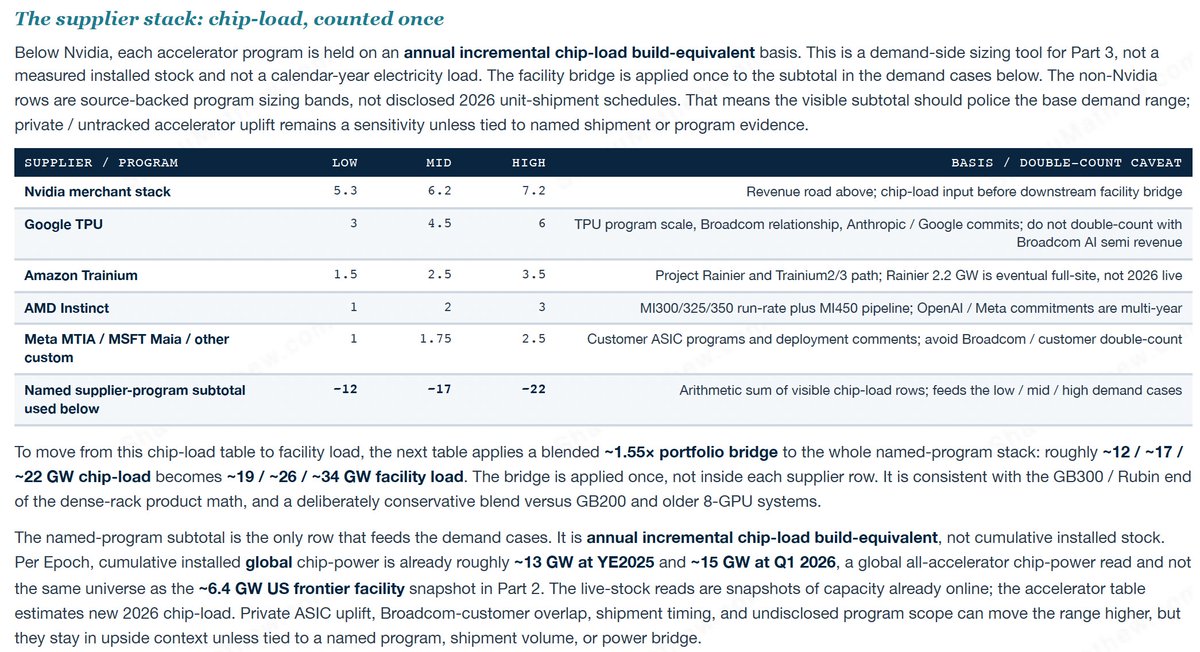
 2/ Build demand from the chips, bottom-up, program by program. The broad 2030 data-center forecasts measure stock, all-DC, global, or capacity adds, so they sit on different denominators and read lower.


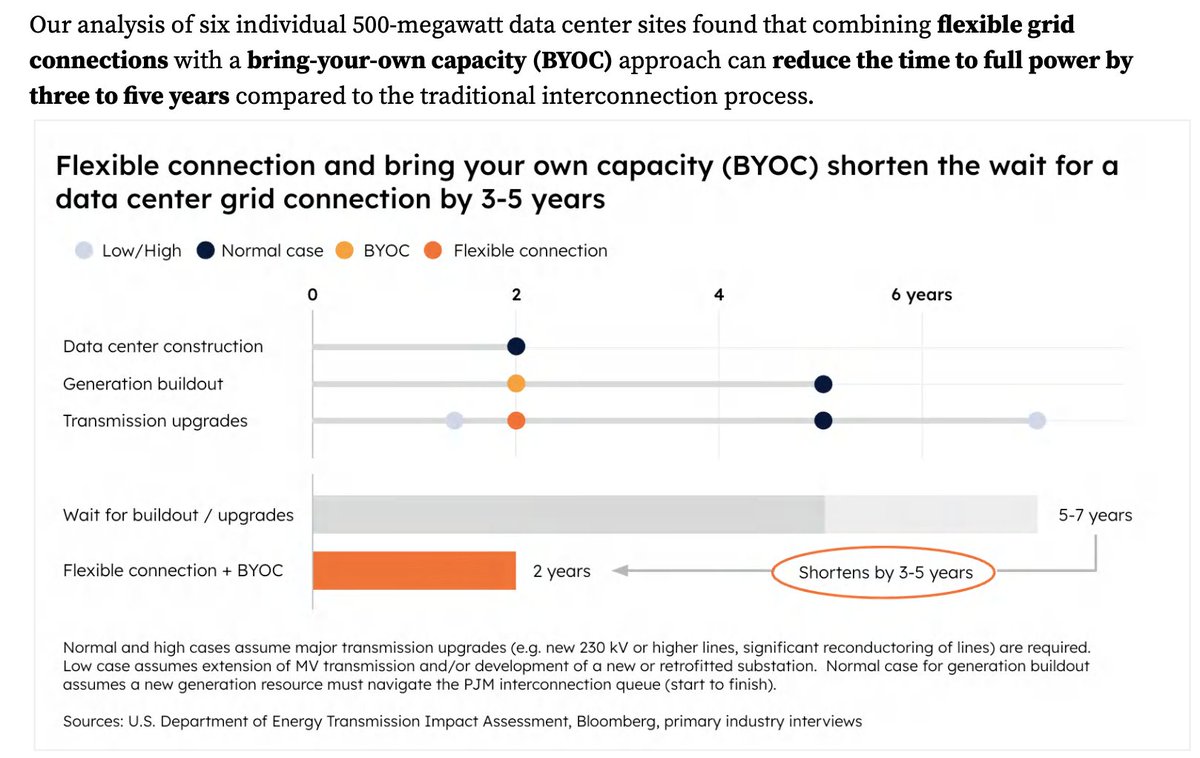

 Speed to power economics: 3-5 years faster = $2.3-5.5B incremental EBITDA per 500 MW site. Flexibility infrastructure costs $1.2-1.4B. Net positive returns even at conservative $4M/MW revenue with just 2 years of time savings.
 When adjusted for inflation, national avg. retail electricity real prices in 2024 were the same as 2019 and 8% lower than 2010
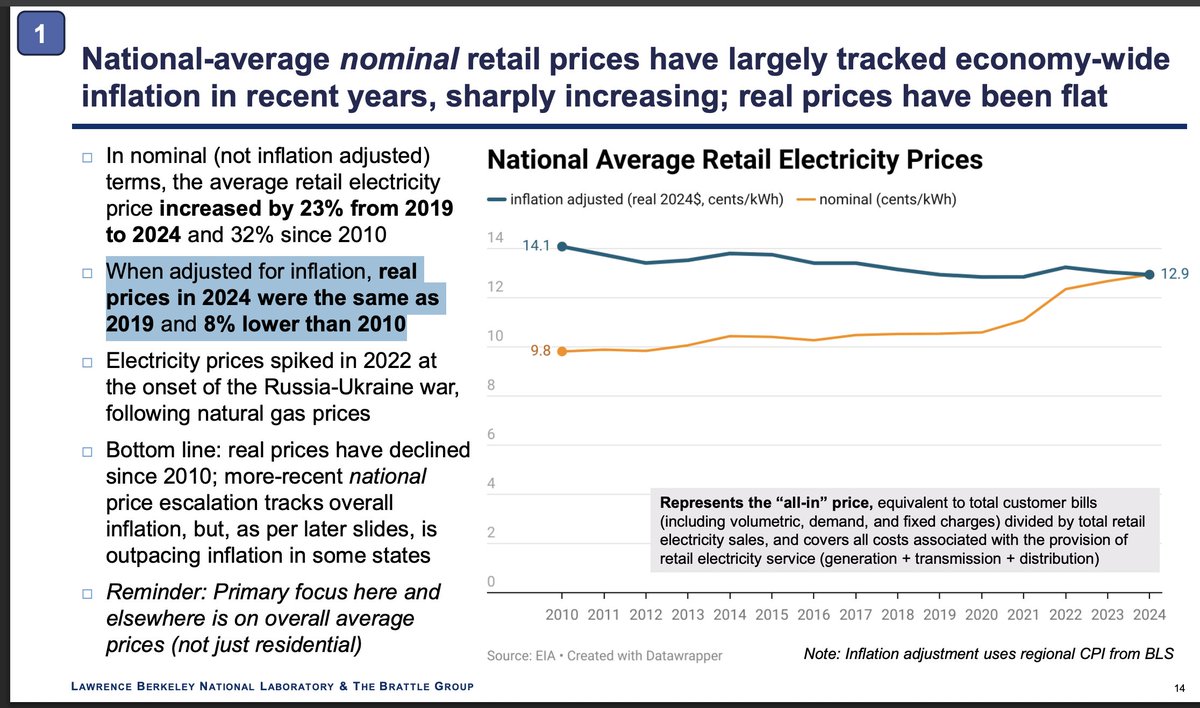
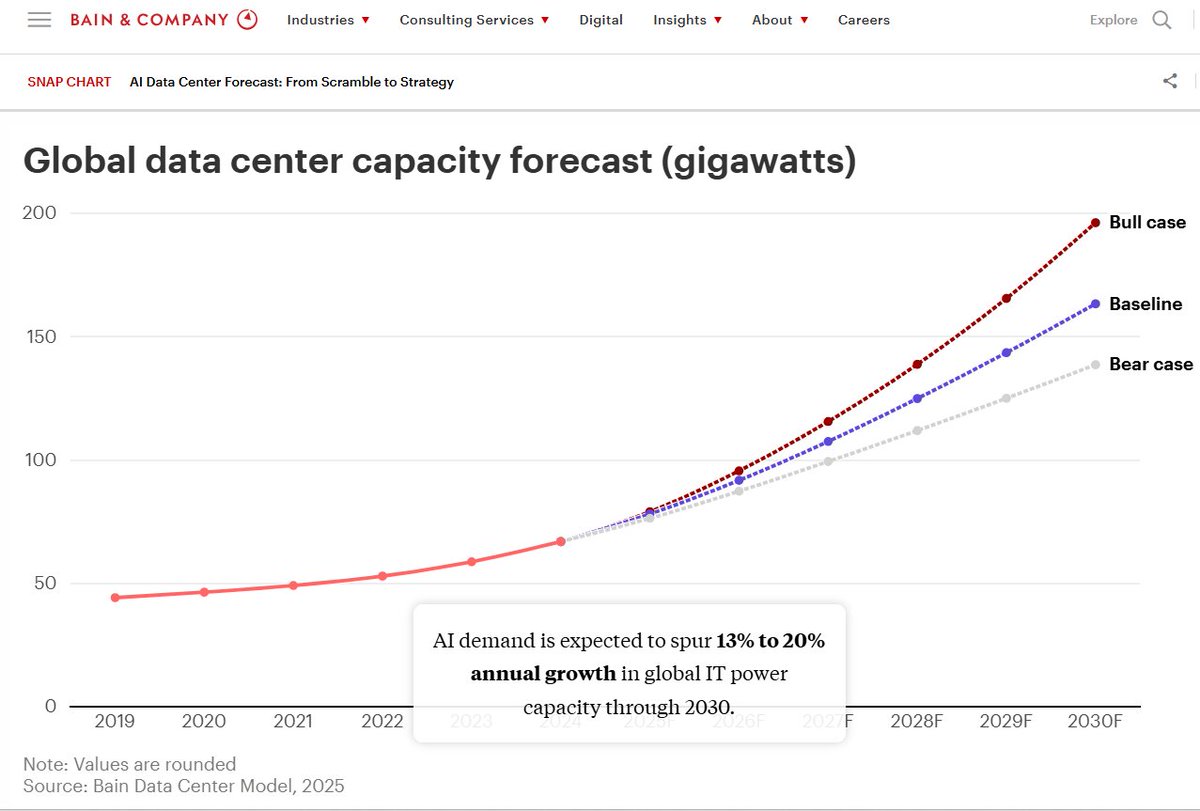 2020: 46GW
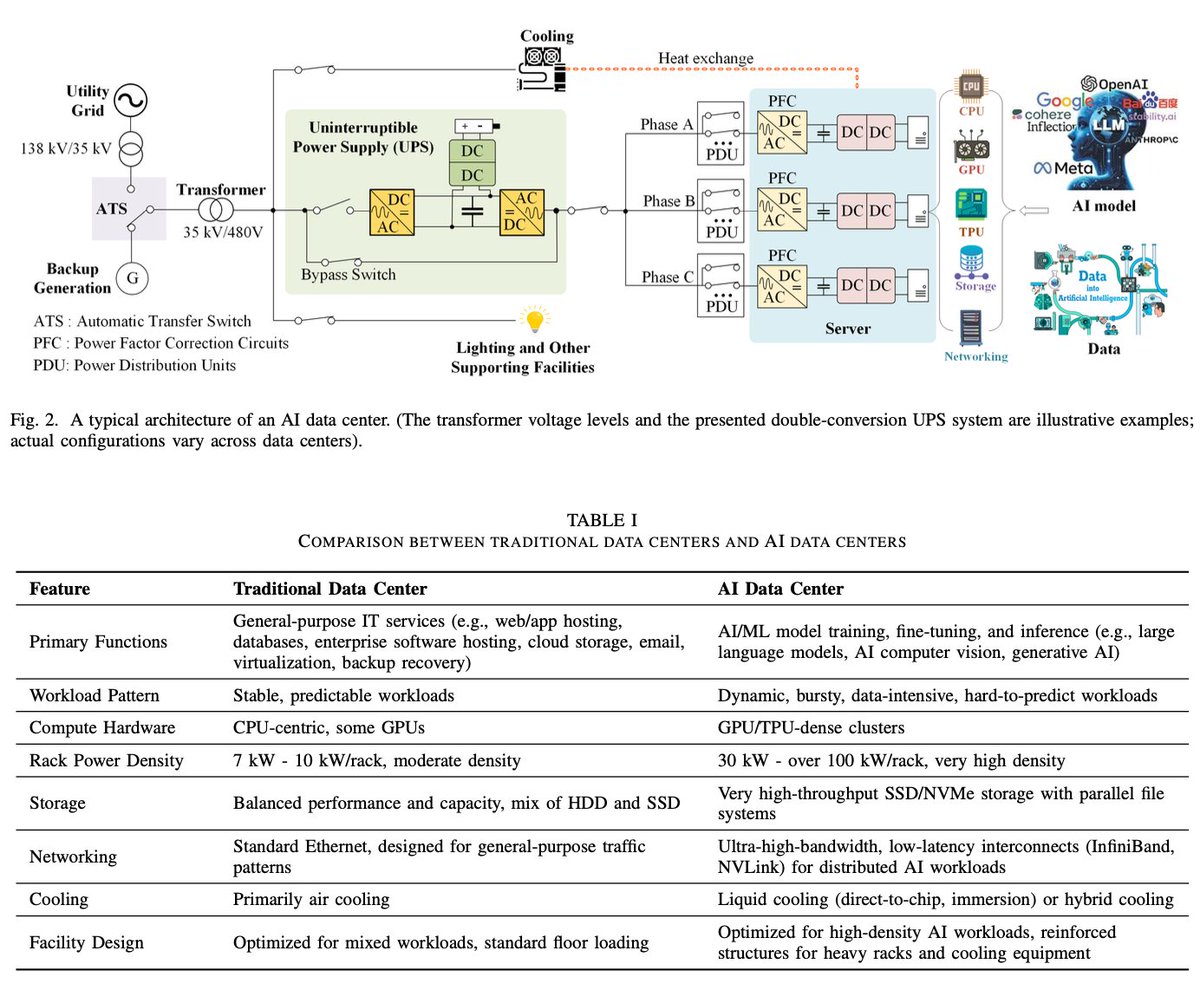 Power infrastructure + cooling techniques
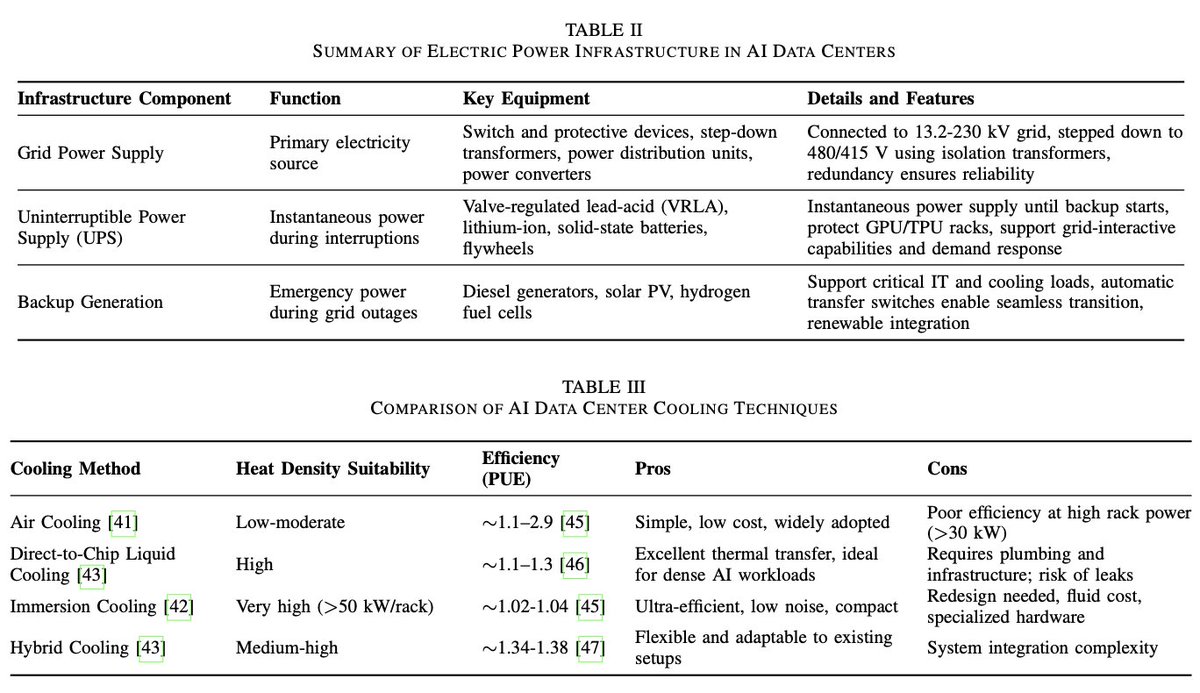
 Pillar I: Accelerate AI Innovation
 (2/9) Looking ahead to 2028, data centers could consume between 325-580 TWh annually - up to 12% of projected U.S. electricity use. This massive growth is primarily driven by AI workloads and GPU-accelerated computing.


 Electricity is the largest supplier of useful* energy.
 While we're at it, this is also true for all combustion of fossil fuels. Most of the energy burned becomes waste heat! I wish more people knew that when arguing this stuff. Imagine on a first principles basis arguing that the optimal state is one that wastes 2/3 of the output.


 Of that subgroup of consumers that rank clean products as very important, ~77% of consumers are willing to pay a premium

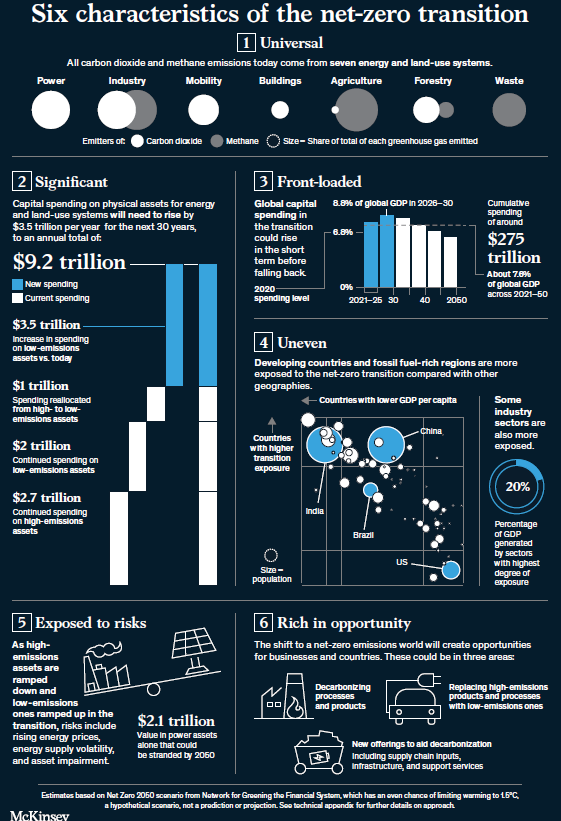 Cumulative spending on physical assets for Net Zero between 2021 and 2050 would be about ~$275 trillion. Means it will rise from ~$5.7 trillion today to an annual average of $9.2 trillion through 2050, an increase of $3.5 trillion.
 1. Corn -> ethanol -> gasoline