Smirkley Profile picture
Politics + data + charts + randomness 📉 + nonsense
May 13 6 tweets 2 min read
Supply & demand works.
191 US counties: more vacant rental units means faster falling rents. r = −0.66. @smirkley scatter plot, Apartment List April 2026 data, 191 US counties showing rental vacancy rate versus year-over-year rent growth, strong negative correlation r equals negative 0.66 Same story at the metro level. 123 markets. r = -0.64 @smirkley scatter chart from Apartment List April 2026, 123 US metros, rental vacancy rate on x-axis, year-over-year rent growth on y-axis, Pearson r negative 0.64, clear downward trend line
Apr 25 12 tweets 5 min read
Germany published 2025 crime data (BKA PKS) broken down by nationality. By request, I grouped them into 11 regions.

Violent crime:
East Asians commits violent crime at 0.46× the German rate.
MENA+ is at 8.43x. 1/ world regions in Germany, violent crime suspects per 100K as a multiple of the German rate (158/100K), sorted lowest to highest. East Asia 0.46×, SE Asia 0.84×, South Asia 1.15×, W. Europe 1.48×, Americas 1.54×, E. Europe 2.63×, C. Europe 2.80×, C.Asia/Caucasus 3.18×, Balkans 3.72×, Sub-Saharan Africa 6.57×, MENA+ 8.43×. BKA PKS 2025, Apr 21 2026. AZR 2024. @smirkley 
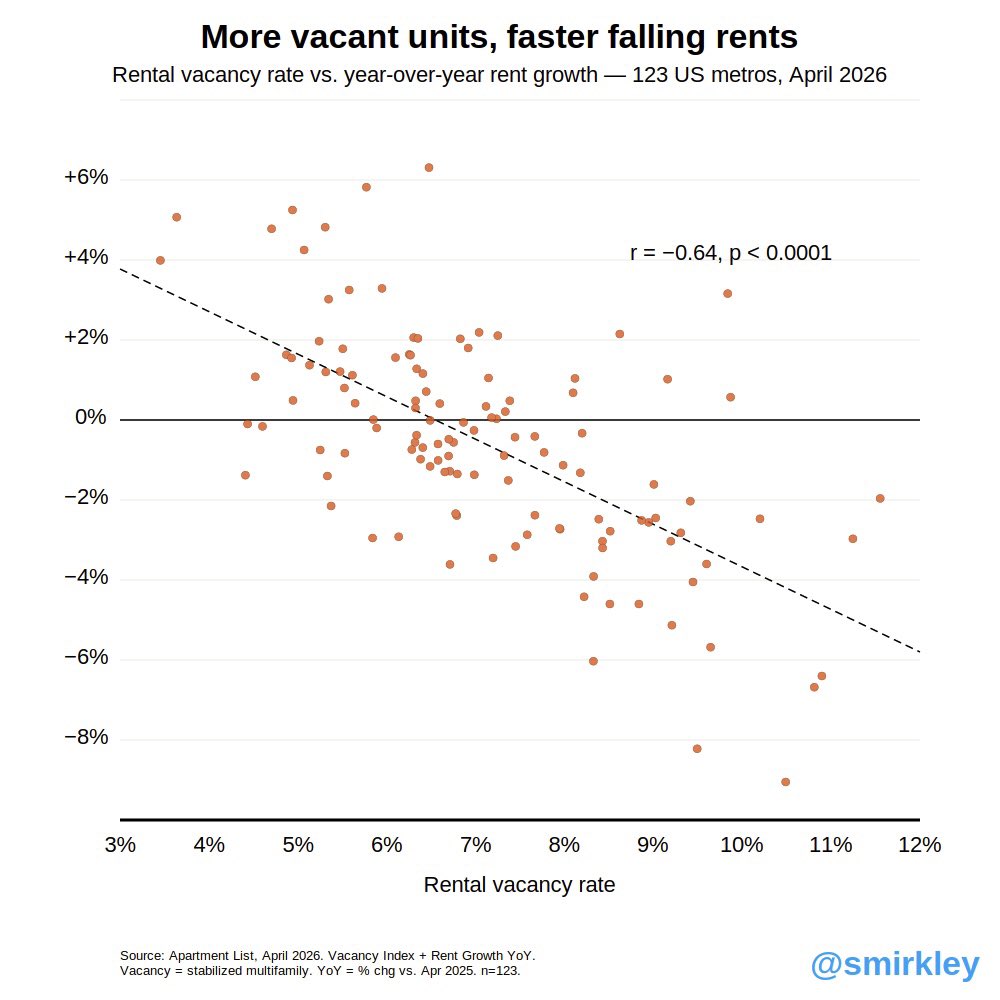
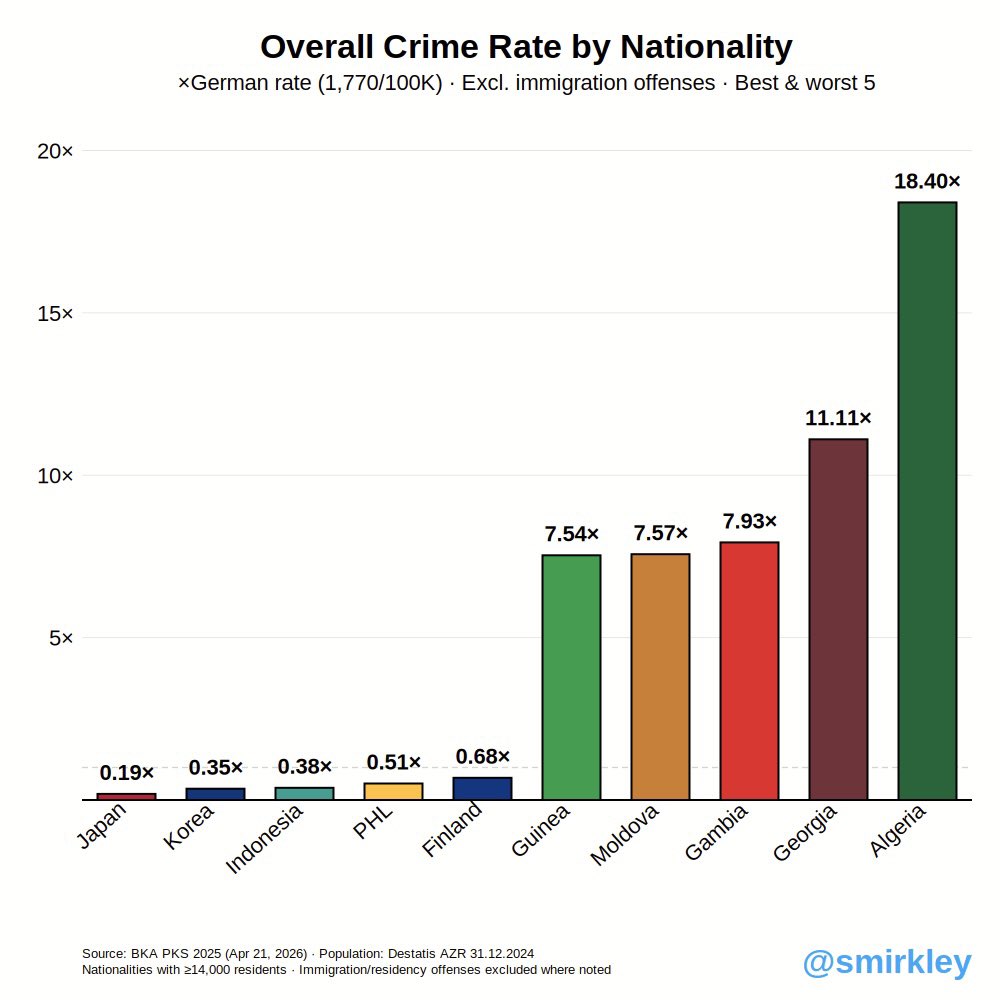
Overall crime 🇩🇪 2025:
East Asia is the only region below the German rate at 0.67×.
MENA+ (3.96×) & Sub-Saharan Africa (3.91×). 2/ Overall crime rate by region, excluding immigration offenses, as multiple of German rate (1,770/100K). East Asia 0.67×, SE Asia and South Asia both 1.01×, Americas 1.60×, W. Europe 1.66×, E. Europe 2.17×, C.Asia/Cauc 2.51×, C. Europe 2.96×, Balkans 3.38×, Sub-Sah. Africa 3.91×, MENA+ 3.96×. BKA PKS 2025, Apr 21 2026.
Apr 24 12 tweets 4 min read
Germany just released 2025 crime data.

Overall, Algerian nationals commit crime at 18x the rate of Germans and nearly 100x the rate of Japanese nationals. 1/11 Bar chart, Germany 2025, overall crime by nationality excl. immigration offenses, as multiple of German rate (1,770/100K). Japan 0.19×, Korea 0.35×, Indonesia 0.38×, Philippines 0.51×, Finland 0.68×, Guinea 7.54×, Moldova 7.57×, Gambia 7.93×, Georgia 11.11×, Algeria 18.40×. BKA PKS 2025, Apr 21 2026. Destatis AZR 2024. Pop. ≥14K. Murder 🇩🇪 2025:
Tunisia: 27× German rate.
India, Spain, Austria, Pakistan, UK and others zero murder suspects in 2025 across combined 840K+ residents. 2/11 Alt: Bar chart, murder suspects/100K, ×German rate (0.7/100K). India 0×, Spain 0×, Austria 0×, Pakistan 0×, UK 0×, Georgia 14.17×, Sweden 15.61×, Algeria 16.80×, Lebanon 18.08×, Tunisia 27.34×. BKA PKS 2025, Apr 21 2026. Destatis AZR 2024. Pop. ≥14K. 0 = no suspects recorded.
Apr 21 5 tweets 2 min read
What closes the ideology-mental health gap?🧵

Education actually doubles the gap. Thus the gap isn’t caused by uneducated conservatives refusing to seek help. 1/5 Chart GSS mental health showing showing three ideology groups (Liberal Chart showing showing three ideology groups (Liberal, Moderate, Conservative). Now marriage control., Moderate, Conservative) split into yellow (risk) and green (protective) bars. Per-subset r and p shown in notes. Education: BA+ amplifies gap (r=-0.296 vs -0.155 The mental health gap is stronger among above-median earners. 2/5 Chart showing showing three ideology groups (Liberal, Moderate, Conservative) split into yellow (risk) and green (protective) bars re mental health. Per-subset r and p shown in notes. Income control.
Mar 16 6 tweets 2 min read
NYC spends more per homeless person than the median NYC household earns. $81,705 per person in FY2025.

And $81,705 is a floor. It excludes supportive housing (~$500M/yr), mental health response teams, and NYPD encampment costs.

The city projects ~$97K per person in FY2026. NYC spending per street homeless person from FY2019 to FY2025 with FY2026 projected. Blue solid line rises from $28,428 in FY2019 to $81,705 in FY2025 — higher than the median NYC household income of ~$76,000. Dashed blue extension projects ~$97,000 in FY2026. Black dashed line shows inflation-adjusted real dollars ending at $65,890. Black note box states this is a floor estimate excluding supportive housing (~$500M/yr), mental health co-response teams, and NYPD costs. Bottom stats: population +26%, total spending +262%. Source: NY State Comptroller DiNapoli, March 2026. 
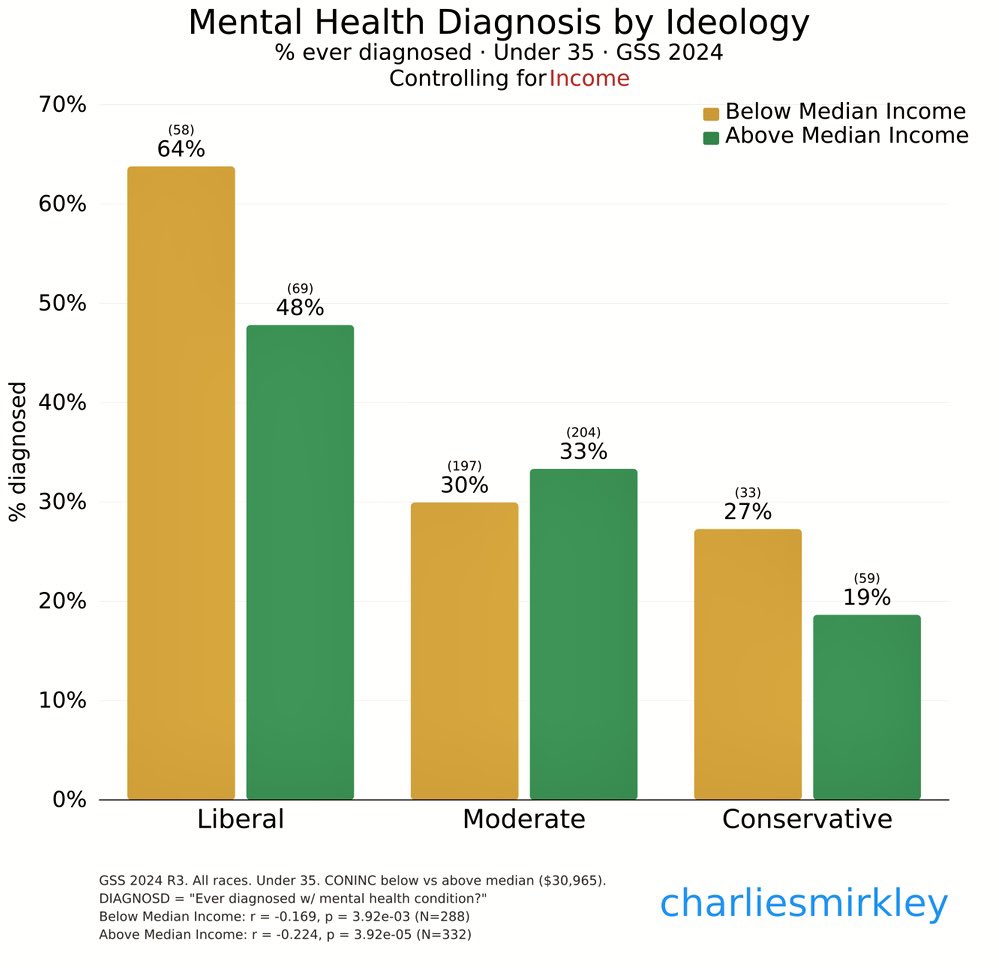
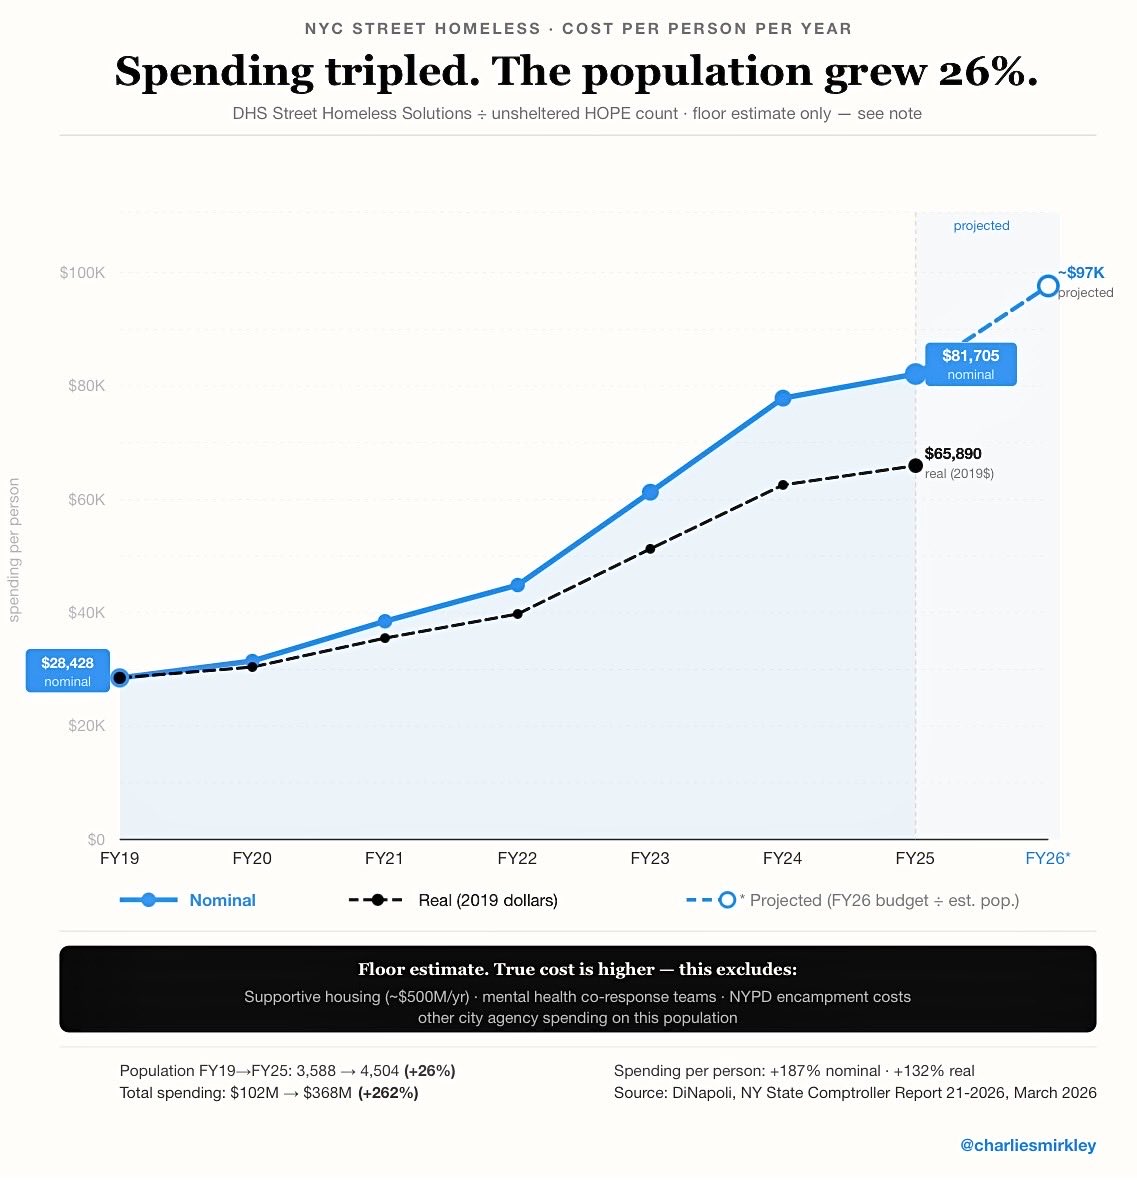
Spending per homeless person since 2019:
NYC +187%, SF +190%, PDX +430%, LA +480%. Average: +320

Floor estimates.

Homeless pop over same period: +13%

Spending up ~320%. Problem up ~13%. Homeless spending since 2019 has surged.
Feb 16 6 tweets 2 min read
GSS data on politics by ancestral origin, grouped into “Heritage American” tiers among early Euro settlers/immigrants + all others:

A: English, Scottish, German, Dutch
B: French, Scandi, Swiss, Austrian, Belgian
C: Italian, Irish, Polish, Czech, Hungarian, Russian
D: All others heritage Americans and Politics and Party ID 
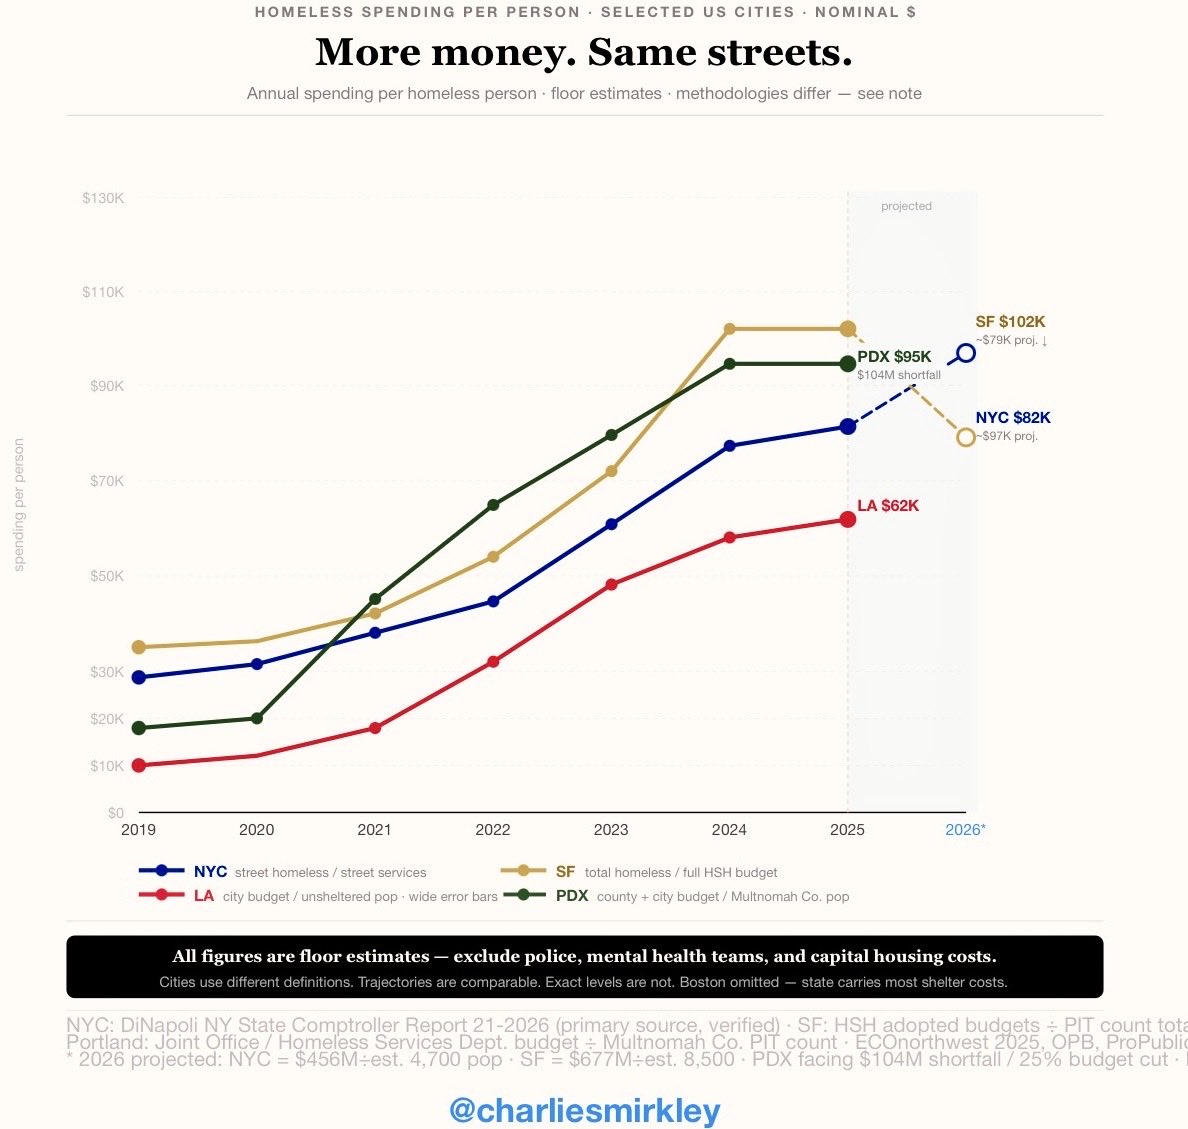
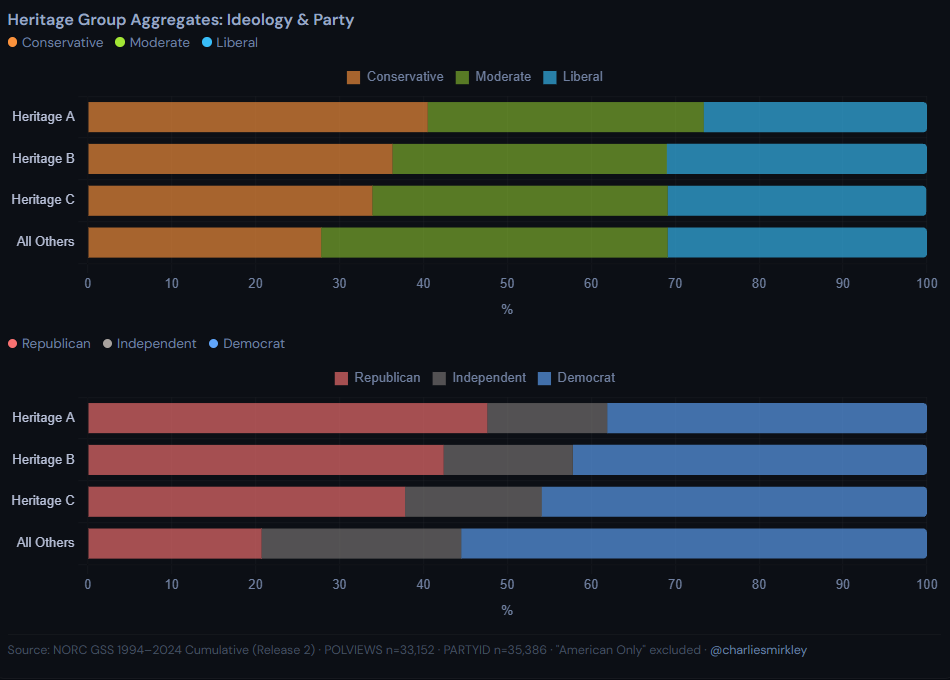
Not only are heritage Americans the most conservative, but individually the Dutch, English, Germans, and Scots are the most conservative.

Note where the natural conservative Indians are: second last. Conservative, moderate, and liberal by ethnicity
Jul 8, 2025 8 tweets 2 min read
You will not believe these charts on male youth crime in Germany by nationality. (If a group isn't included in a chart, it's because the data was N/A.)

1. Algerian male juveniles are 50.52 times more likely to be suspects in Street Crime than Germans. Algerian youth are 50.52 times more likely to be suspects in Street Crime than German 
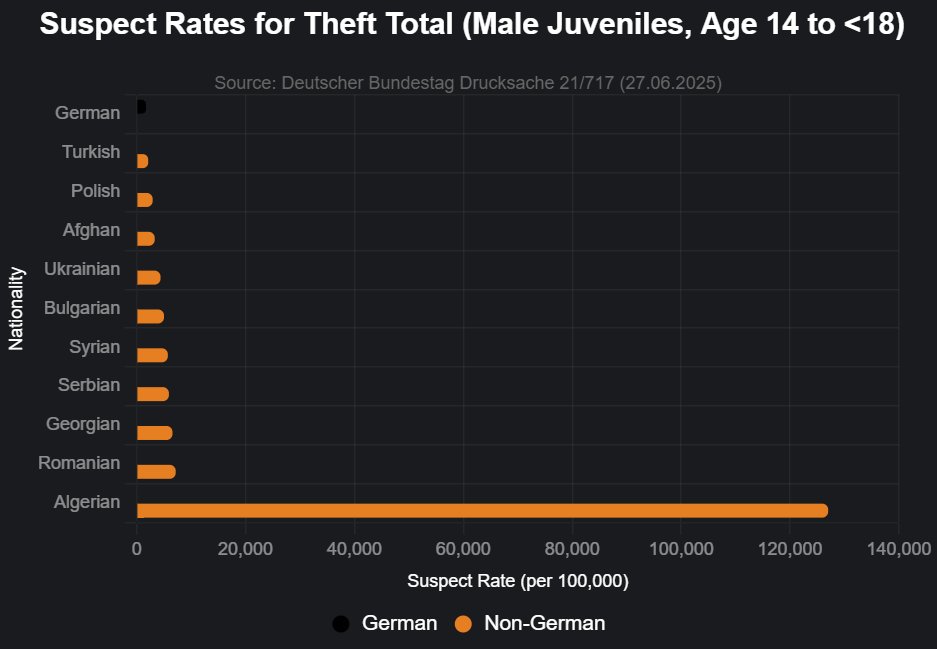
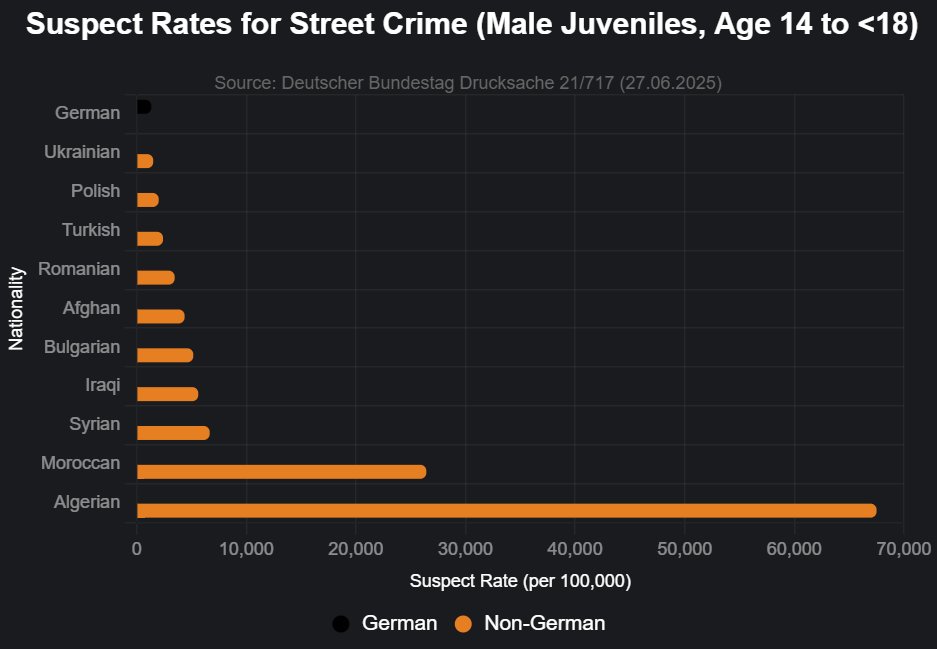
2. Algerian male juveniles are 73.54 times more likely to be suspects in theft crime than Germans. Algerian male youth are 73.54 times more likely to be suspects in theft crime than Germans.