Firstly this is not a good news forecast that I like to post for Iberia but because I am committed to not posting only tantalizing forecasts the month of December shows drier conditions for SW Europe into January but there is another good news also for Iberia is the late winter is possibly going to be wet to very wet for Iberia as far as my winter forecasts are accurate ( hopefully) . The drier and colder anomalies in this analysis may imply snow 🧊❄️ as I will elaborate later in the forecast .
The analog composites reveal a dominant 500 hPa trough over the Urals–Western Russia, with a weakened Atlantic sector and southward-shifted jet — a setup that favors cold ❄️ Eurasian advection and East Mediterranean cyclogenesis.
🔹 Main Synoptic Setup
500 hPa: Deep negative height anomaly over the Urals, extending southwest toward the Black Sea.
MSLP: Broad low-pressure field from Eastern Europe to Turkey; higher pressure near the North Atlantic and Iberia.
Thermal field: Strong cold anomalies 🧊 across Eastern Europe, the Balkans 🧊, and the Black Sea, gradually moderating westward.
Precipitation: Dry west, wet east — typical downstream response to the Urals trough.
🌦️ Regional Highlights
Azores & Iberia: Dominated by subsidence and weak Atlantic inflow → dry and slightly cool with possible snow for Iberian Peninsula central and North regions , dry rainfall anomalies does not imply no snow because water melted snow equivalence is not included in this analysis for rainfall in particular and does not account for possible short runs of flood risk.
South-Central Europe: Occasional intrusions of continental air → cool, mostly dry with rainy spills for Morocco and S Spain Gibraltar regions and NE regions of Spain.
Black Sea & Balkans and Anatolia: Cold pool and increased cloudiness → higher chance of snowfall episodes.
Eastern Mediterranean & Levant: Frequent low-pressure development under the upper trough → wet and stormy, with below-normal temperatures for East Turkey, Greece, Levantine shores and inner lands.
Urals–W Russia: Core of cyclonic anomaly → coldest region, with stable Arctic air persistence and possible snow advance to W Europe and South.
North Sea–Scandinavia: Near-neutral anomalies; occasional spillover cold but reduced storm activity.
Please see the threaded comments for teleconnectivity anomalies breakdown and their interpretation .
If you are a farmer or agribusiness inclined : use this analysis outlooks as interim view for your decision making particularly for Iberia and couple it with analyses from other deterministic numerical weather prediction models , drier spell may continue between December and January but second half of winter is possible wetter for Iberia as I hope.
See the comments for embedded thread interpretation of climatic teleconnectivity.
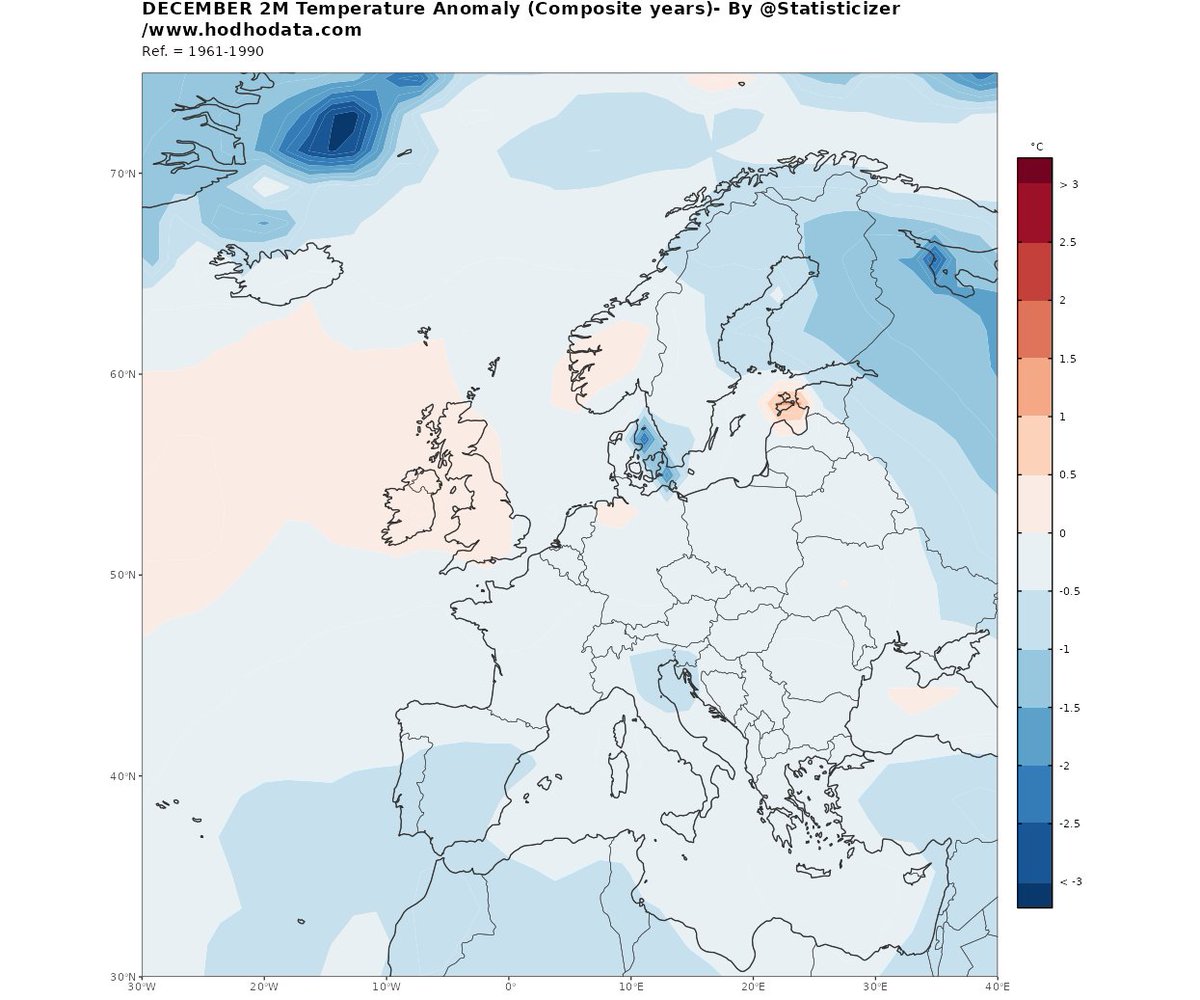
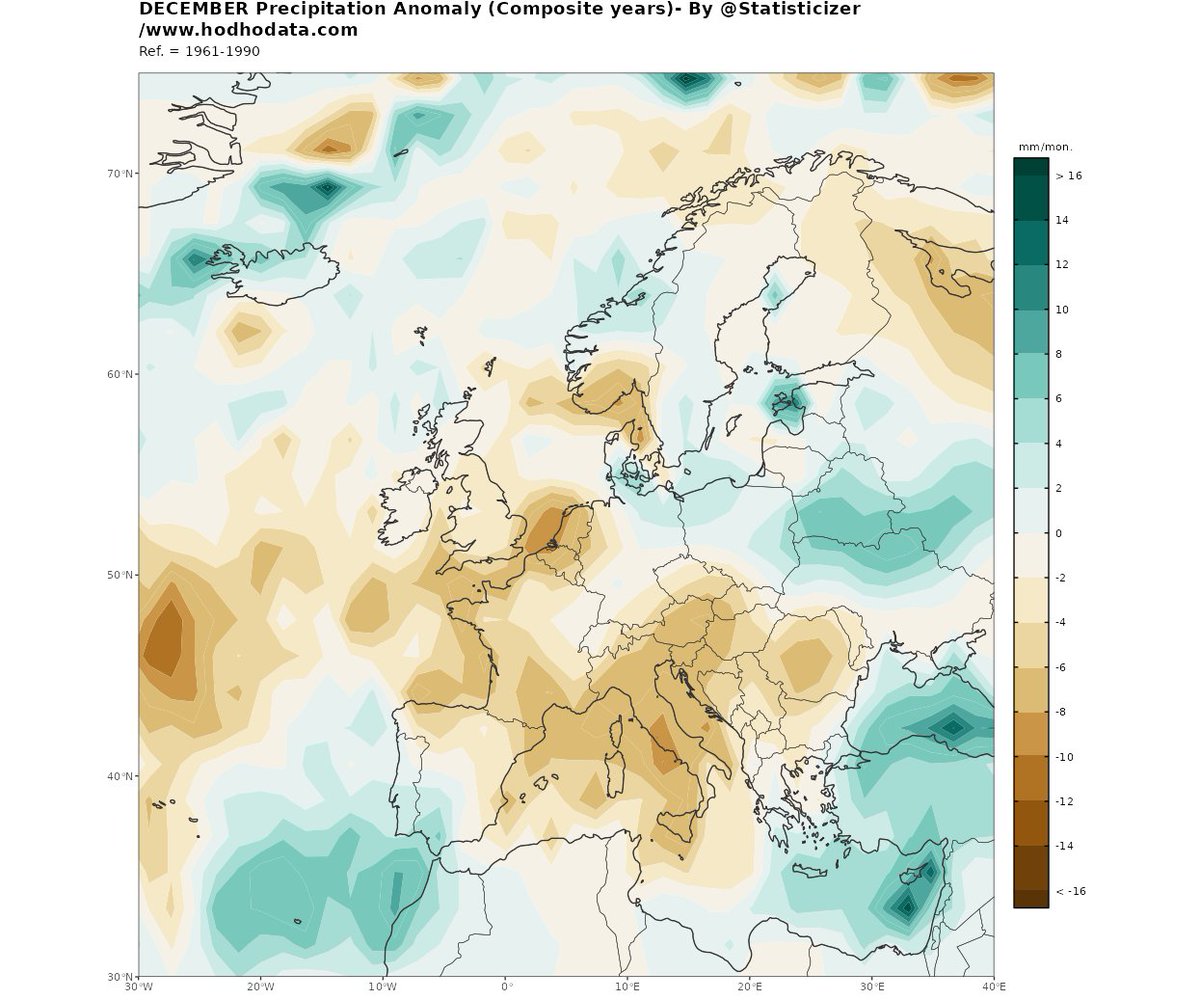
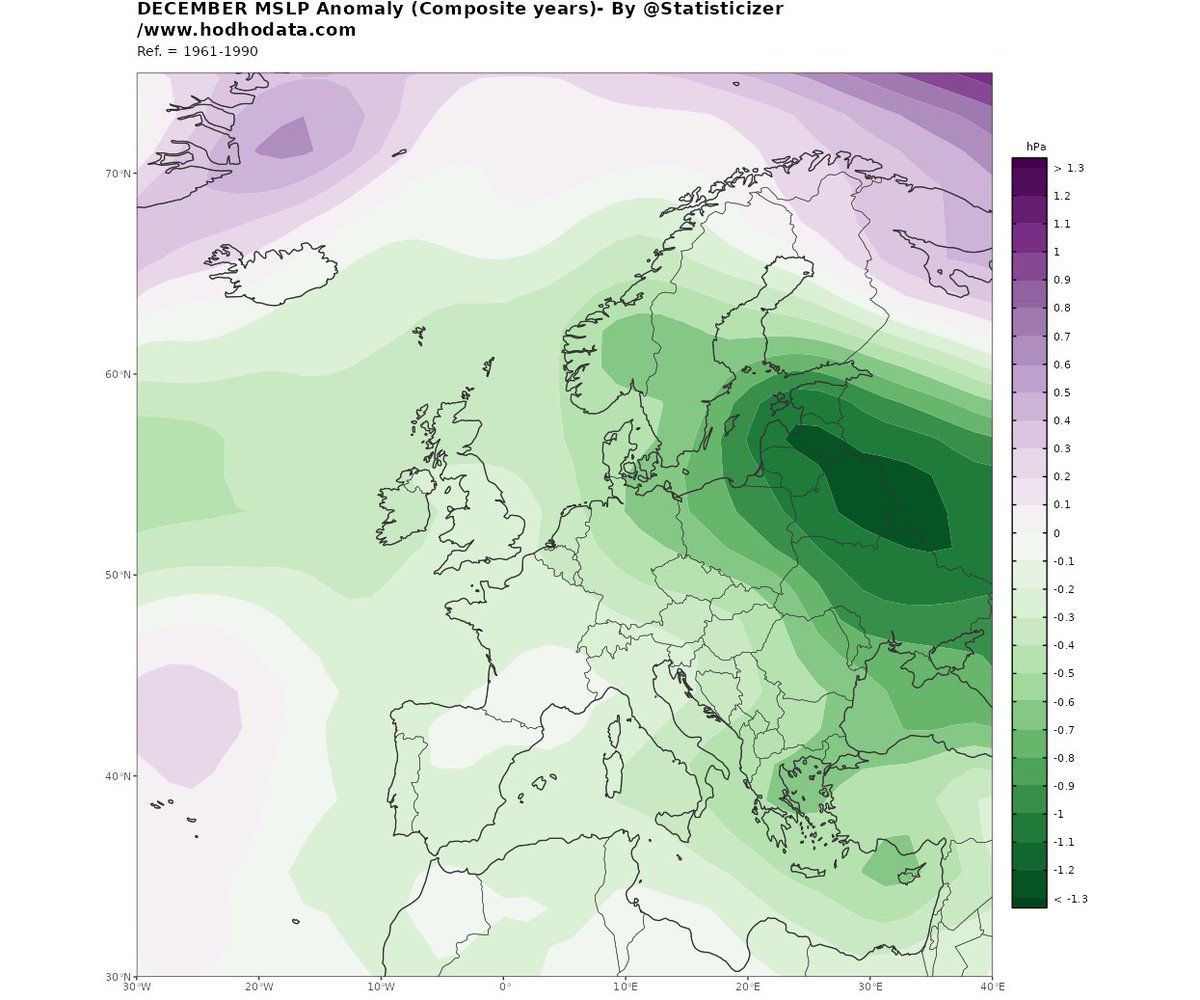
This is an AI summary for climatic teleconnectivity patterns for December. Use these information as a general qualitative guideline along with NWP models views as we delve closer to December. I will be posting more weekly based composites for the same regions as I can when we are near December. Store rainfall water if you can from November. Southern Atlantic storm track is likely for DECEMBER.
Oct 4 • 6 tweets • 4 min read
🔴🌋⚠️ Probabilistic #Volcanic Outlook — October to November 2025 .
Based on ongoing space-weather and planetary geometry analyses, there appears to be an increased likelihood of a major volcanic eruption between 20 October and 15 November 2025 (± 4 days).
During early November 2025, the planets Venus, Mercury, Jupiter, Saturn, and Neptune form a non-linear geometric alignment involving the Sun. Although Earth is not directly aligned with these bodies, such large-scale configurations have shown strong statistical associations with heightened solar-magnetospheric activity and, in several past analogs, with major volcanic or seismic events.
This configuration represents what I classify as a non-linear Solar-System Geometric Index (SSGI) peak, where distant outer planets (notably Neptune and Saturn) may influence the system’s overall magnetic and energetic balance.
Historically, similar geometric patterns have coincided with volcanic eruptions of VEI ≥ 3, producing ash columns rising 7–12 km into the atmosphere. It’s important to emphasize that this outlook is probabilistic, not deterministic. It is based on observational analogs and statistical correlations, not direct cause-and-effect proof. The analysis draws from multi-century datasets (≈ 200 years) combining planetary geometry, space-weather variability, and global volcanic records. For now, this remains an exploratory forecast.
The goal is to test whether planetary-geometric and space-weather indicators can help anticipate periods of increased volcanic probability. Active regions along the Pacific “Ring of Fire” and other well-known volcanic belts remain the most likely locations.
⚠️🟠 Let’s observe this period carefully and later evaluate how well the data-based model performs. If the forecast proves valid, it may open the door for regional, shorter-range analog indices for volcanic and seismic monitoring.
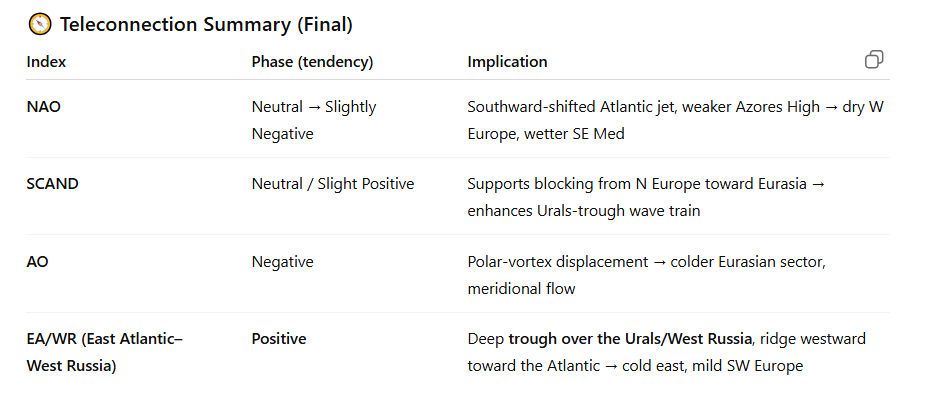
بالعربية : 🌋 النظرة الاحتمالية للنشاط البركاني — من أكتوبر إلى نوفمبر 2025
استنادًا إلى التحليلات المستمرة للأحوال الفضائية (الطقس الفضائي) والهندسة الكوكبية في النظام الشمسي، تشير النتائج إلى احتمال متزايد لحدوث ثوران بركاني كبير خلال الفترة ما بين 20 أكتوبر و15 نوفمبر 2025 (±4 أيام).
في بداية نوفمبر 2025، ستصطف الكواكب الزهرة، عطارد، المشتري، زحل، ونبتون في تشكيل هندسي غير خطي يشمل الشمس. وعلى الرغم من أن الأرض ليست في خط مباشر مع هذه الأجسام، إلا أن مثل هذه الترتيبات الهندسية واسعة النطاق أظهرت ارتباطات إحصائية قوية مع نشاط مغناطيسي شمسي متزايد، وفي عدد من الحالات المشابهة تاريخيًا، مع نشاط زلزالي أو بركاني كبير.
يمثل هذا التكوين ما أُصنّفه على أنه ذروة في المؤشر الهندسي غير الخطي للنظام الشمسي (SSGI)، حيث يمكن للكواكب الخارجية البعيدة — خصوصًا نبتون وزحل — أن تؤثر على التوازن المغناطيسي والطاقة العامة للنظام الشمسي.
تاريخيًا، تزامنت أنماط هندسية مشابهة مع ثورانات بركانية بقوة انفجارية (VEI ≥ 3)، مطلقةً أعمدة رماد وصلت إلى ارتفاع 7–12 كيلومترًا في الغلاف الجوي.
من المهم التأكيد على أن هذه النظرة احتمالية وليست حتمية، فهي مبنية على تشابهات رصدية وارتباطات إحصائية، لا على إثبات سببي مباشر.
يعتمد التحليل على سلاسل بيانات تمتد لنحو قرنين من الزمن (حوالي 200 عام)، تجمع بين الهندسة الكوكبية، وتغيرات الطقس الفضائي، والسجلات البركانية العالمية.
في الوقت الحالي، يُعتبر هذا التنبؤ استكشافيًا وتجريبيًا، والهدف منه هو اختبار ما إذا كانت المؤشرات الهندسية الكوكبية والفضائية يمكن أن تساعد في تقدير فترات ارتفاع احتمالية النشاط البركاني.
وتظل مناطق النشاط البركاني النشط مثل حزام النار في المحيط الهادئ والمناطق المعروفة الأخرى الأكثر عرضة لحدوث مثل هذه الظواهر.
فلنراقب هذه الفترة بعناية، ولنقيّم لاحقًا مدى دقة أداء النموذج الإحصائي المستند إلى البيانات.
وإذا ثبتت صحة هذا التنبؤ، فقد يفتح الباب لتطوير مؤشرات إقليمية قصيرة المدى لمراقبة النشاطين البركاني والزلزالي مستقبلًا.