See LinkedIn for new content. Meta-researcher working to improve transparency & reproducibility. Data visualization. Open & reusable methods.


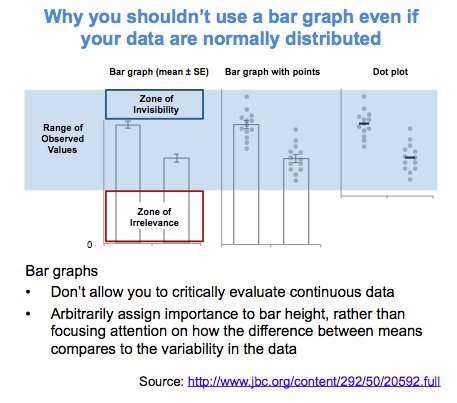
 “Can I still use a bar graph if my data are normally distributed?”
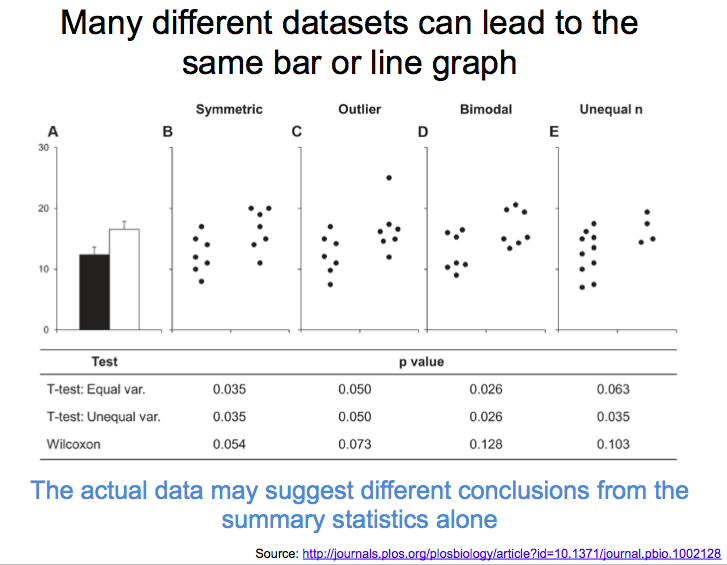
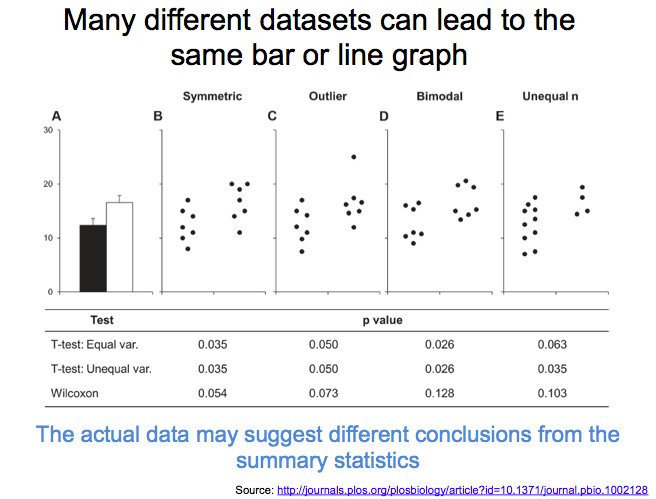
 “Can I still use a bar graph if my data are normally distributed?”
 “Can I still use a bar graph if my data are normally distributed?”