
💪 Master the Python Data Science Ecosystem 💪
🕴️Founder of Dunder Data
📚Author of multiple books
💻Developer of Dexplot
https://t.co/QSRQLcRY0g
 These are the people that destroyed our lives, our childrens lives with most devastation to the poorest. There is an extremely strong relationship to poverty and death in covid (in the US and the world). All from the comfort of their home, wearing a mask 30 minutes a week.
 Links:

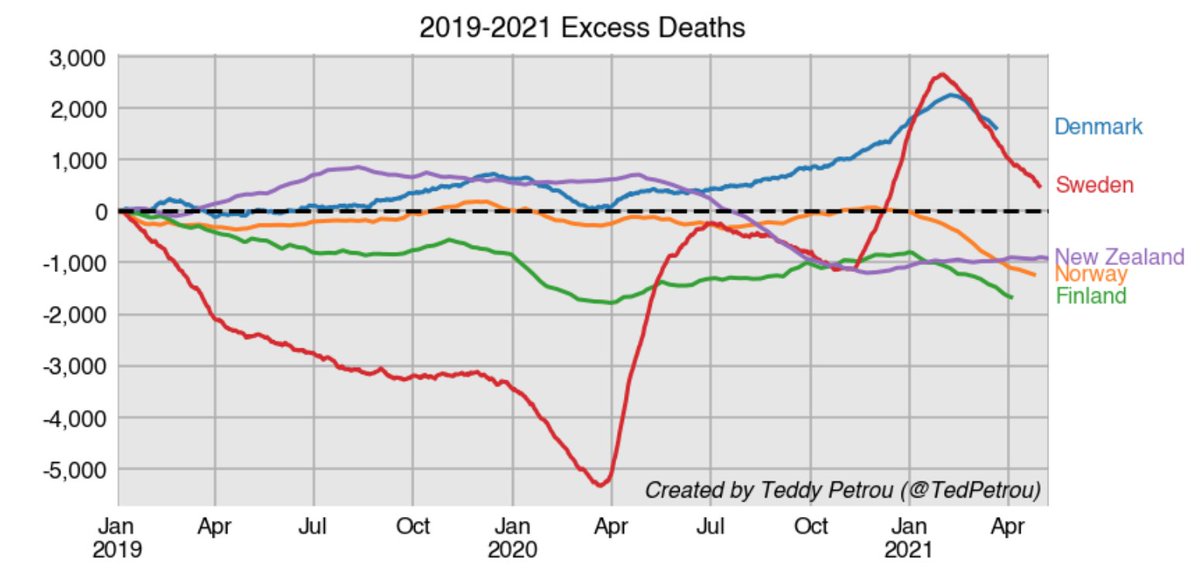 The most striking feature of the above graph is the remarkably different path that Sweden took the last 2.5 years. It's closing in on 0 total excess, which is what we would expect for an accurate model.
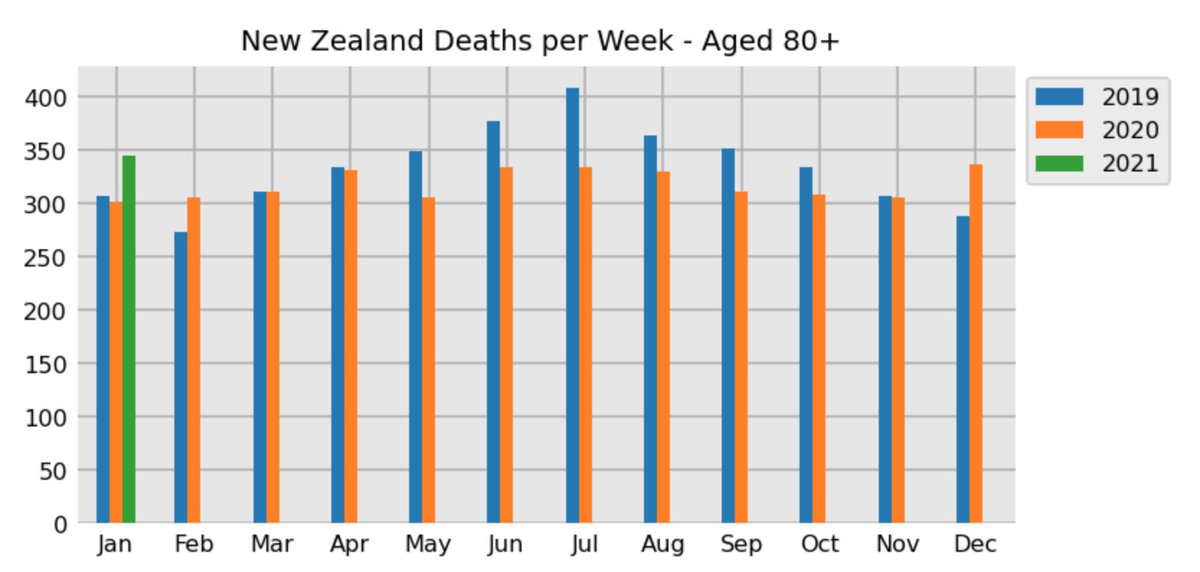 NZ was praised routinely by the media as a country that prevented covid. It is absolutely true that they prevented deaths from covid as well as overall deaths in their elderly. 2020 winter elderly mortality rates were historically low.
 Overall death numbers are meaningless without stratifying by age. Below, we have mortality rates from 2011-2020 by age groups 0-64, 65-79, 80-89, and 90+.
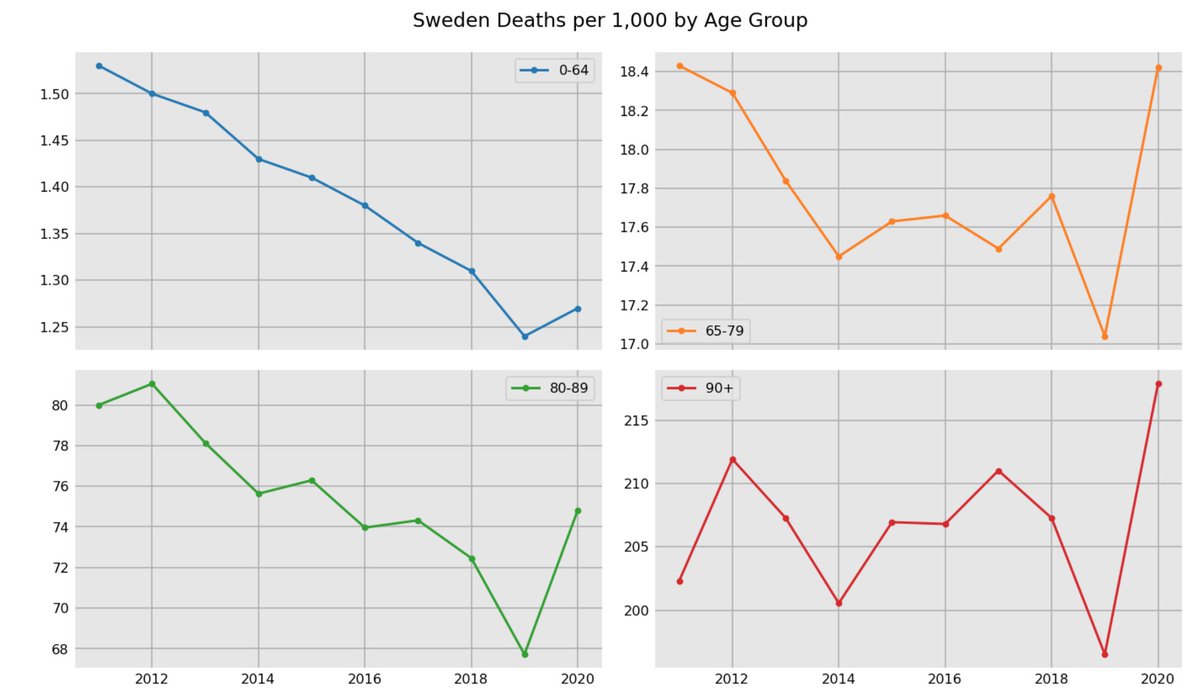
 Overall death numbers are meaningless without stratifying by age. Below, we have mortality rates from 2015-2020 by age groups 0-64, 65-79, 80-89, and 90+. The 65-79 group fared worst with ~3% inc. over 2015-18 average.
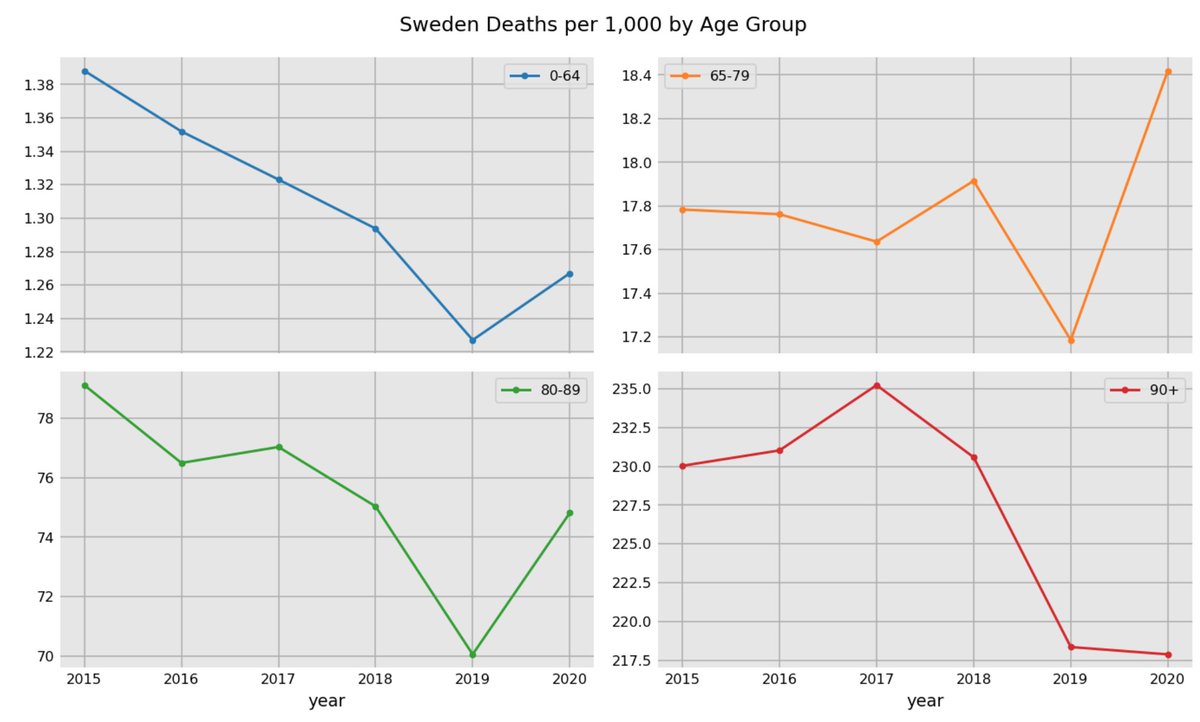
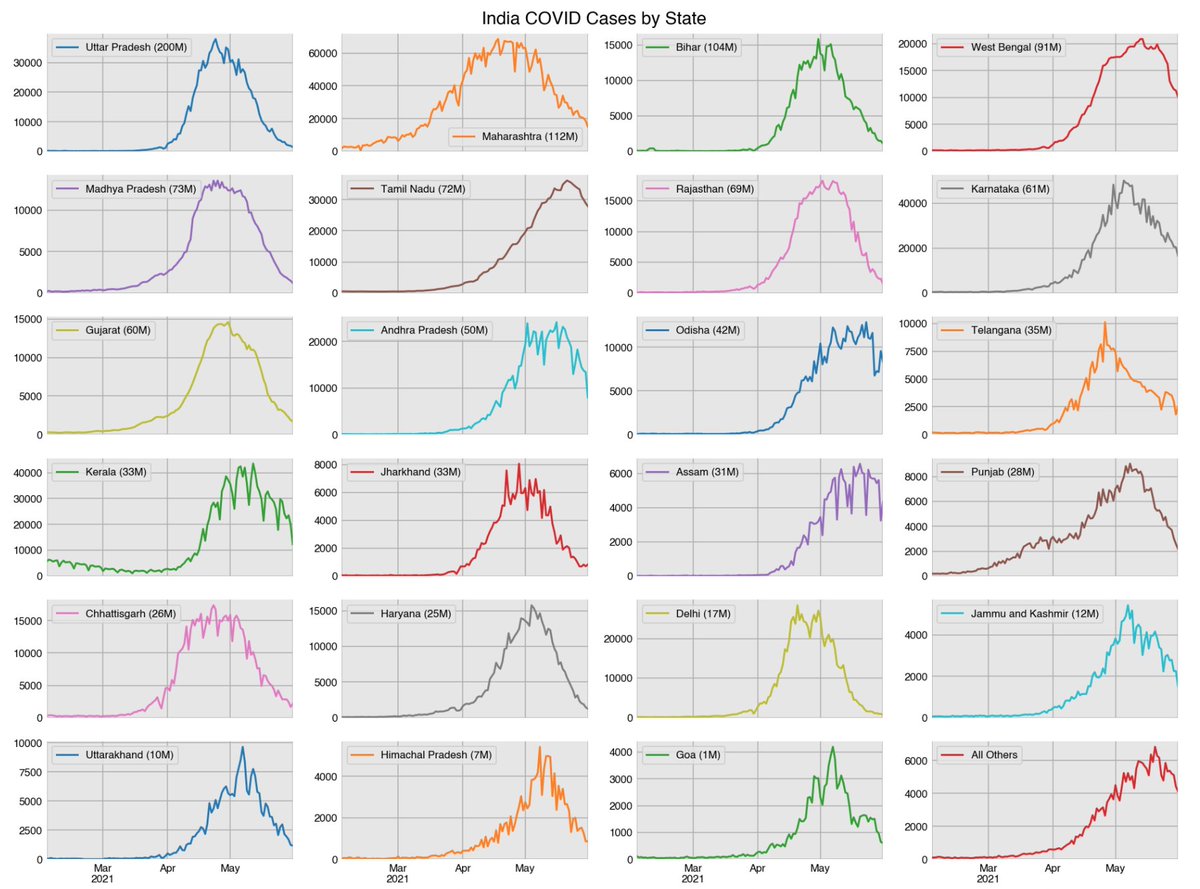
 Nearly all Indian states have seen drops in cases/deaths of 80-90% from their peak. Below, we have the 15 largest Indian states with the final graph an aggregate of all others.

 Data is directly from Statistics Sweden - scb.se/en
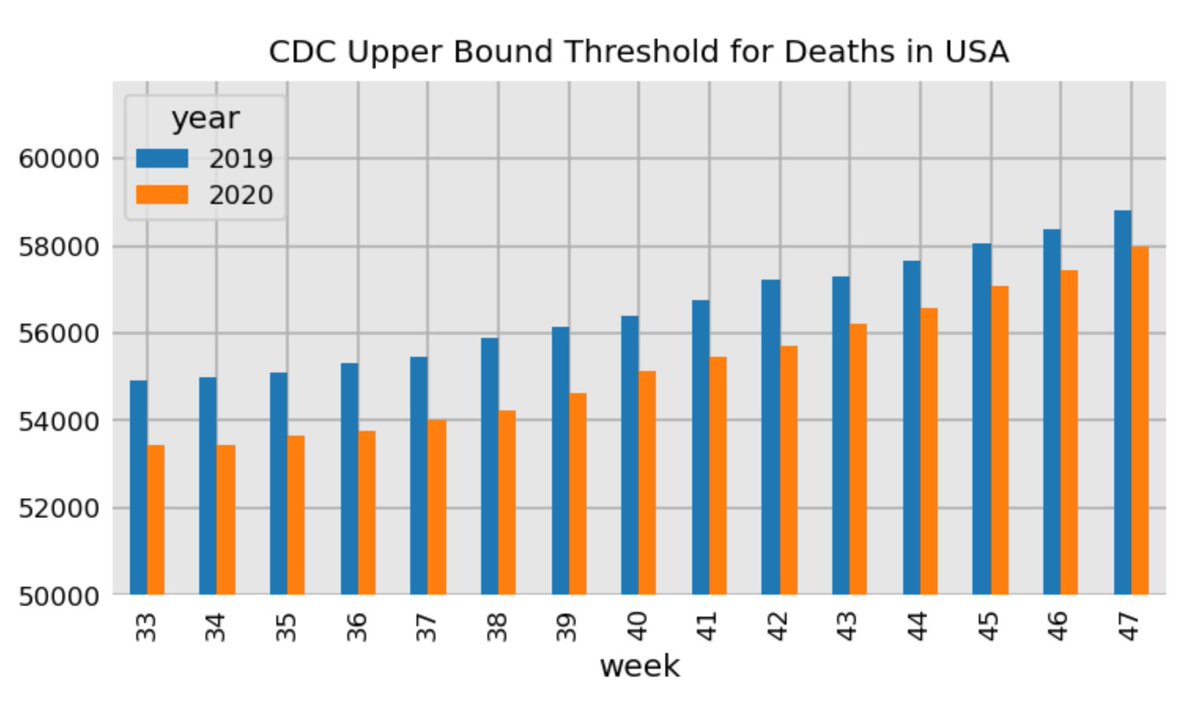 For those who want an explanation. The CDC uses this chart to estimate excess deaths, but the upper bound threshold in 2020 is 2.3% lower than it was for 2019. US population is growing.
 Using a screen ruler program (Onde Rulers) it actually measures as 2.2 x .98 "screen inches" on my screen and 324 x 144 pixels