Teddy Vallee Profile picture
Macro
Orderflowtradr Profile picture the_login Profile picture 2 subscribed
Sep 4, 2022 8 tweets 3 min read
. @EPBResearch coincident employment index just went negative [payrolls, u3, hours worked, etc].

Employment the most lagging indicator (ex inflation) and fading pretty fast.

Confirmed by full time employment (-ve 3mos in a row), as well as daily treasury wage withholding data. Wage withholding data below:
Jun 20, 2022 6 tweets 2 min read
% of $SPX members above 50d sub 2%.

LeFaceRip# Net leverage back to '09 via MS
Mar 15, 2022 9 tweets 3 min read
Finishing up my quarterly letter, but a couple off thoughts off the top:

Move in rates and equites (tech) largely played out nicely as we outlined in our last quarterly below.


1/x
Unfortunately for the Fed, their focus on the unemployment rate was an analytical error, which is forcing them to play catch up at a time that economic growth is likely to slow. Note our leads below.

2/x Image
Mar 9, 2021 12 tweets 4 min read
Thread on our recent piece (Unintended Consequences), which we sent out to our network last month:
1/n
We think there are large unintended consequences of the most recent fiscal and monetary policy -- primarily in the form of a 12% nominal GDP print -- which has significant implications for the bond market.
2/n
Jan 9, 2020 11 tweets 3 min read
Some internals to pay attention to: $XME / $SPY through the lows
Dec 9, 2019 9 tweets 3 min read
US retail sales coming up this week. Credit card data showing further weakness. Ladies - what's going on here? Cosmetics YoY
Nov 6, 2019 8 tweets 2 min read
We’re launching an institutional research product next week, but we thought this was too interesting to not share right now. First edition will be public so you can read more. Last week we saw the largest divergence between China’s Caixin PMI & official PMI, as Caixin new orders ripped. We know that Caixin is primarily small/mid-sized businesses (500 cos) on the eastern border dependent on trade, while official measures 3000 co’s across all of China.
Sep 6, 2019 8 tweets 2 min read
Some charts on semis: We can see semi's EPS coming down even further into year end. There's ~ a 13% spread between our estimates and the street.
Aug 28, 2019 11 tweets 3 min read
Some charts on relative performance confirming out leads. US chemicals / $SPX -- new lows
Apr 25, 2019 11 tweets 4 min read
Equities are largely pricing in a recovery in China leading to a pick up in global growth, as shown below by the correlation between China's PMI and $SPX YoY. The same is true for global equities, as shown below. $ACWI
Apr 6, 2019 9 tweets 3 min read
Unless it's different this time (open to it), data behind why we think China still has a ways to go: China Real M1 vs. Li Keiqang YoY
Apr 1, 2019 7 tweets 4 min read
PMI breakdowns: Taiwan - less bad. Optimistic about the future. Weakness from exports markets.
Nov 8, 2018 6 tweets 2 min read
Couple charts on rates diverging from other mkts: $KRE / $SPY vs. $US10YR
Dec 30, 2017 4 tweets 2 min read
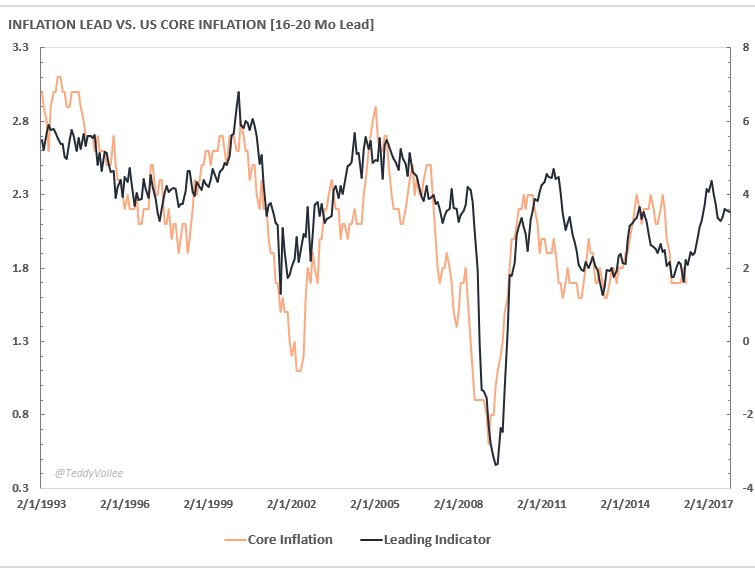
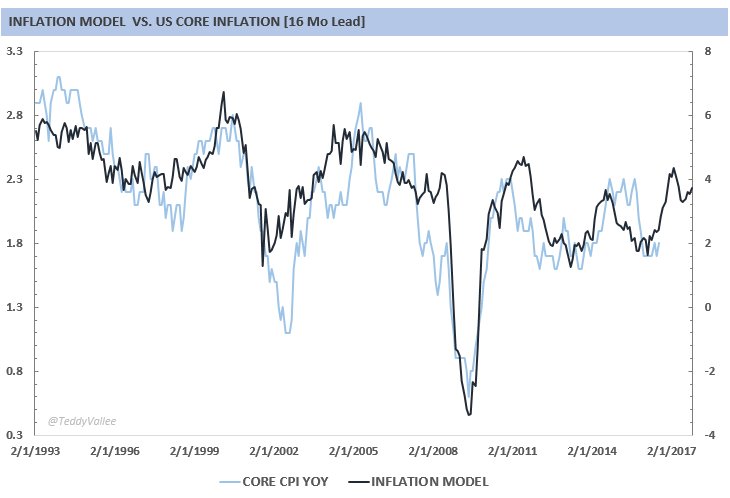
New inflation indicator I just built out [16-20mo lead]. Incorporates consumer & industrial demand, as well as supply. Reflation# Giddy up