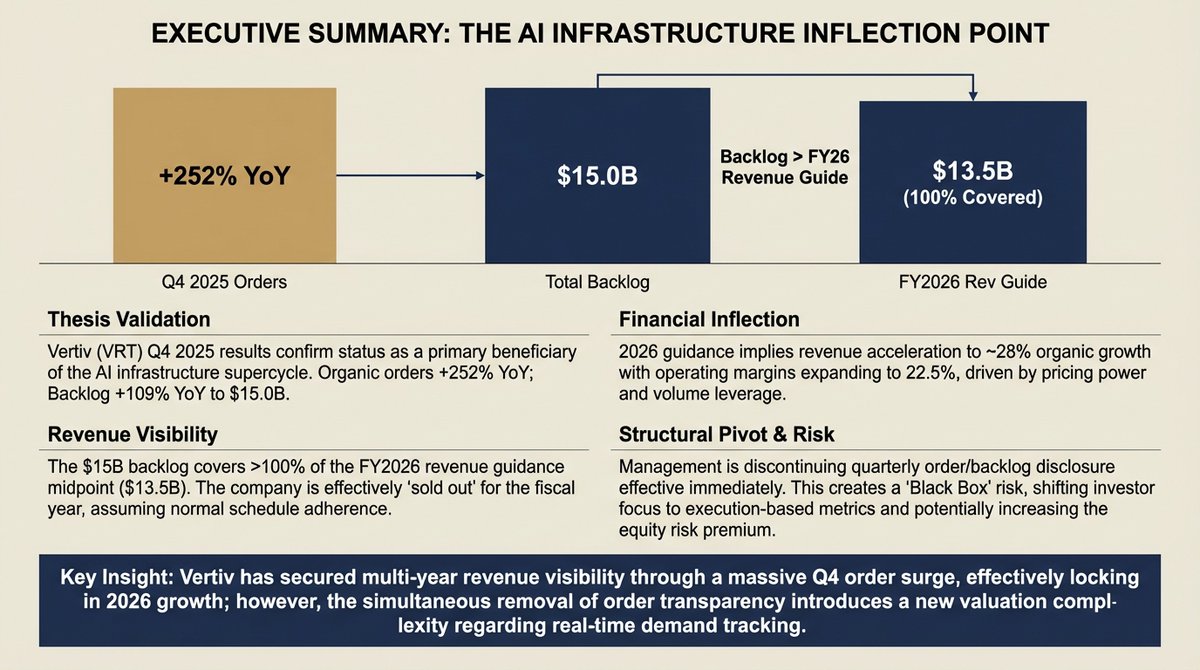
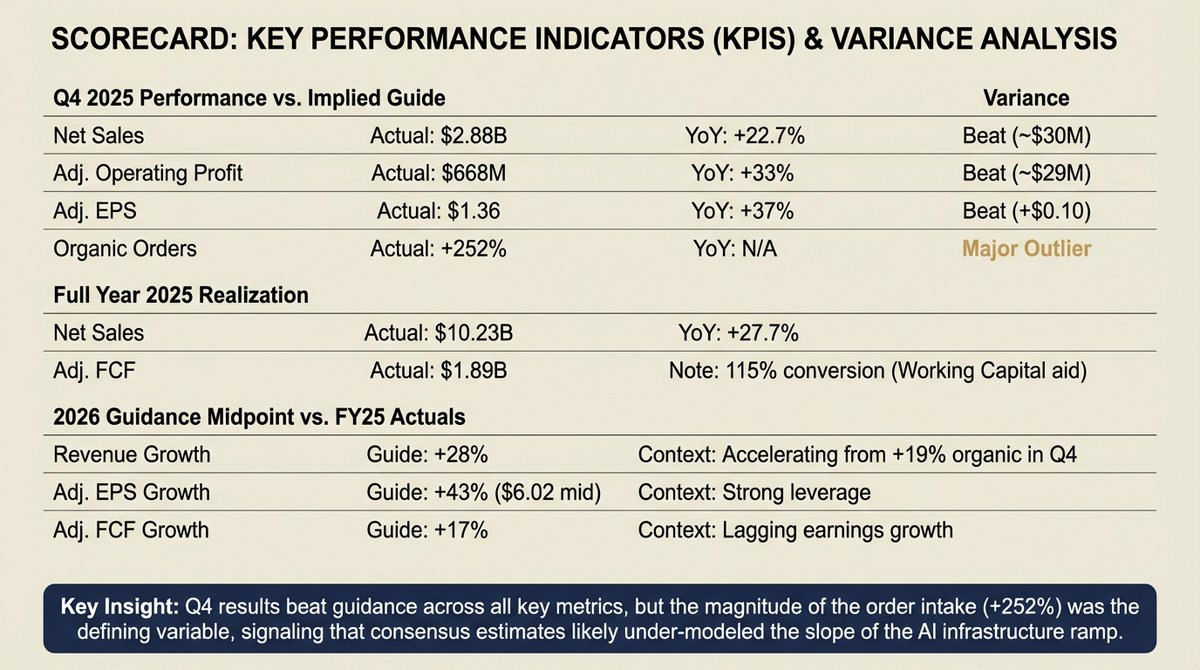
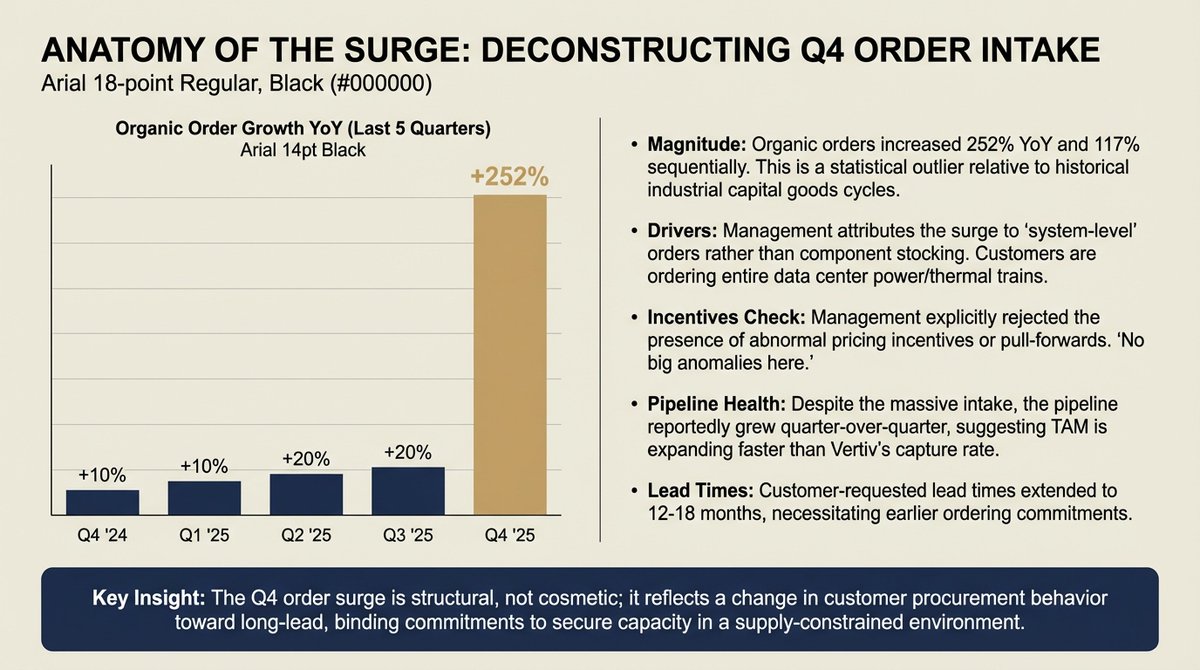
Fourth quarter 2025 results reinforced a sharp re-acceleration in demand indicators, led by a step-change in orders and backlog, while reported revenue growth remained constrained by delivery capacity and regional weakness outside the Americas. Management framed the quarter as validation of multi-year investments in capacity, engineering, and customer engagement, with an explicit emphasis on AI-driven data center infrastructure as the dominant end-market driver. Organic orders increased 252% year-over-year and 117% sequentially, producing a 2.9x book-to-bill and expanding backlog to approximately $15.0B, up 109% year-over-year and up 57% sequentially. Fourth quarter organic net sales increased 19% year-over-year, adjusted operating margin expanded 170 bps year-over-year to 23.2%, adjusted diluted EPS increased 37% year-over-year to $1.36, and adjusted free cash flow increased 151% year-over-year to $910M. Full year 2025 adjusted diluted EPS increased 47% to $4.20 and adjusted free cash flow increased 66% to $1.887B, implying 115% adjusted free cash flow conversion. Financial figures and guidance ranges referenced below are from Vertiv’s Fourth Quarter 2025 Results presentation dated 02/11/26.
Management guidance for 2026 implied another step-up year in scale and profitability, with organic net sales growth of 27% to 29% (midpoint 28%), adjusted operating margin of 22.0% to 23.0% (midpoint 22.5%), adjusted diluted EPS of $5.97 to $6.07 (midpoint $6.02, +43% vs 2025), and adjusted free cash flow of $2.1B to $2.3B (midpoint $2.2B, +17% vs 2025). First quarter 2026 guidance called for $2.5B to $2.7B of net sales (midpoint $2.6B; 22% organic growth), adjusted operating margin of 18.5% to 19.5% (midpoint 19.0%), and adjusted diluted EPS of $0.95 to $1.01 (midpoint $0.98; +53% year-over-year). The call also introduced a major disclosure policy change: quarterly reporting of actual orders, orders forecasts, and backlog will be discontinued, with management asserting that order lumpiness generates volatility that is not representative of underlying performance.
Key call elements with direct investment relevance included: 1) exceptionally strong orders and backlog expansion, paired with commentary that the pipeline continued to grow even after the large fourth quarter intake; 2) explicit confirmation that backlog reflects binding purchase orders; 3) stated customer-requested delivery lead times of 12 to 18 months for larger orders, implying that the late-2025 order surge likely extends revenue visibility into 2027; 4) guidance that embeds continued price-cost favorability and incremental margin performance while increasing growth investment, including capex stepping up to 3% to 4% of sales in 2026; and 5) a cash flow profile materially aided by advance payments associated with large orders, with 2026 guidance assuming less working-capital benefit than 2025 and meaningfully higher cash taxes.
CALL HIGHLIGHTS AND MANAGEMENT MESSAGING
Tone and messaging were unambiguously confident on demand durability and competitive positioning. The Executive Chairman emphasized a multi-year strategy payoff and framed AI infrastructure as an early-cycle secular build. A representative statement was: “The AI-driven infrastructure build-out is accelerating, and data centers are at the center of it all. We’re still in the early innings of this secular growth trend.” Management repeatedly linked order magnitude to customer trust in Vertiv’s ability to deliver at scale and to rising adoption of “system-level” solutions rather than discrete components.
A particularly consequential message for market structure and investor expectations was the decision to cease quarterly orders and backlog disclosure. Management’s stated rationale was that order lumpiness “can generate unnecessary volatility” and that quarterly disclosure “is not representative of the sustained performance of the company and is not beneficial to our investors.” This change increases the burden of proof on revenue conversion, pricing, and margin execution as the observable proxies for demand, and it reduces external ability to detect real-time turning points in the order cycle.
QUARTER PERFORMANCE AND QUALITY OF RESULTS
Top-line performance in fourth quarter 2025 reflected strong conversion in the Americas and mixed regional execution elsewhere. Net sales were $2.880B, up 22.7% year-over-year and up 7.6% sequentially. Organic net sales were up 19.3% year-over-year. By segment, Americas net sales were $1.886B, up 50.2% year-over-year (46.2% organic); APAC net sales were $492M, down 9.6% year-over-year (9.3% organic); and EMEA net sales were $502M, down 8.2% year-over-year (14.1% organic). Sequentially, Americas increased from $1.712B to $1.886B (+10%), EMEA increased from $444M to $502M (+13%), and APAC declined from $520M to $492M (approximately 5% decline), indicating that quarter-to-quarter volatility remained meaningfully regional.
Profitability was driven by volume leverage, productivity, and price-cost. Adjusted operating profit was $668M, up 33% year-over-year, and adjusted operating margin expanded to 23.2% from 21.5% in fourth quarter 2024 (+170 bps). The implied year-over-year incremental margin was approximately 31%, consistent with management’s stated incremental margin for the quarter. Management described “strong operational leverage on higher volumes, productivity gains, and favorable price-cost execution,” and noted that tariff impacts partially offset the margin expansion. This combination suggests that the quarter’s margin strength was not purely mix-driven and, importantly, was achieved while continuing to invest in capacity and engineering.
Adjusted diluted EPS was $1.36 versus $0.99 in fourth quarter 2024 (+37%). GAAP diluted EPS was $1.14. The quarter’s adjusted outperformance was explicitly framed as above guidance, with management stating adjusted diluted EPS was “$0.10 above our prior guidance” and adjusted operating profit was “$29M higher than prior guidance.” The presentation implies a prior guidance midpoint of approximately $1.26 for adjusted diluted EPS (given a $0.10 beat), $2.85B for net sales (given $30M above guidance), $639M for adjusted operating profit (given $29M above guidance), and approximately 22.4% for adjusted operating margin (given 80 bps above guidance).
Cash generation in fourth quarter 2025 was unusually strong and was directly linked to both profitability and working-capital inflows. Adjusted free cash flow was $910M versus $362M in fourth quarter 2024 (+151%). Management attributed this to higher operating profit and “working capital efficiency,” with a specific callout that “The larger orders in the quarter came with corresponding larger advanced payments, which benefited our Q4 cash-flow.” This characterization supports a view that cash performance reflected both structural leverage (profit growth) and a potentially timing-sensitive working-capital tailwind (advance payments), which should be treated as a key variable in modeling and risk management.
HISTORICAL CONTEXT AND TREND COMPARISONS
The fourth quarter extended a multi-quarter trajectory of both sales growth and rising adjusted operating margins, albeit with notable seasonality and regional dispersion. From first quarter 2024 through fourth quarter 2025, total net sales increased from $1.639B to $2.880B. Adjusted operating margin increased from 15.2% in first quarter 2024 to 23.2% in fourth quarter 2025, with the strongest margin expansion occurring in the second half of 2025 (22.3% in third quarter 2025 and 23.2% in fourth quarter 2025). This pattern indicates both operating leverage and productivity gains scaling meaningfully as volumes rise, with the Americas segment becoming increasingly dominant in profit contribution.
Segment-level historical comparisons highlighted: 1) Americas adjusted operating margin reached 30.1% in fourth quarter 2025, up from 25.6% in fourth quarter 2024 and 29.3% in third quarter 2025, consistent with scale benefits and strong price-cost; 2) APAC adjusted operating margin declined to 9.9% in fourth quarter 2025 from 12.6% in fourth quarter 2024 and 13.2% in third quarter 2025, consistent with volume deleverage and China-driven weakness; 3) EMEA adjusted operating margin declined to 22.1% from 26.6% year-over-year but improved from 18.8% sequentially, aligning with management’s commentary that sequential margin improved as anticipated even as year-over-year volume deleverage remained a headwind.
Full year 2025 results provide additional context for the magnitude of the 2026 step-up. Net sales were $10.230B, up 27.7% year-over-year (26.3% organic). Adjusted operating profit was $2.090B, up 35% year-over-year, and adjusted operating margin expanded to 20.4% from 19.4% (+100 bps). Adjusted diluted EPS was $4.20, up 47%. Management stated that full year results exceeded guidance by $0.10 in adjusted EPS and by $30M in net sales, implying a prior guidance midpoint of approximately $4.10 in adjusted EPS and $10.200B in net sales.
DEMAND, ORDERS, BACKLOG, AND VISIBILITY
The defining feature of the call was the divergence between revenue growth (19% organic) and orders/backlog growth (252% organic orders growth; backlog +109% year-over-year), implying a rapid increase in demand capture relative to current delivery capacity. Management repeatedly framed this as customer confidence in Vertiv’s ability to execute at scale and a shift toward larger, more integrated system-level orders.
Key quantitative demand indicators cited:
Fourth quarter organic orders: +252% year-over-year; +117% sequentially.
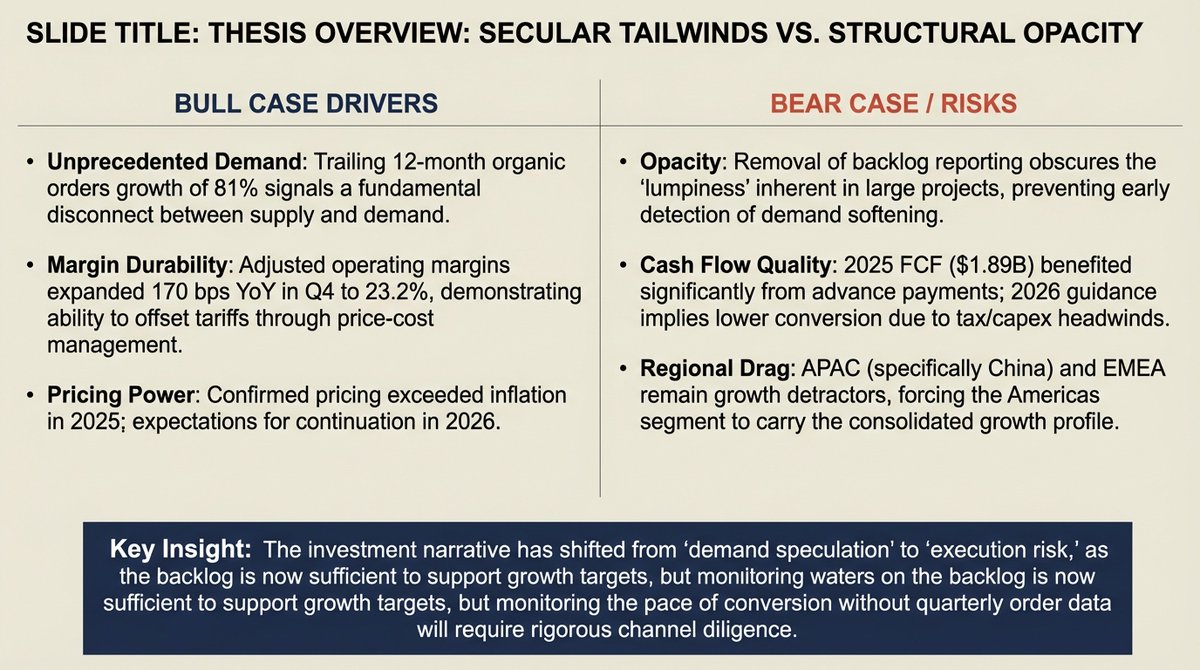
Trailing 12-month organic orders growth: 81%.
Book-to-bill: 2.9x.
Backlog: approximately $15.0B, up 109% year-over-year and up 57% sequentially.
Management provided two critical qualitative clarifications about the backlog:
Backlog consists of binding purchase orders. As stated: “Everything backlog… is a binding purchase order.”
The backlog has become more elongated into a 12 to 18-month delivery window, consistent with large-project phasing and customer-requested lead times. As stated: “Our customers requested lead-time pretty much ranges from 12 months to 18 months, especially when we talk about the bigger orders.”
This combination supports an interpretation that the late-2025 demand surge is not purely speculative and is likely to carry meaningful conversion into 2026 and 2027. However, the call also reiterated structural order lumpiness and unpredictability, which can cause quarter-to-quarter volatility in order timing and revenue conversion.
A central concern raised by analysts was whether the magnitude of fourth quarter orders reflected anomalous factors (year-end ordering behavior, pricing incentives, or queue positioning). Management explicitly rejected the existence of abnormal incentives, stating: “The answer… from the normal-course of business in terms of price and whatever else, the answer is no… no big anomalies here.” The explanation was instead attributed to the market’s evolving dynamic of larger orders and broader adoption of system-level solutions.
The pipeline discussion was unusually supportive given the scale of fourth quarter orders. Management stated that the pipeline did not deplete and “despite… the very strong order intake… we are seeing the pipeline to grow a quarter-to-quarter.” This comment reduces the probability that fourth quarter represented a one-time pull-forward at the expense of near-term demand, but it does not eliminate the risk that orders normalize from an unusually high base.
The decision to stop quarterly order and backlog reporting is material for valuation and investor confidence. Management’s stated intent was to reduce noise and reflect sustained performance, but the timing (immediately following a historically large order quarter) will likely be interpreted as lowering transparency precisely when cyclicality and conversion risk become most important. This has 2 potential investment impacts: 1) reduced real-time data may increase the equity risk premium demanded by some investors, especially if revenue growth begins to lag expectations; 2) reduced disclosure can dampen near-term volatility if the market increasingly anchors on revenue/margin execution rather than orders.
REGIONAL AND END-MARKET DYNAMICS
Americas remained the primary engine of both revenue and profit, with the call emphasizing that the market is “very strong and accelerating” and that Vertiv is “outpacing market.” Fourth quarter organic sales growth in the Americas was 46.2%, and adjusted operating margin reached 30.1%. For 2026, the company guided to Americas growth in the high 30% range, indicating continued confidence in sustained demand and conversion.
EMEA commentary shifted from softness to improving sentiment and accelerating pipelines, captured by the phrase “the coiled spring is uncoiling.” Revenue remained weak (fourth quarter organic sales down 14.1%), and management cited “data center industry constraints” and permitting-related frictions as persistent issues. The 2026 outlook assumed EMEA net sales “flat to down mid single digits” for the year, with a return to year-over-year sales growth in the second half. This suggests a back-half-weighted European recovery and implies that near-term consolidated growth will remain more dependent on the Americas and selected APAC markets.
APAC remained bifurcated, with China muted and India/rest of Asia described as robust. Fourth quarter organic sales declined 9.3%, and margin compressed due to volume deleverage. Management rejected a thesis that Western suppliers are being structurally excluded in China, emphasizing that “the market demand is not very strong in this moment” and noting that Vertiv operates as a “Chinese player in China” and is “silicon agnostic.” The 2026 outlook assumed APAC growth in the mid 20% range, implying that strength outside China can more than offset ongoing China softness.
MARGINS, PRICE-COST, AND THE INVESTMENT INTENSITY TRADE-OFF
Margin performance was a key bullish element of the quarter, with expanding operating margins even as the company scaled rapidly and absorbed tariff-related headwinds. Fourth quarter adjusted operating margin of 23.2% was described as driven by leverage, productivity, and price-cost, partially offset by tariff impact. For full year 2025, adjusted operating margin expanded 100 bps to 20.4%, with productivity and positive price-cost cited as primary drivers.
For 2026, guidance implied 210 bps of adjusted operating margin expansion to 22.5% at the midpoint on 28% organic growth. That magnitude of margin expansion at this growth rate implies confidence in continued operating leverage, sustained pricing power, and supply-chain productivity. However, management also acknowledged that incremental margins are being restrained by growth investments. In response to an analyst question about incrementals potentially rising above the guided low end, the CFO stated that “There is a higher-level of investment” and that investment ramp has “a little bit of pressure… as we drive those incremental margins,” while reiterating the longer-term incremental margin trajectory.
Pricing commentary remained favorable. Management stated: “2025 pricing exceeded inflation, and we expect the same in ’26.” This is a central support for the margin outlook, particularly given the presence of tariffs and commodity volatility. The call’s tariff commentary suggested mitigation is progressing: “We expect on an exit-rate basis to have materially offset unfavorable margin impact from tariffs as of the first-quarter of this year.” This implies that tariff impact should be less of a margin headwind exiting first quarter 2026 than in late 2025, although the phrase “exit-rate basis” implies some intra-quarter and early-year pressure could remain.
CASH FLOW, WORKING CAPITAL, AND BALANCE SHEET POSITIONING
Cash performance in 2025 was strong and supported management’s claims of operational discipline. Full year adjusted free cash flow was approximately $1.887B, up 66% year-over-year, and management cited working capital efficiency and advance payments as important contributors. The fourth quarter cash result ($910M) was specifically tied to larger customer advance payments associated with large orders.
Guidance for 2026 implied a shift in the composition of free cash flow. Midpoint adjusted free cash flow of $2.2B (+17%) lags midpoint EPS growth (+43%), largely due to:
Higher cash taxes (2026: $775M vs 2025: $428M, a $347M headwind).
Higher net capital expenditures (2026: $475M vs 2025: $226M, a $249M headwind).
Lower working-capital benefit (change in working capital 2026: $300M vs 2025: $415M; plus “working capital & other” of negative $60M year-over-year in the bridge).
This guidance implicitly reduces reliance on the unusually strong 2025 working-capital inflow and positions free cash flow growth as more structurally tied to profit growth, but it also highlights that 2025’s cash conversion level may not be a steady-state assumption. The sustainability of advance payments and progress billing terms remains a key swing factor for cash generation, particularly if competitive dynamics change or if order mix shifts.
Balance sheet commentary indicated low leverage and flexibility. Net leverage was stated at approximately 0.5x at quarter-end, positioning the company for incremental capex, strategic M&A, and shareholder returns. No specific capital return framework was quantified on the call, but strategic flexibility was emphasized.
GUIDANCE, COMPARISONS, AND CREDIBILITY ASSESSMENT
Management provided both first quarter 2026 and full year 2026 guidance and framed the outlook as underpinned by demand momentum and backlog visibility.
Regional assumptions embedded in 2026 sales guidance:
Americas: high 30% growth; net sales range $9.1B to $9.3B.
APAC: mid 20% growth; net sales range $2.4B to $2.6B.
EMEA: flat to down mid single digits; net sales range $1.7B to $1.8B, with a return to growth in the second half.
Guidance vs prior company guidance for 2025:
Fourth quarter 2025: adjusted EPS beat prior guidance by $0.10; net sales beat by $30M; adjusted operating profit beat by $29M; adjusted operating margin exceeded guidance by 80 bps.
Full year 2025: adjusted EPS beat prior guidance by $0.10; net sales beat by $30M; adjusted operating profit beat by $30M; adjusted operating margin exceeded guidance by 20 bps.
Tax rate: fourth quarter 2025 adjusted ETR was 21% versus prior guidance of 23%, primarily due to stock-based compensation-related benefits and changes in tax attributes. Guidance for first quarter and full year 2026 assumes a 23% adjusted ETR, implying a tax headwind versus the unusually favorable fourth quarter 2025 rate.
Guidance vs street expectations (as provided in the Bloomberg summary included in source material):
First quarter: adjusted EPS guidance of $0.95 to $1.01 versus consensus estimate of $0.93; sales guidance of $2.50B to $2.70B versus consensus of $2.54B.
Full year: sales guidance of $13.25B to $13.75B versus consensus of $12.43B; adjusted EPS guidance of $5.97 to $6.07 versus consensus of $5.29.
The magnitude of the full-year guide uplift versus consensus implies that either: 1) the market materially under-modeled backlog conversion and/or margin expansion into 2026; 2) management has increased confidence in the durability of demand and pricing; or 3) management is taking a more aggressive stance on growth conversion that will require sustained execution on capacity, supply chain, and project delivery. Given the company’s pattern of modest beats versus guidance in 2025 and the scale of backlog expansion exiting 2025, guidance credibility appears improved versus typical industrial cyclicals, but risk remains elevated due to the discontinuation of quarterly orders disclosure and the inherent lumpiness of large-project ordering.
STRATEGIC AND TECHNOLOGY POSITIONING
The call reinforced a strategic shift toward higher-integration offerings and services attach, which has implications for content per megawatt, margin structure, competitive differentiation, and recurring revenue mix.
System-level and prefabricated solutions were highlighted as key growth drivers:
OneCore: described as an “end-to-end full data center solution” designed to reduce “time to token” and scale to gigawatt sites via 12.5MW building blocks.
SmartRun: described as a converged, prefabricated whitespace infrastructure solution to accelerate data hall readiness, scalable across compute generations, and deployed at scale with large customers.
The strategic implication is a move from component-level procurement to solution-level procurement, increasing Vertiv’s share of wallet and potentially improving pricing power through delivered-value selling. This also increases execution complexity, as solution-level scope introduces more integration risk, field commissioning intensity, and schedule sensitivity.
Services were positioned as a competitive moat and a source of recurring revenue expansion. Lifecycle services orders growth was stated as “north of 25% year-on-year.” Field service headcount was described as approaching 5,000, with services capacity intended to scale alongside delivery capacity and installed base growth. The PurgeRite acquisition was framed as strengthening fluid management capabilities for liquid-cooled AI data centers, emphasizing that fluid network cleanliness and stability can materially impact compute throughput and downtime risk. The service narrative supports a longer-duration revenue stream that may reduce cyclicality if the installed base expands as expected.
Cooling architecture commentary addressed investor concerns about shifting thermal designs. Management argued that higher-temperature operation of some GPU loads does not remove the need for heat rejection and that future designs are likely to be more hybrid, combining different cooling approaches across loads and climates. The company expressed confidence in long-term relevance of CDU-based approaches, stating that alternatives to cooling chips via CDUs are not broadly expected because “blast radius is a little bit too big” in most cases. A product focus was highlighted on a “trailing cooler,” described as a chiller optimized for higher-temperature operation with flexibility for lower temperatures, intended to maximize free cooling. The net implication is that increased design complexity should benefit suppliers with broad portfolios and systems expertise, supporting content stability or upside over time.
On content per megawatt, management did not explicitly raise the historical framework but indicated it remains usable as a baseline. In response to a question referencing $3.0M to $3.5M per megawatt, management stated that this can be used “as a framework,” while also suggesting that technology complexity is favorable for TAM per megawatt, but that quantification was “a little premature” and may become clearer over the coming quarters.
KEY RISKS, DISCONFIRMATION POINTS, AND MONITORABLES
Demand and backlog conversion risks:
Order lumpiness remains a structural feature and has been repeatedly emphasized by management, increasing quarter-to-quarter forecasting risk.
Discontinuation of quarterly orders/backlog reporting reduces transparency; weaker-than-expected demand would be detected later via revenue and margin impacts rather than via leading indicators.
Backlog lead times of 12 to 18 months support multi-year visibility, but also introduce higher exposure to customer reprioritization risk if macro conditions shift or if AI infrastructure spend moderates.
Execution risks:
Capacity expansion and supply-chain scaling must keep pace with backlog conversion. Capex is rising to 3% to 4% of sales in 2026, but physical capacity, supplier capacity, and field execution remain potential bottlenecks.
Project complexity increases as system-level scope expands, raising integration, commissioning, and delivery schedule risks.
Margin and pricing risks:
Price-cost tailwinds are a central pillar of the margin outlook; competitive pricing pressure or mix shifts could compress margins, particularly if component categories normalize or if solution-level bids become more competitive.
Tariff mitigation is expected to improve by the end of first quarter 2026 on an exit-rate basis, but tariff volatility remains a modeling and margin-risk factor.
Cash flow and working-capital risks:
2025 cash flow benefited materially from advance payments; changes in customer terms, mix, or competitive dynamics could reduce this tailwind.
2026 cash taxes are guided sharply higher, creating sensitivity to geographic profit mix and tax attribute utilization.
Elevated capex reduces near-term free cash flow conversion; a sustained period of high growth may require continued above-normal capex beyond 2026.
Regional risks:
China remains weak and is the primary driver of APAC underperformance; a prolonged China downturn would weigh on both growth and margin in the region.
EMEA recovery is expected only in the second half of 2026; delays in permitting or infrastructure constraints could push recovery out further and reduce consolidated growth contribution.
INVESTMENT IMPLICATIONS
The quarter and guidance materially increase the probability of an upward earnings and cash flow trajectory through 2026, supported by the combination of backlog expansion, stated pipeline growth, continued price-cost tailwinds, and operating leverage. The primary positive investment implications are: 1) enhanced revenue visibility given backlog size and stated lead times; 2) structural margin expansion potential evidenced by sustained improvement through 2024 and 2025 and a 2026 guide implying further 210 bps expansion; 3) increasing strategic differentiation as procurement shifts toward system-level solutions and services attach; and 4) balance sheet flexibility that can support capex, targeted M&A, and potential capital returns.
At the same time, the call introduced 2 structural sources of incremental uncertainty that can affect valuation and risk management: 1) reduced transparency on orders and backlog on a quarterly basis; and 2) increased reliance on execution across capacity, suppliers, and field services to convert a much larger backlog while maintaining margin targets. In practice, the discontinuation of quarterly order metrics is likely to shift the market’s focus from demand momentum to conversion and profitability proof points. Consequently, short-term multiple support may become more sensitive to revenue conversion cadence, gross margin stability, working-capital performance, and any evidence of project delays.
Net investment-relevant conclusions from the call’s content:
The magnitude and breadth of order acceleration, combined with explicit commentary that pipeline continued to grow and that backlog reflects binding purchase orders, strengthens the base-case view of sustained demand into 2026 and partial visibility into 2027.
The 2026 guide meaningfully above consensus implies a likely reset of forward estimates, but it also raises the bar for execution and increases downside convexity if conversion is delayed or if margins compress due to capacity constraints, project complexity, or competitive pricing.
The cash flow profile should be modeled with greater attention to advance payments, taxes, and capex. Free cash flow growth guidance (+17%) substantially trails EPS growth guidance (+43%), highlighting that earnings strength is expected to be partially reinvested and partially absorbed by higher cash taxes.
Regional dispersion remains an important swing factor. The Americas is increasingly the consolidated earnings driver, while APAC and EMEA represent both potential upside (reacceleration) and downside (prolonged weakness).
The disclosure change may reduce near-term volatility in reported leading indicators but increases the probability of delayed market recognition of a demand inflection, either positive or negative. This increases the importance of channel checks, customer capex tracking, and competitor commentary for ongoing demand assessment.
Steve Tusa, JP Morgan
Scott Davis, Melius Research
Amit Darani, Evercore
Jeff Sprague, Vertical Research
Chris Snyder, Morgan Stanley
Nigel Coe, Wolfe Research
Andrew Obin, Bank of America
Nicole DeBlase, Deutsche Bank
Mark Delaney, Goldman Sachs
Andy Kaplowitz, Citigroup
Michael Elias, TD Cowen
Amit Mehrotra, UBS
Julian Mitchell, Barclays
Feb 11 • 9 tweets • 7 min read
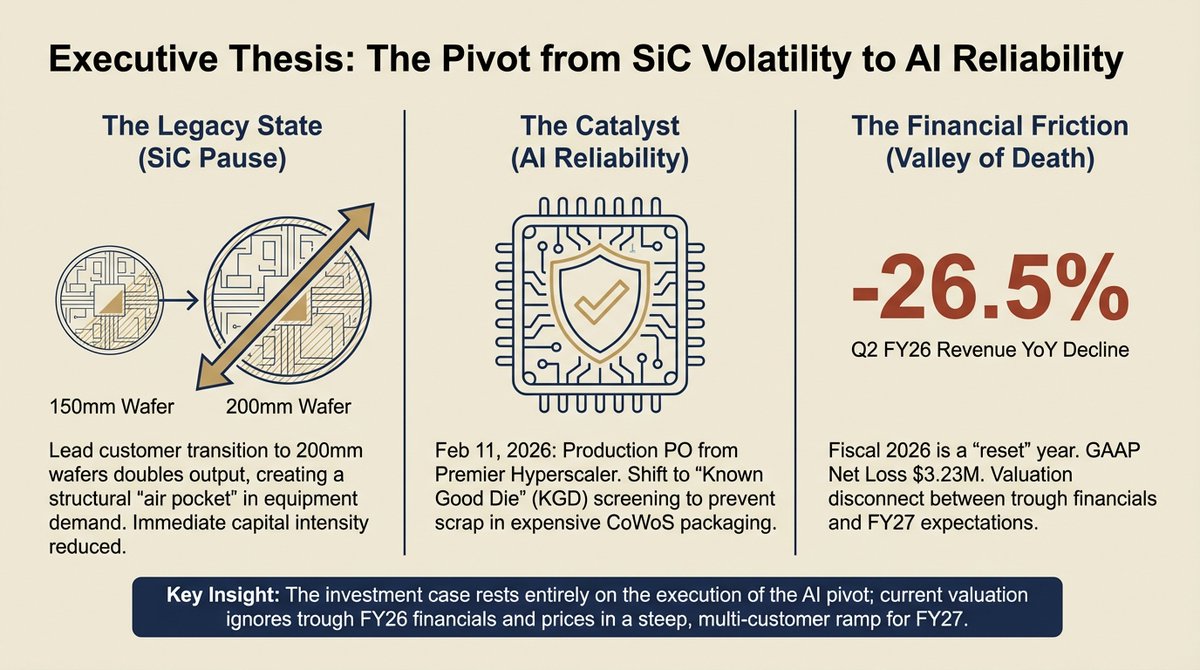
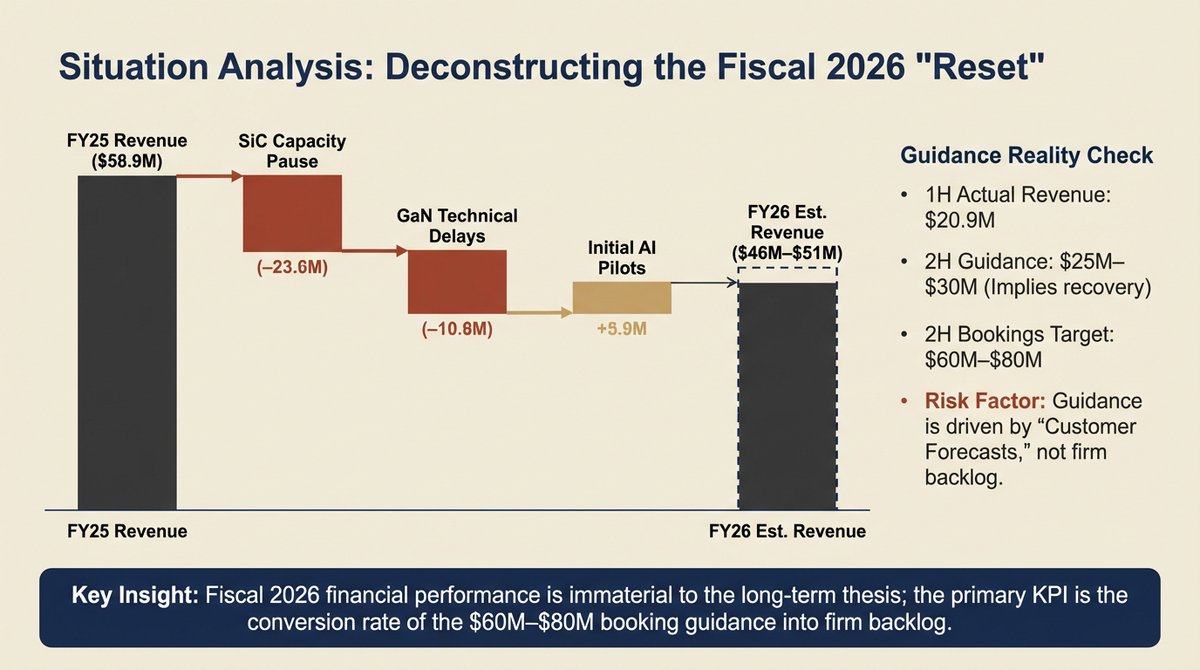
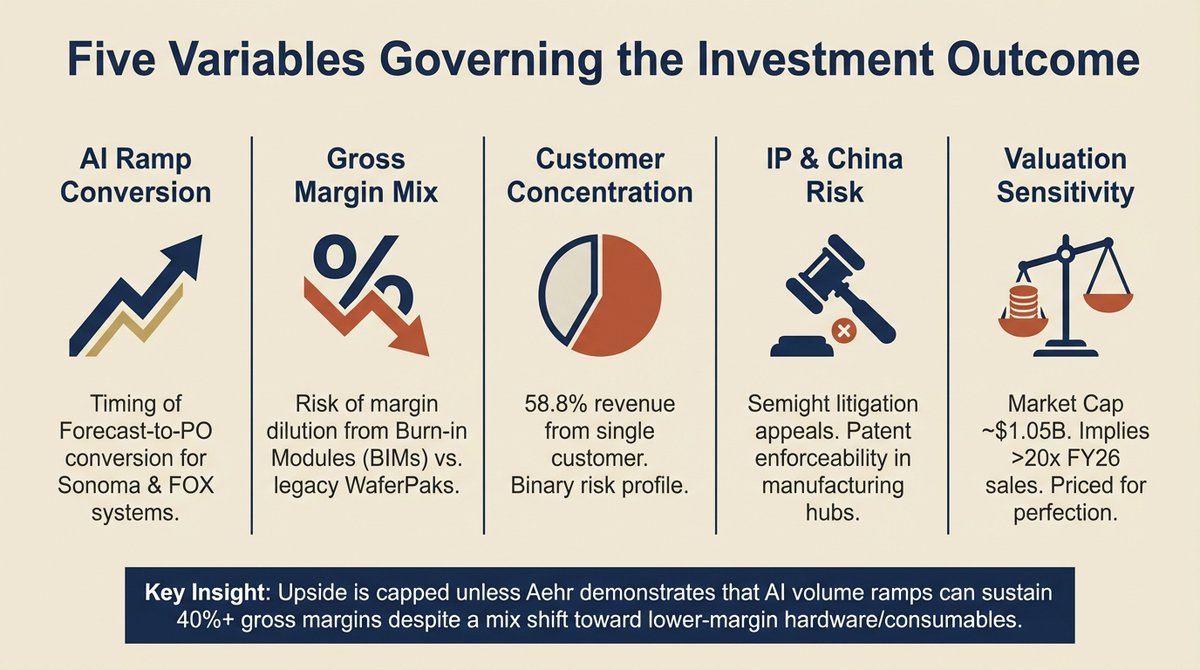
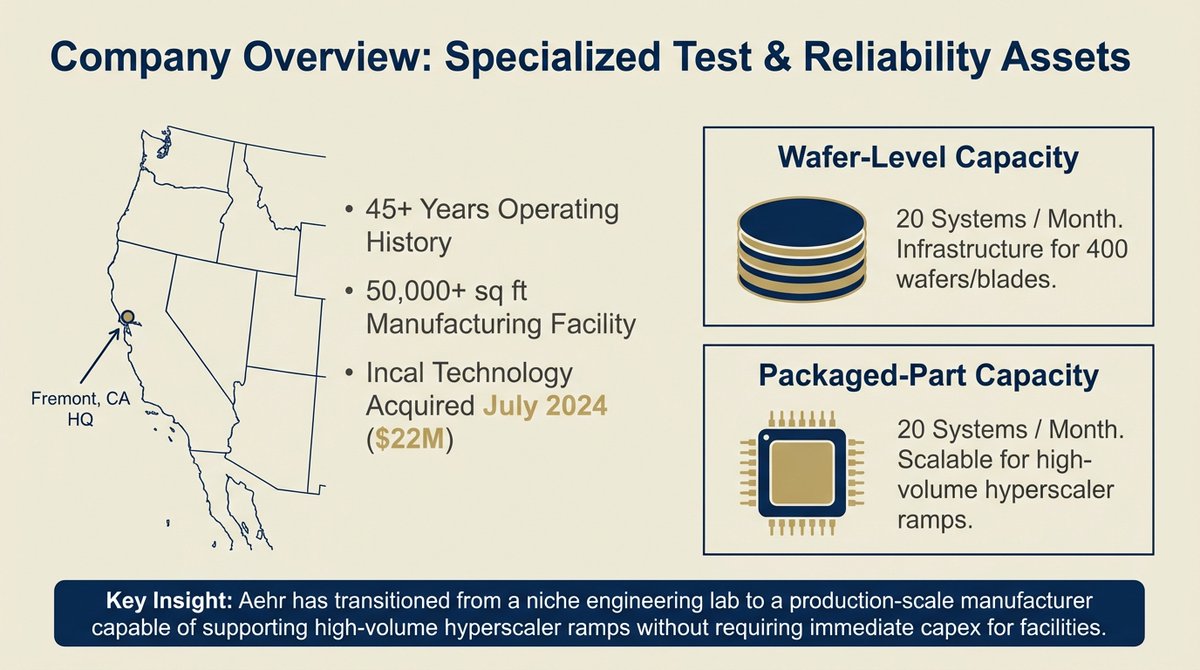
$AEHR Aehr Test Systems: Strategic Pivot to AI Reliability and Burn-In.
Jan 8 • 8 tweets • 7 min read
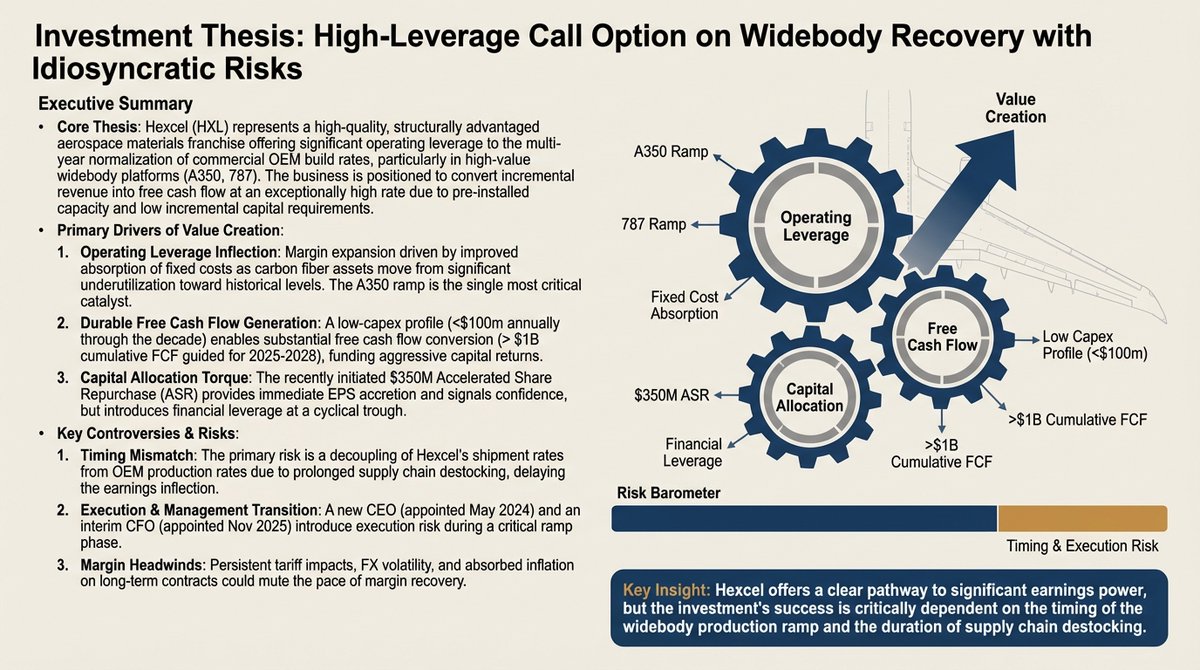
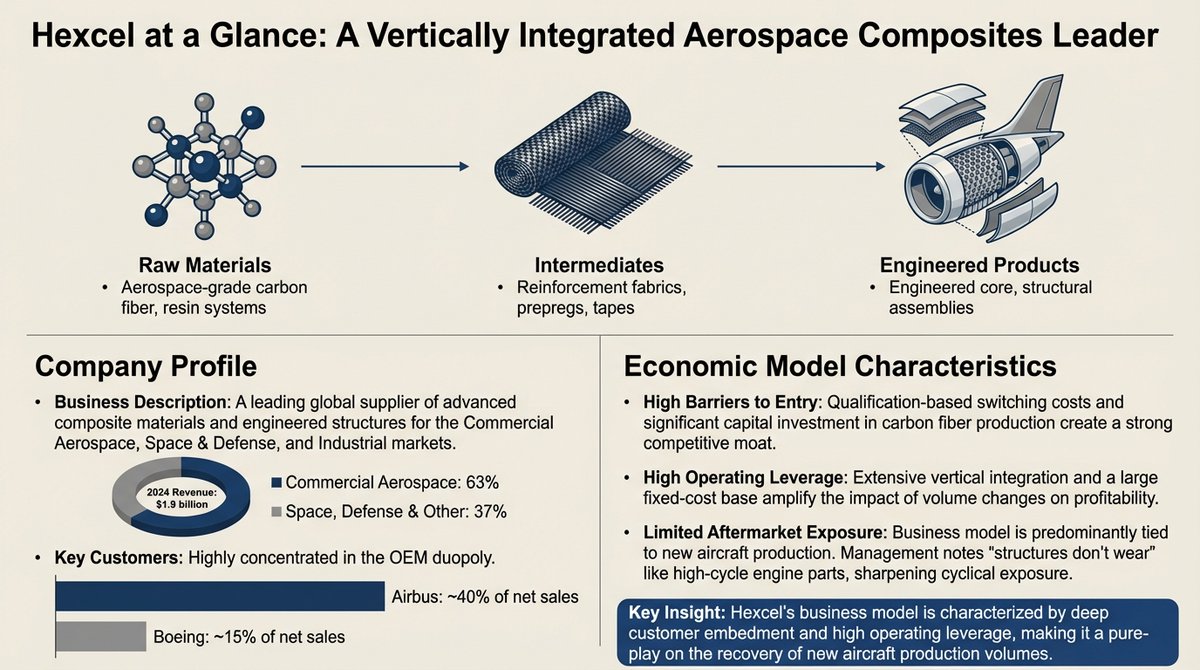
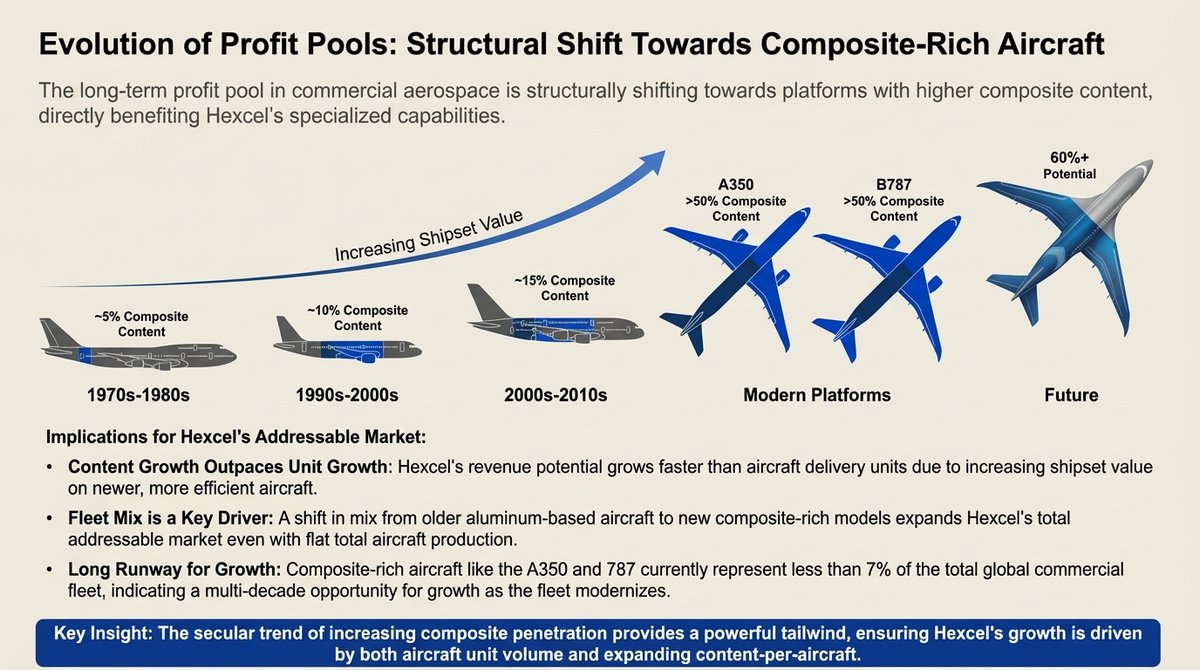
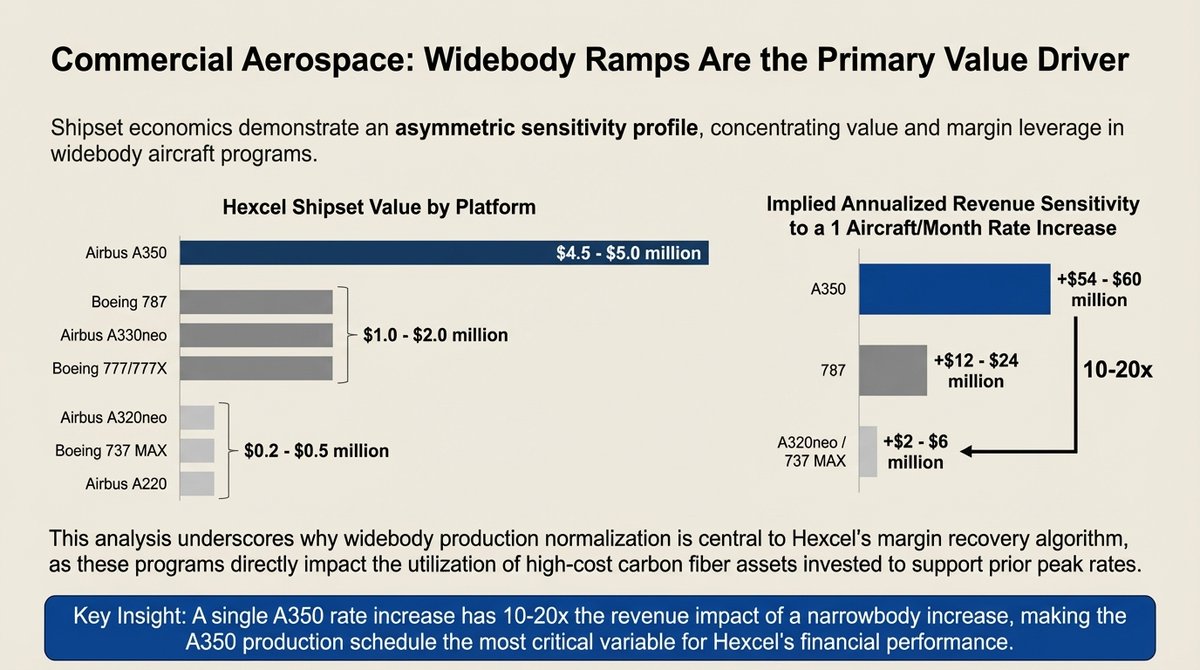
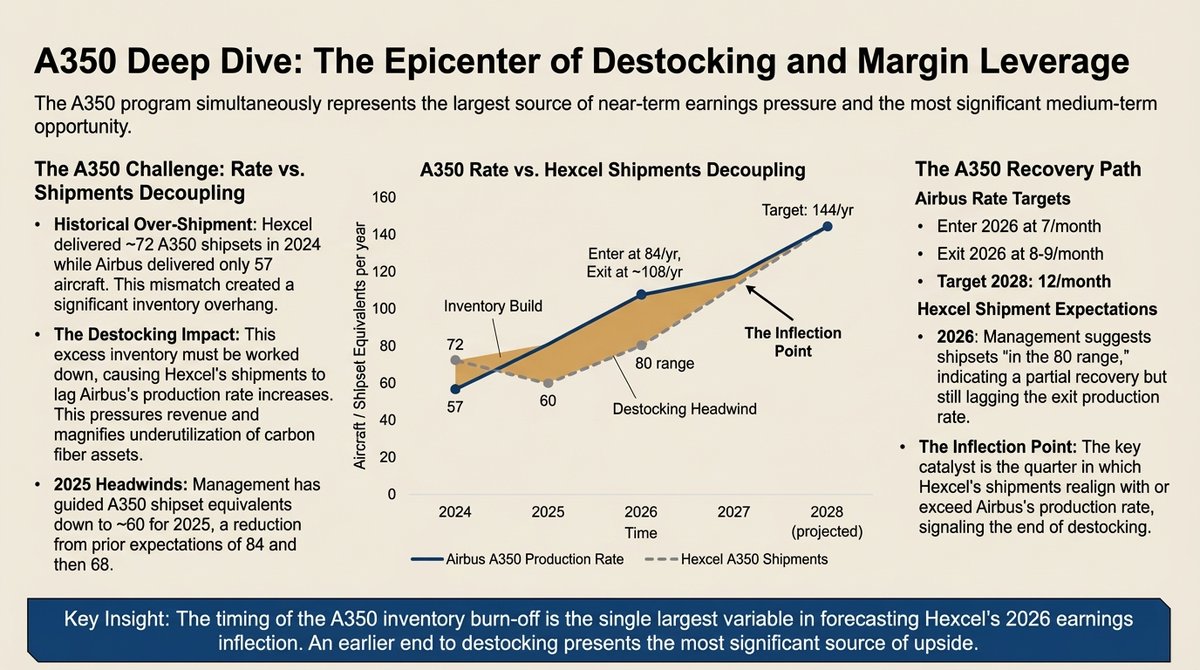
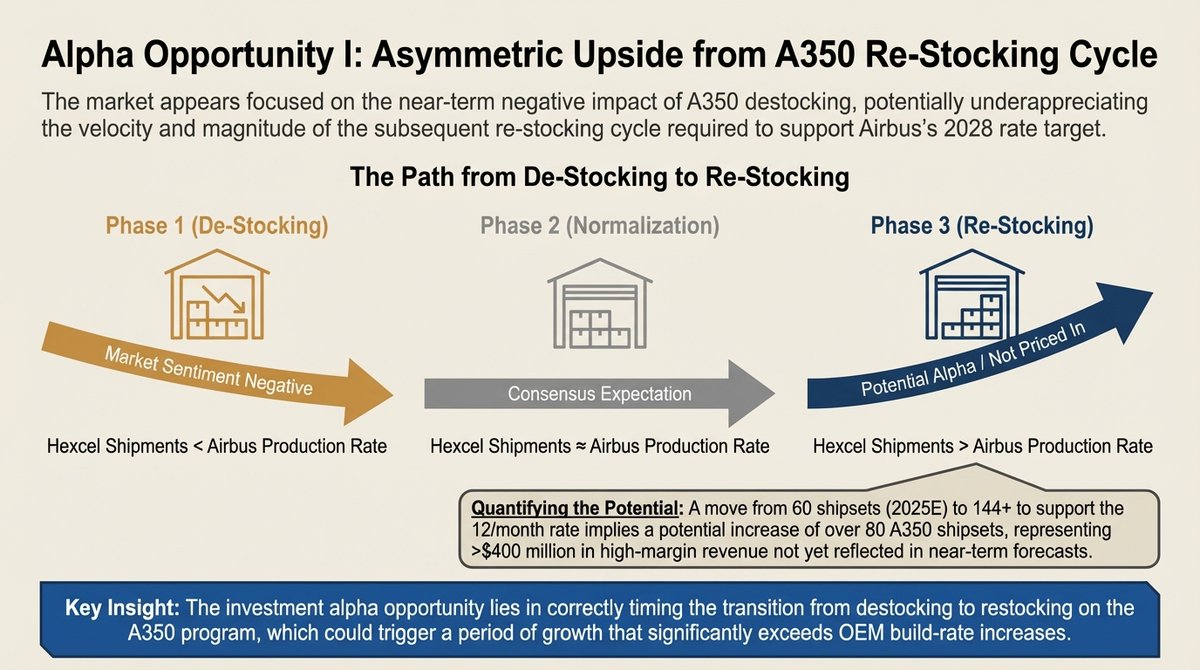
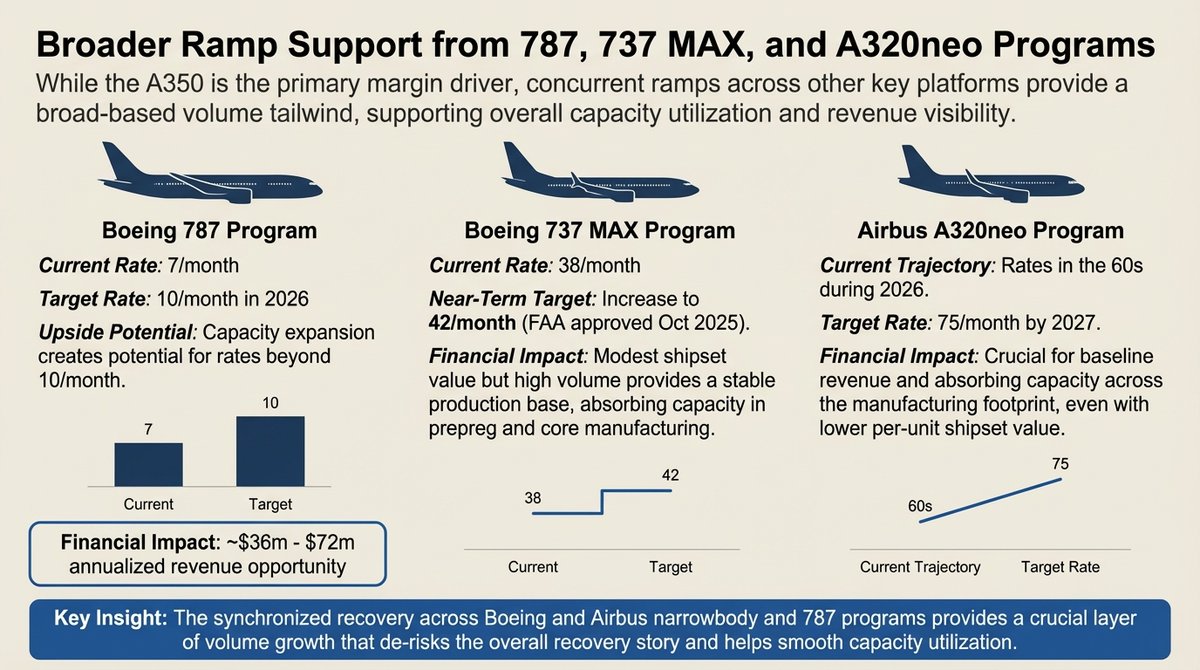
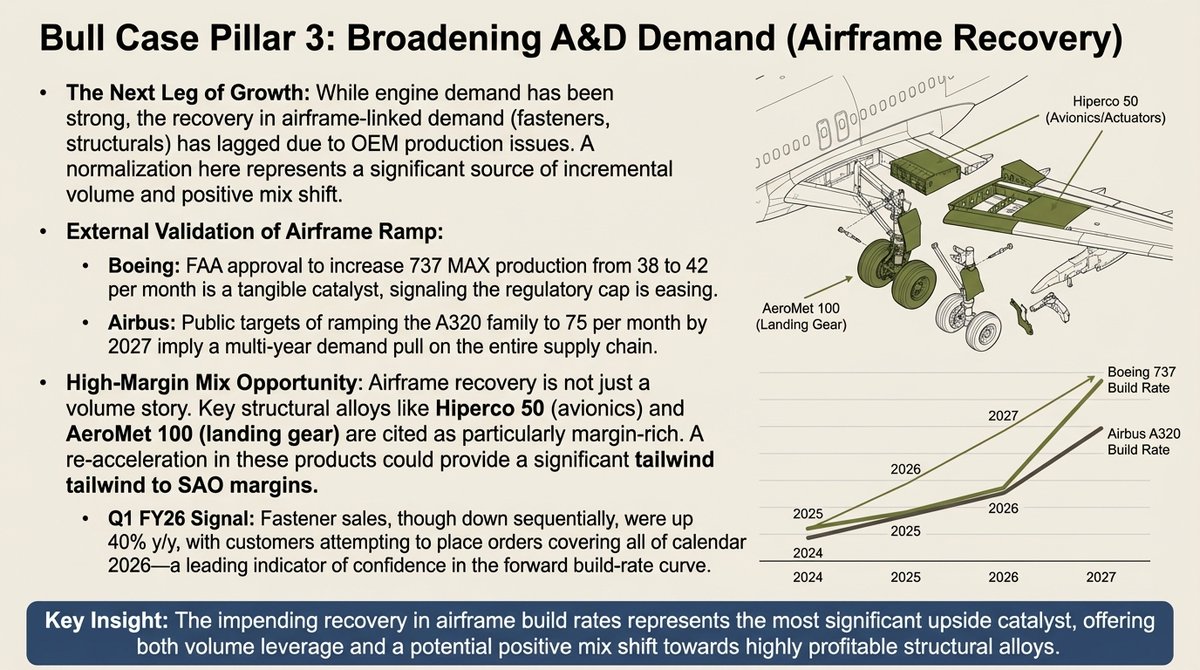
$HXL Hexcel: Aerospace Materials, Leadership Strategy, and Investment Thesis.
Jan 3 • 8 tweets • 7 min read
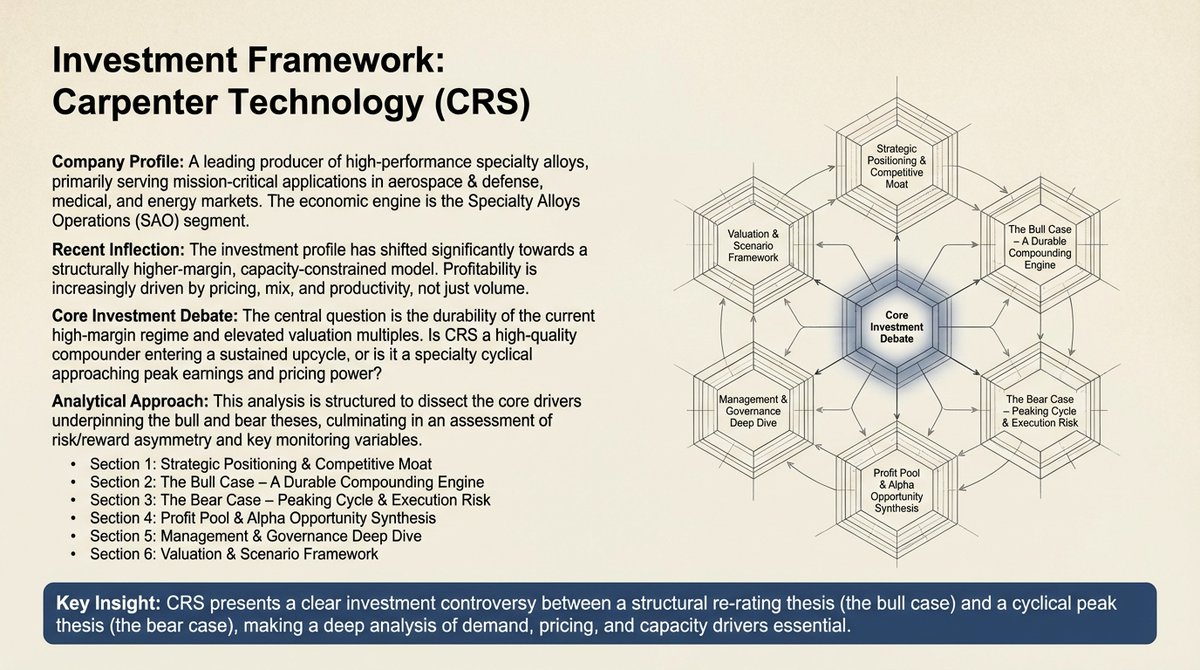
$CRS Carpenter Technology Strategic Outlook and Executive Performance Analysis
Jan 2 • 8 tweets • 7 min read
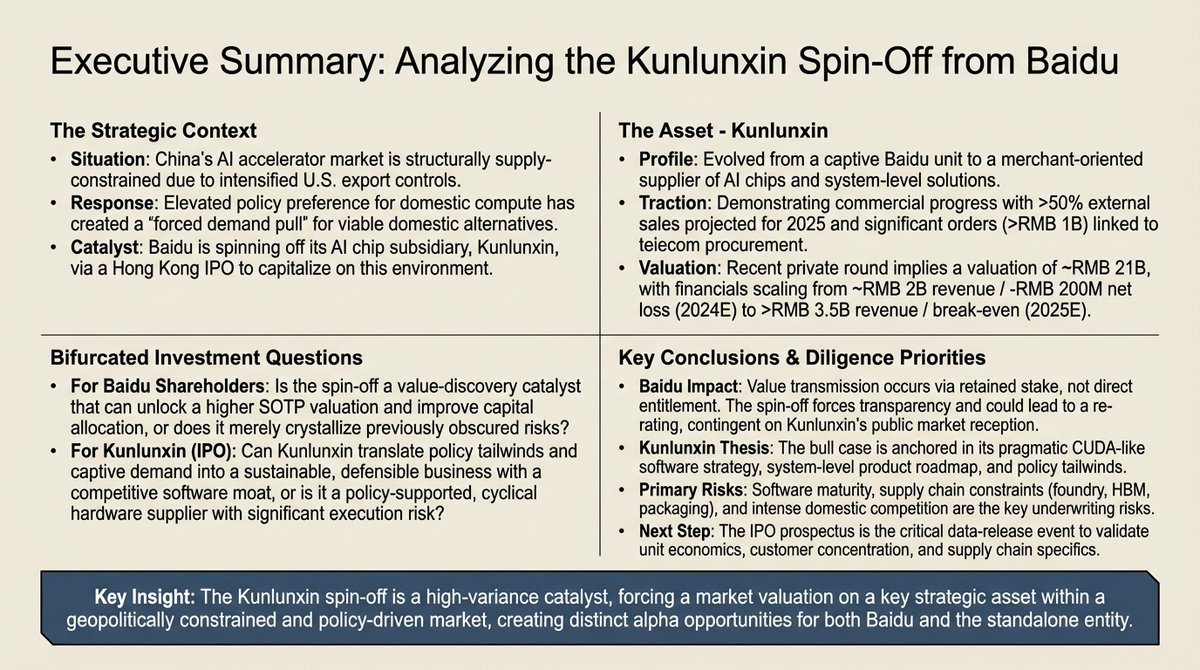
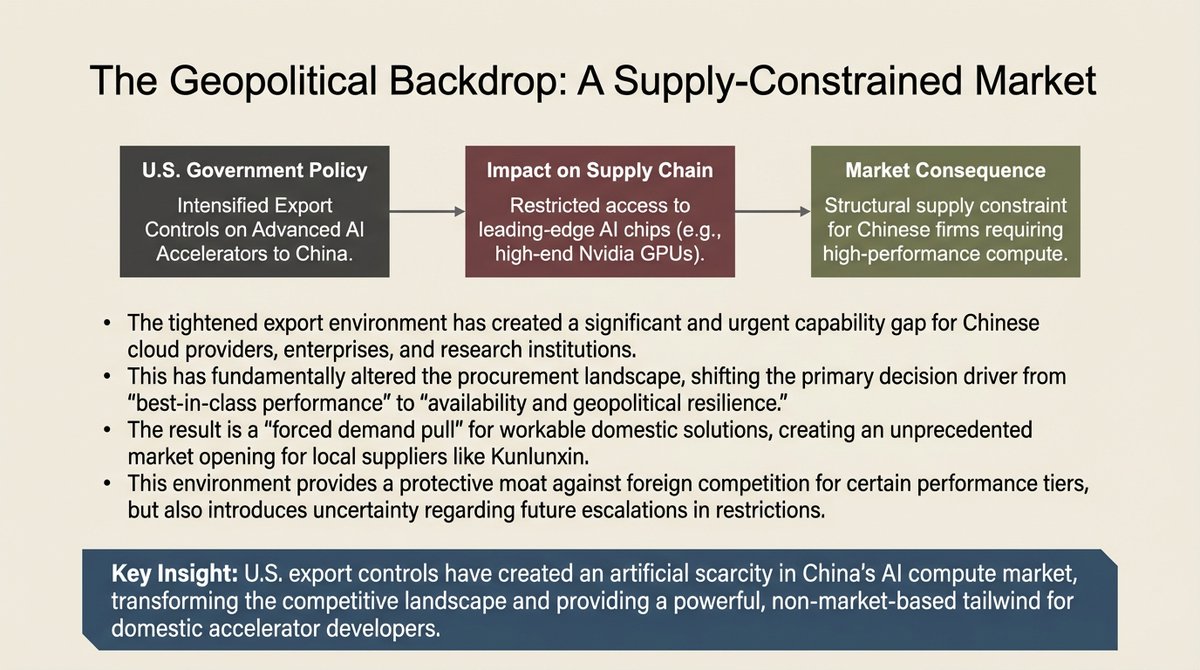
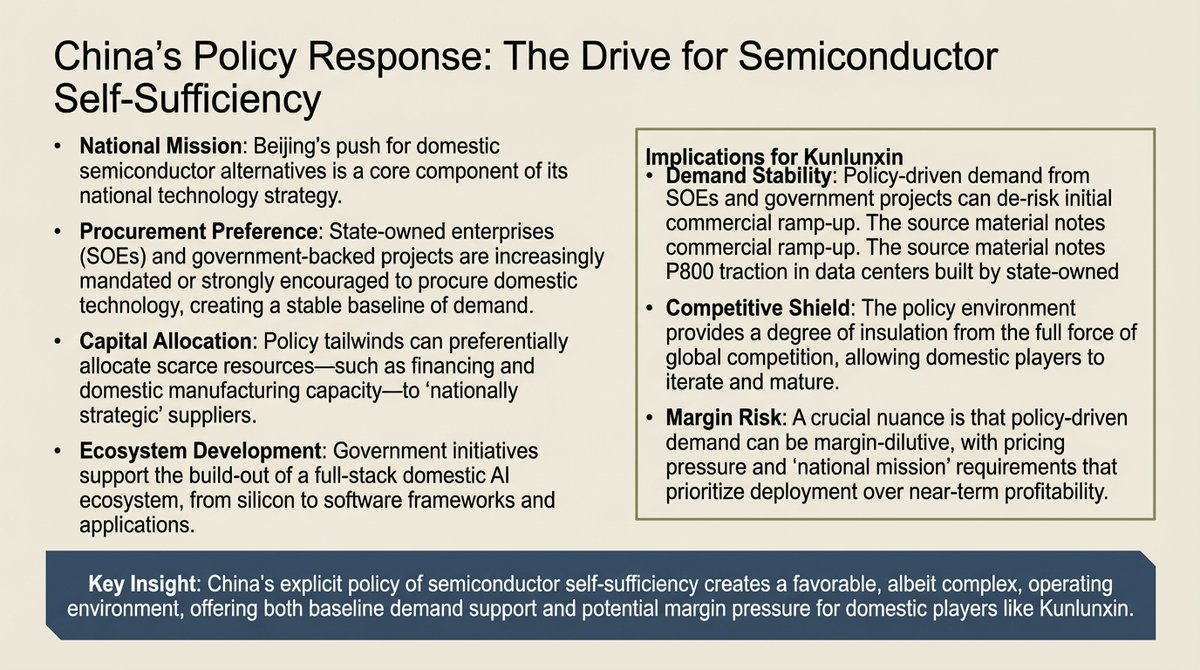
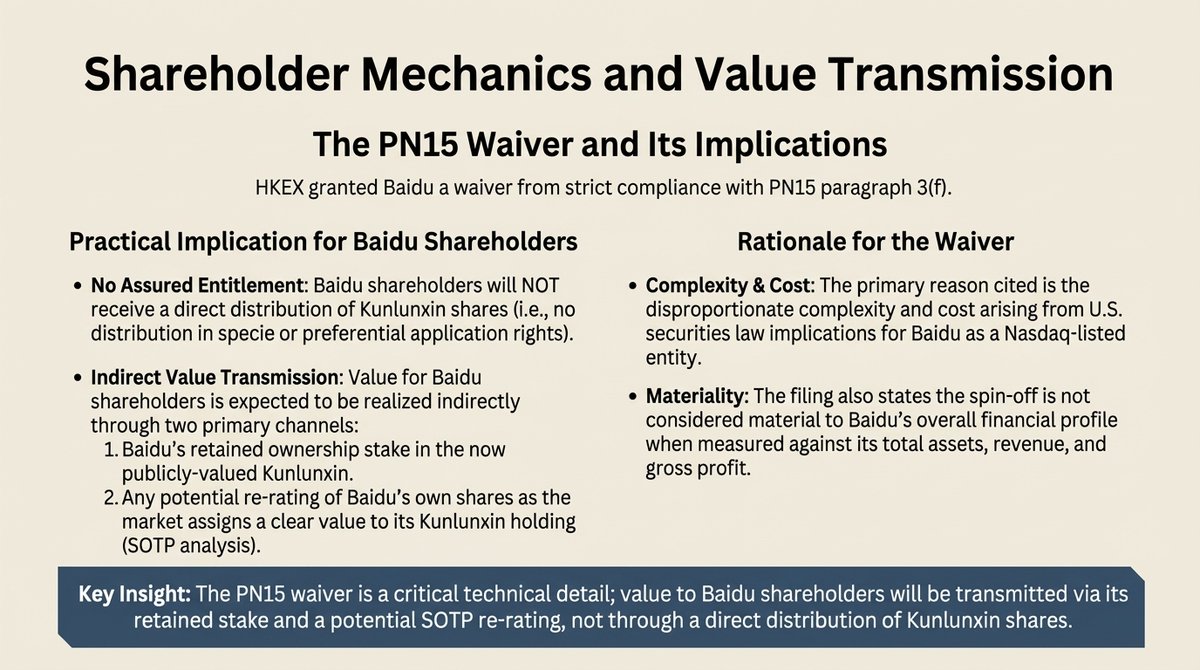
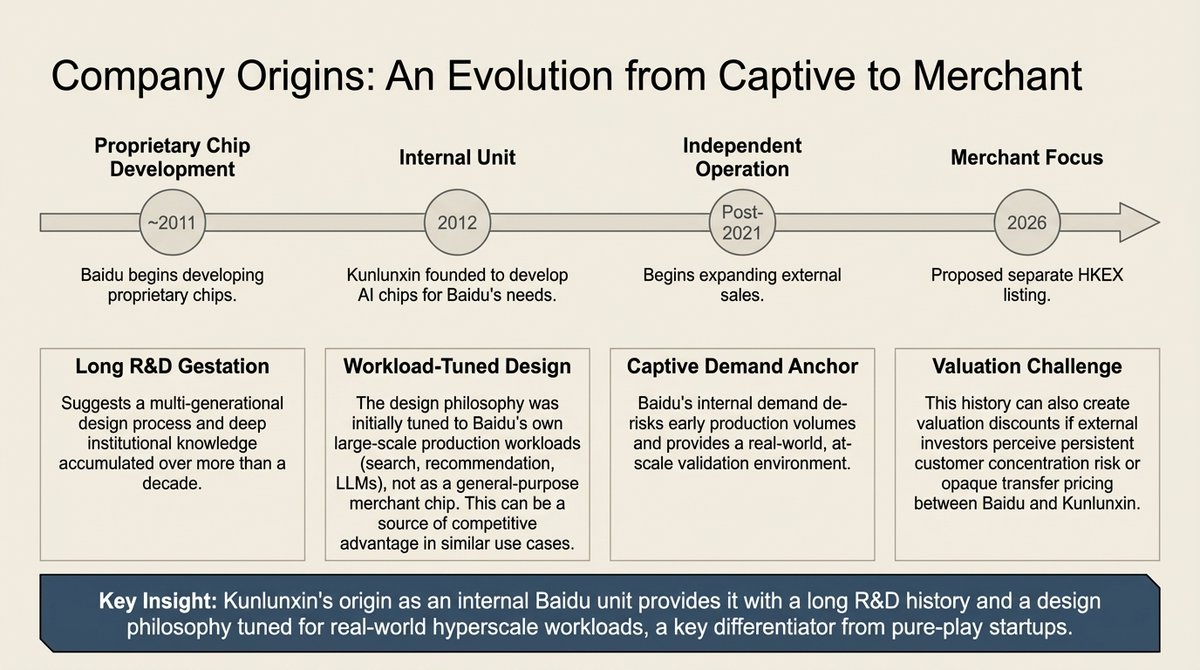
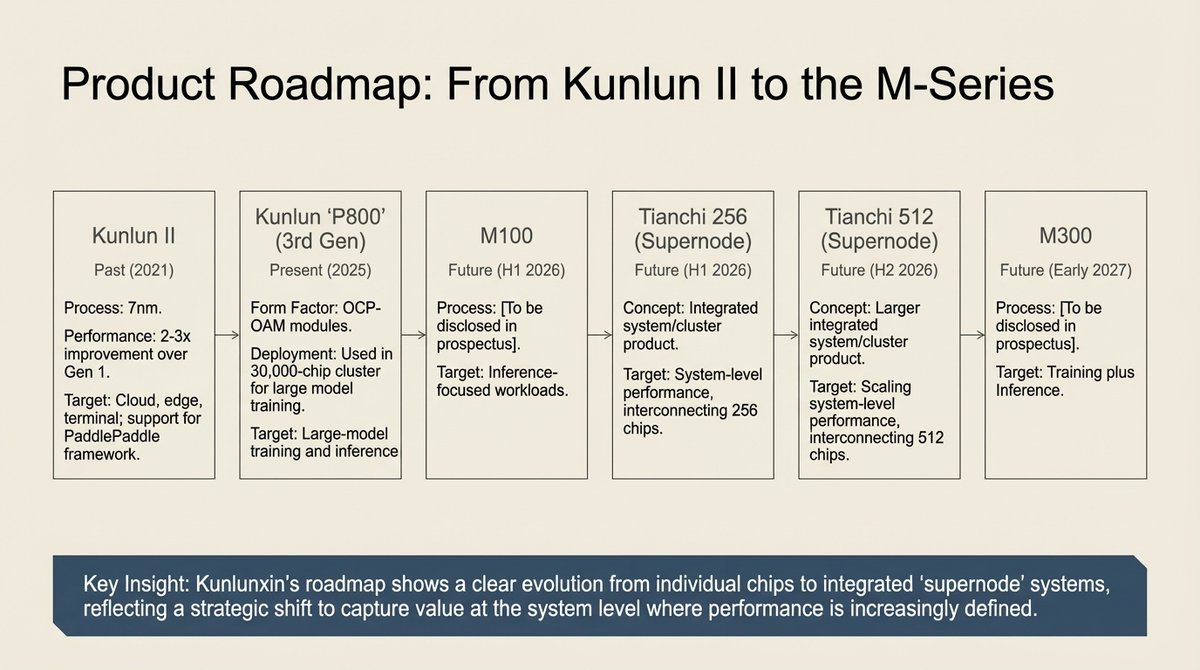
$BIDU Baidu’s Kunlunxin Spin-Off: A Strategic AI Compute Evolution
Dec 25, 2025 • 8 tweets • 7 min read
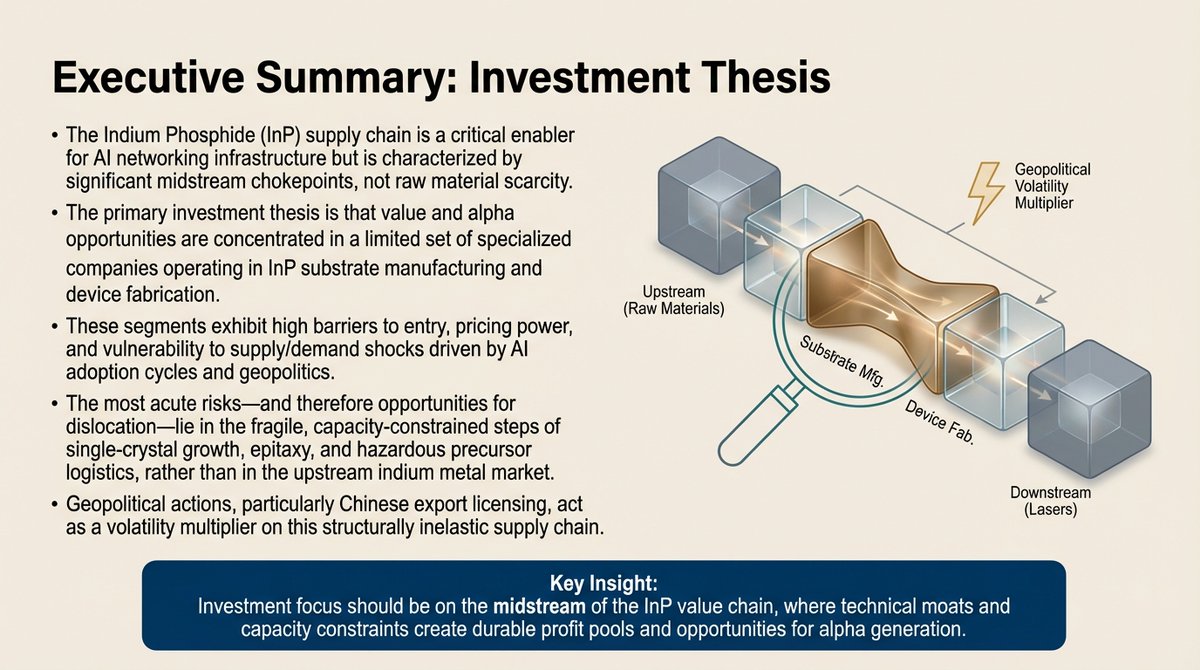
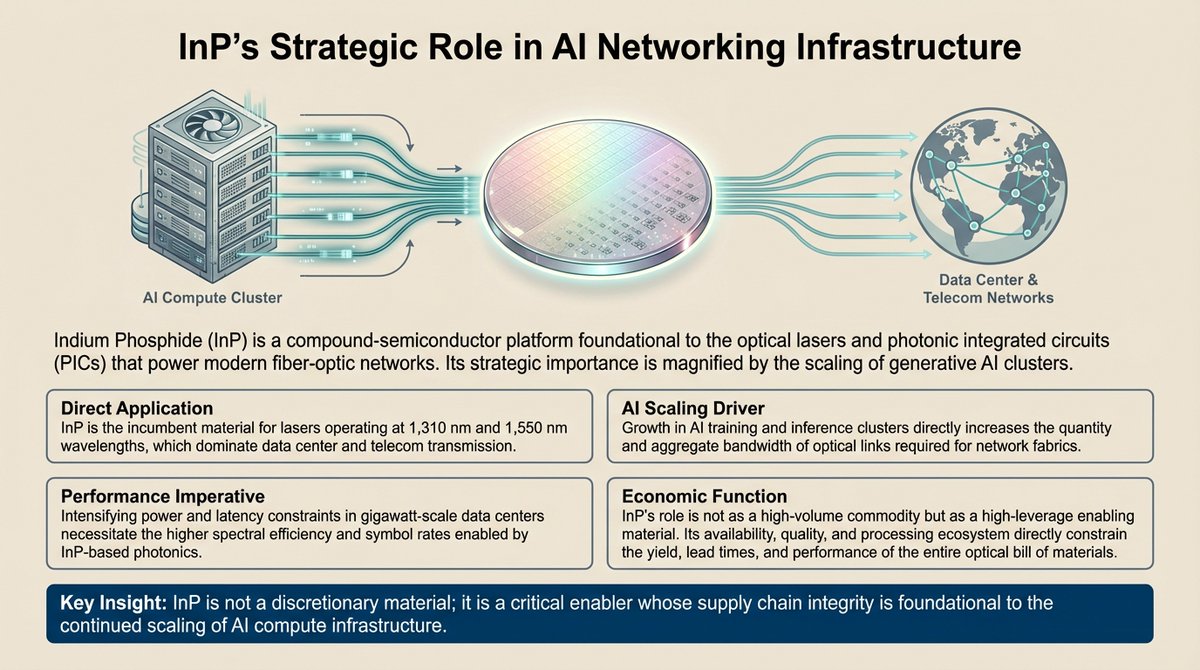
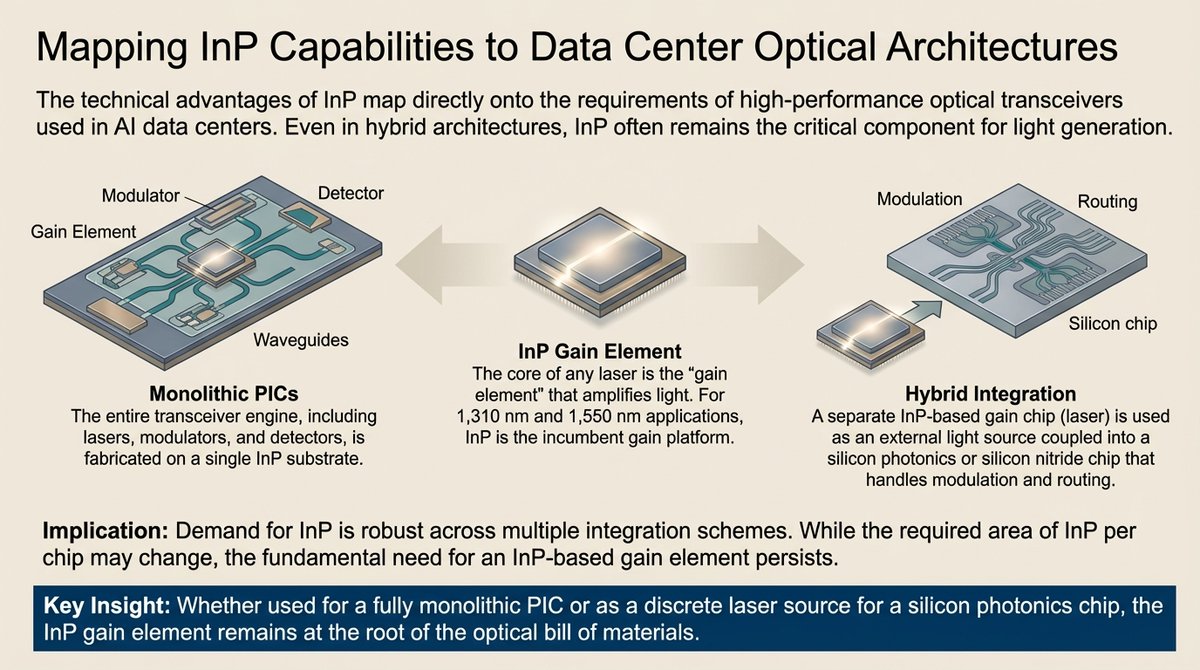
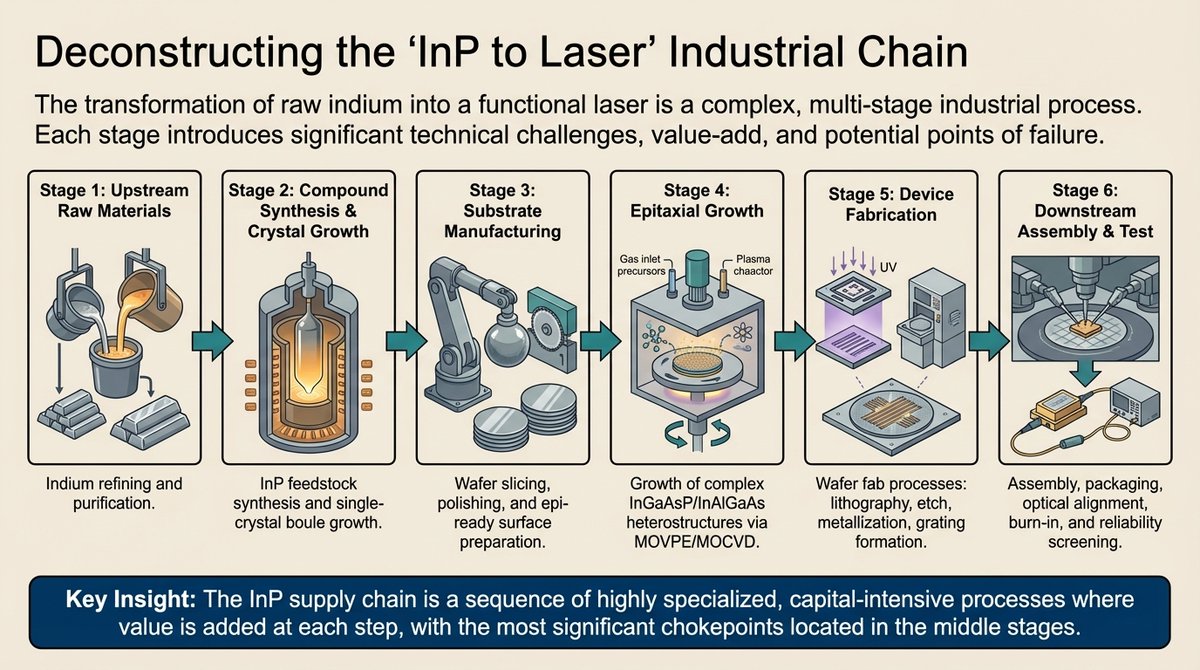
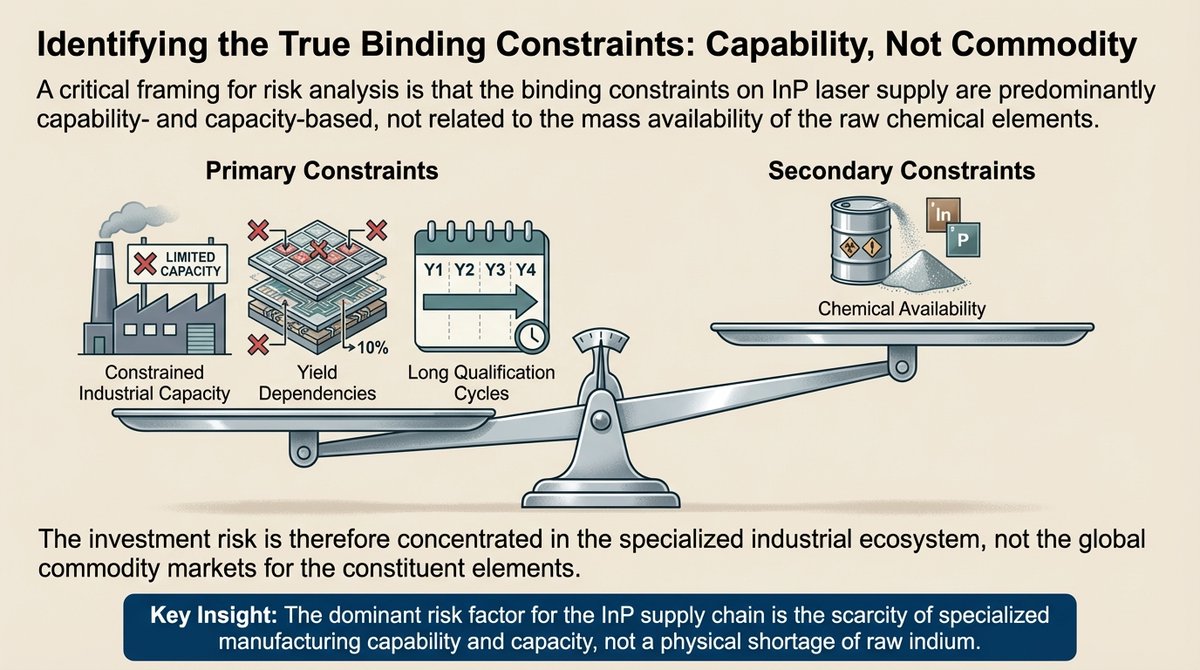
$LITE $COHR Indium Phosphide: Strategic Chokepoints in AI Photonic Supply Chains
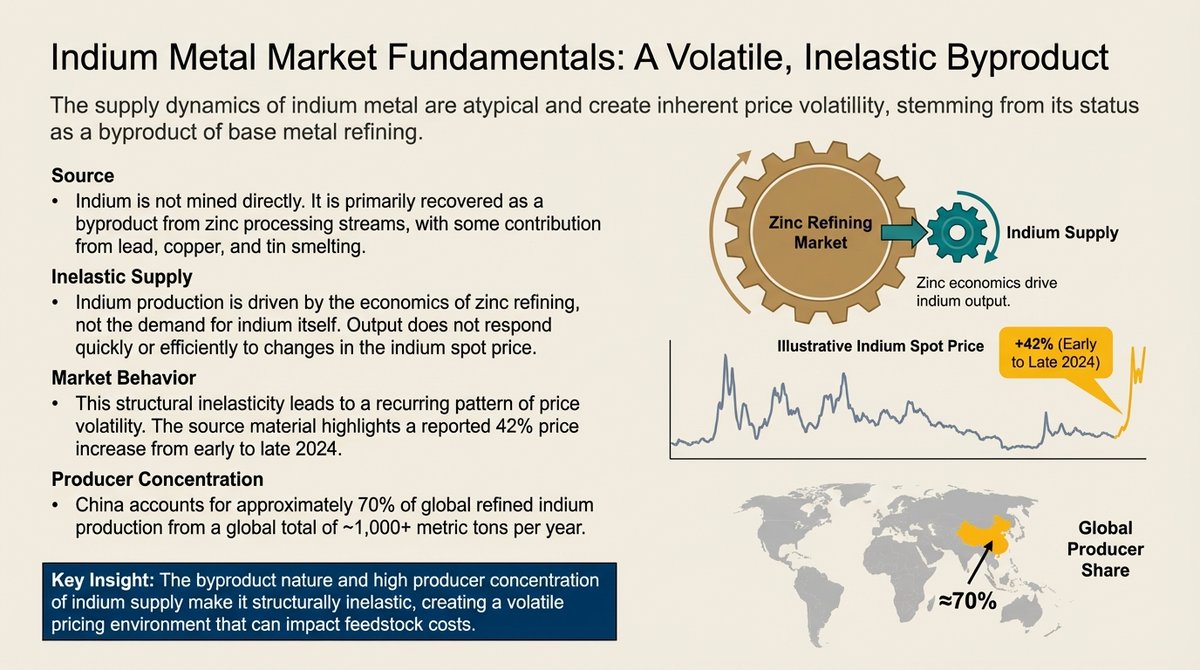
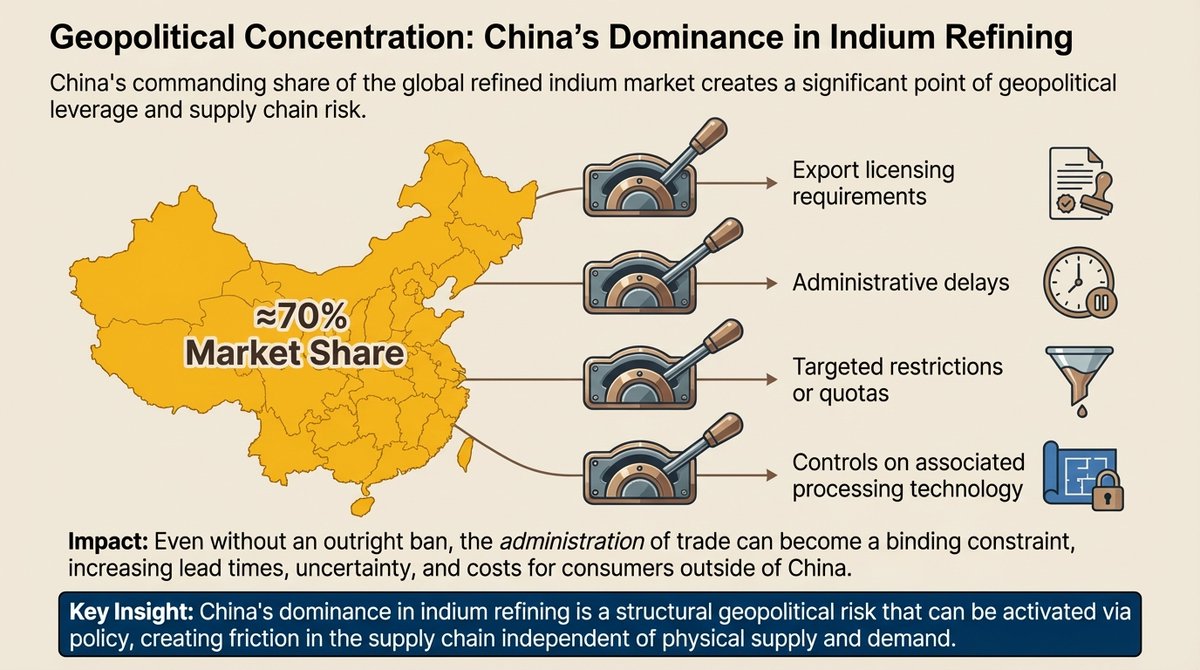
Indium phosphide (InP) serves as a critical backbone for high-speed AI networking, acting as a specialized semiconductor essential for generating the infrared light used in fiber-optic data centers. While the raw material indium is technically available, the supply chain faces significant geopolitical and industrial bottlenecks, particularly due to China’s dominance in refining and recent export licensing restrictions. The primary risks to production are not physical shortages of the metal, but rather the technical difficulty of manufacturing high-quality wafers and the dangerous logistics involved in handling toxic chemical precursors. To mitigate these vulnerabilities, major firms and government initiatives, such as the CHIPS Act, are pushing to expand domestic manufacturing and transition to larger, more efficient wafer formats. Ultimately, the stability of AI infrastructure depends on a narrow ecosystem of specialized suppliers capable of navigating these complex manufacturing and regulatory hurdles. Regardless of emerging technologies, InP remains a foundational material that is difficult to replace in the demanding world of high-bandwidth optical communications.
Dec 19, 2025 • 9 tweets • 7 min read
$CEG $VST $TLN $NRG PJM Market Scarcity and the New Co-location Regulatory Regime - A Comprehensive Analysis
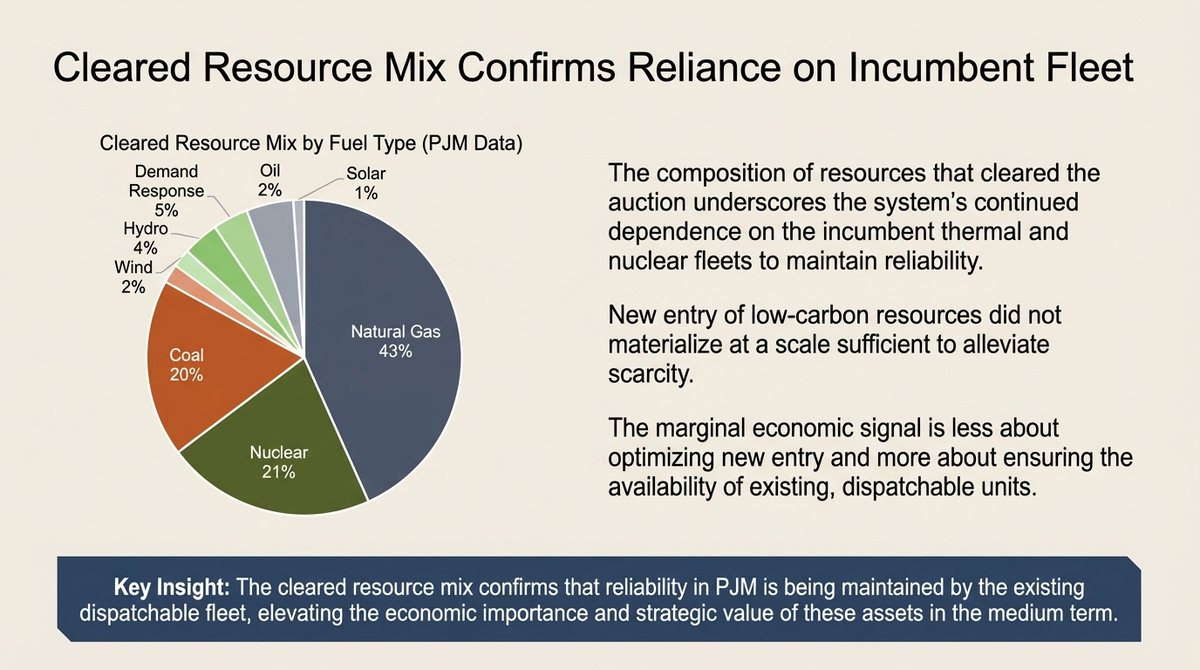
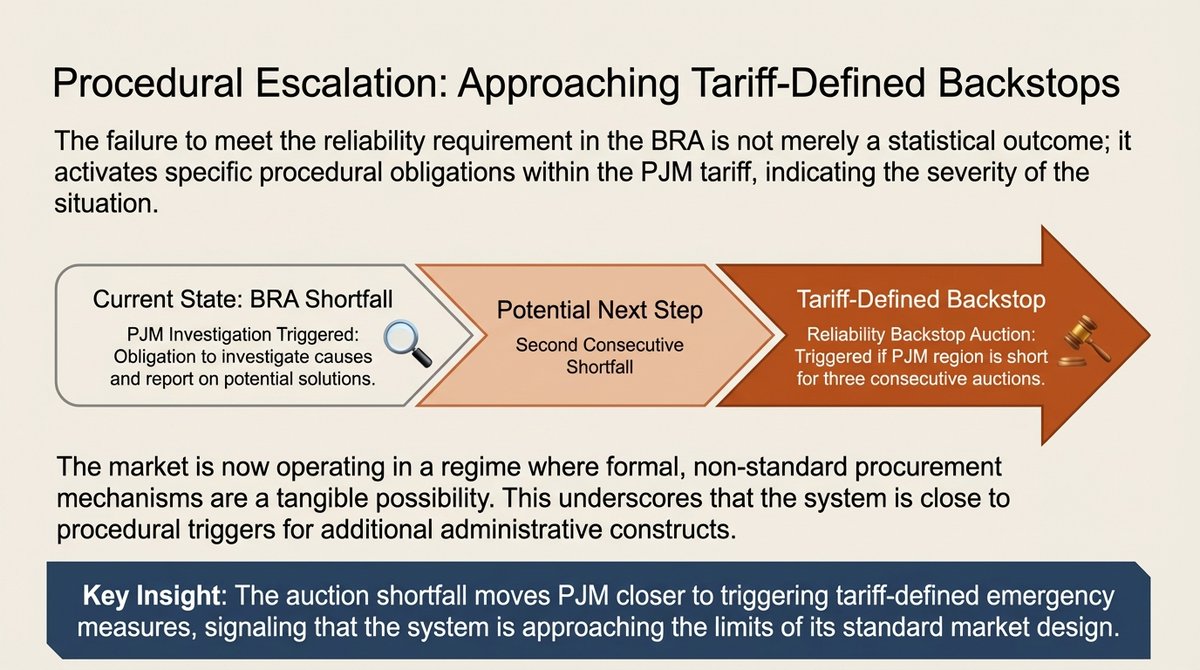
Recent power auctions and federal directives indicate that the PJM energy market has entered a period of structural scarcity, characterized by a significant shortfall in electricity reserves. Prices have hit administrative ceilings as the grid struggles to balance aging generation fleets with the rapid power demands of AI data centers. In response, new federal policies are standardizing co-location frameworks, allowing massive industrial loads to connect directly to power plants to speed up energization. While this shift provides incumbent power generators with predictable, high-revenue streams through 2028, it also intensifies political pressure to reform market rules. Ultimately, the sources highlight a growing tension between the need to incentivize grid reliability and the urgent demand to protect consumers from skyrocketing utility costs.
Dec 14, 2025 • 6 tweets • 5 min read
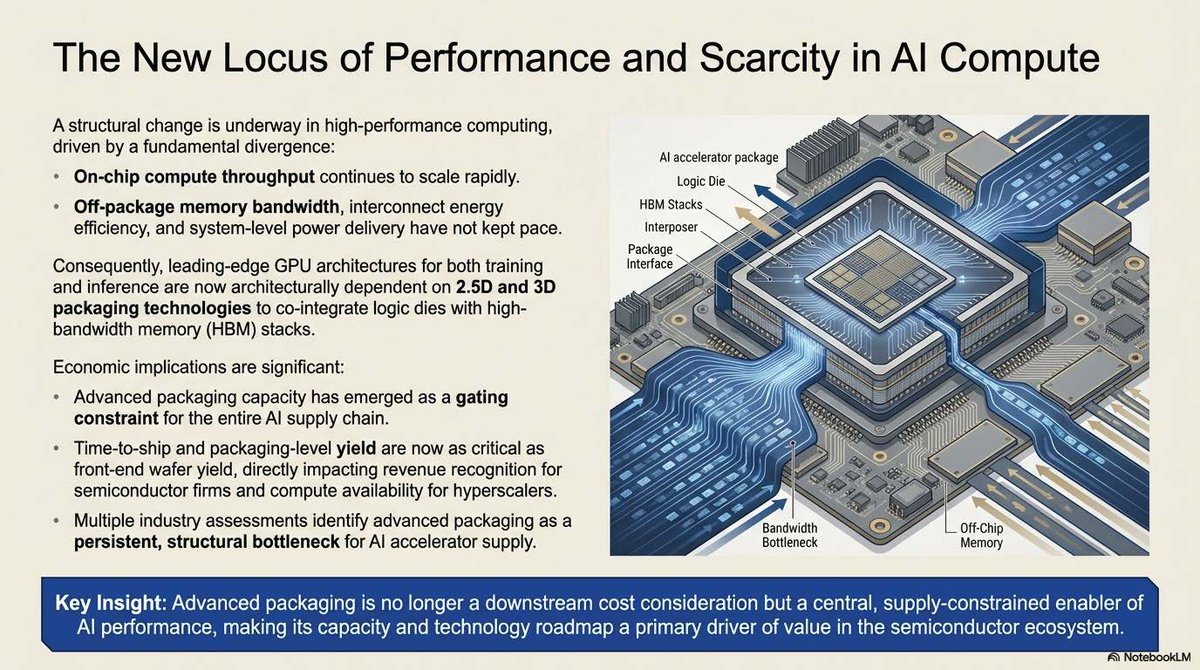
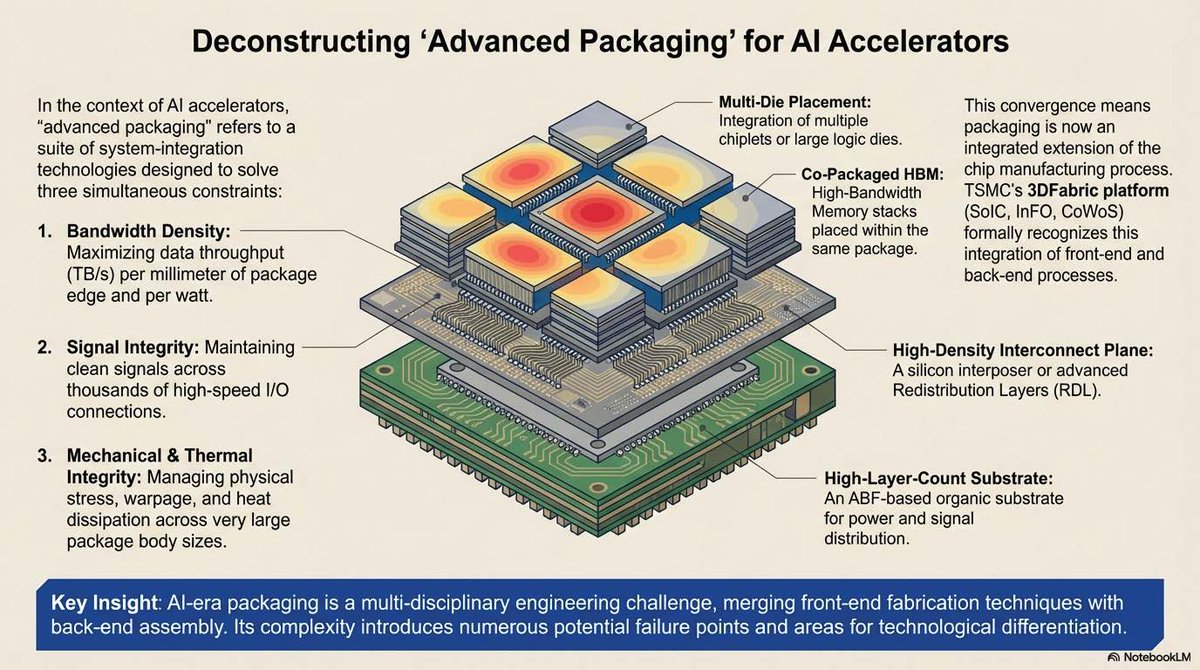
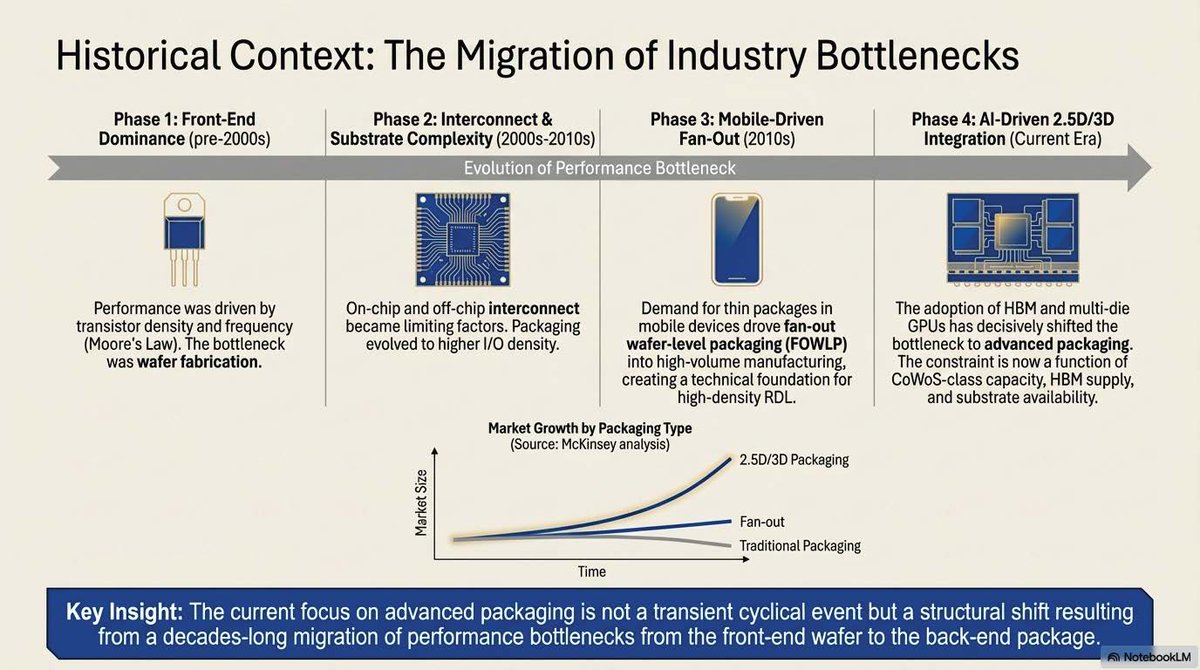
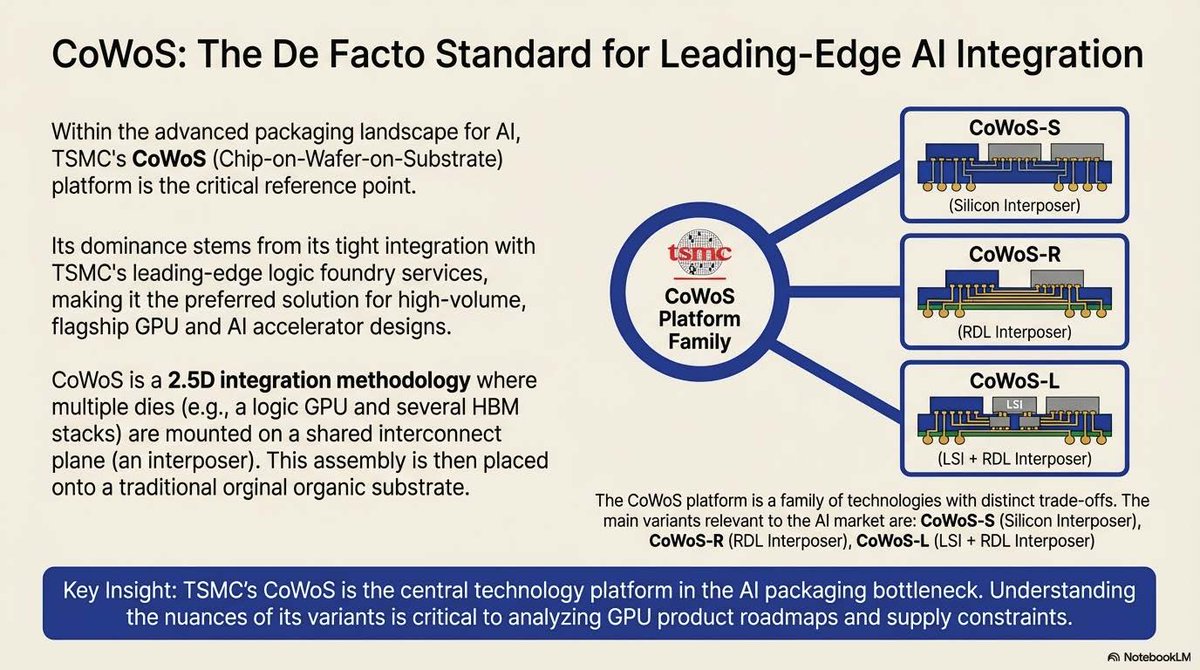
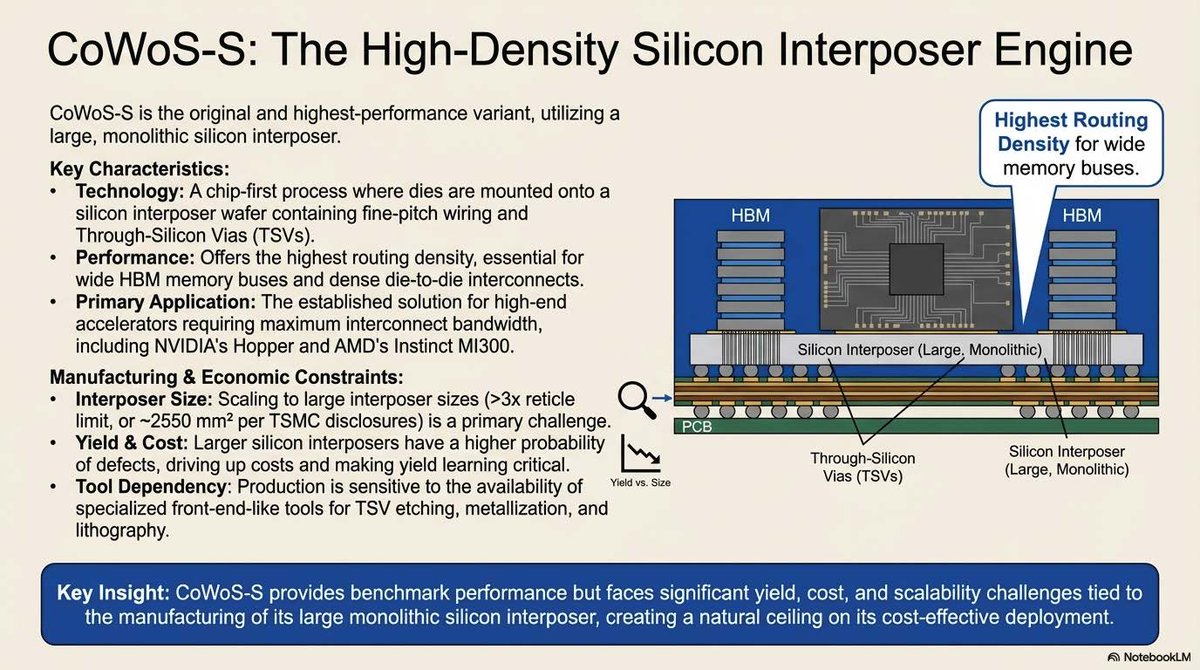
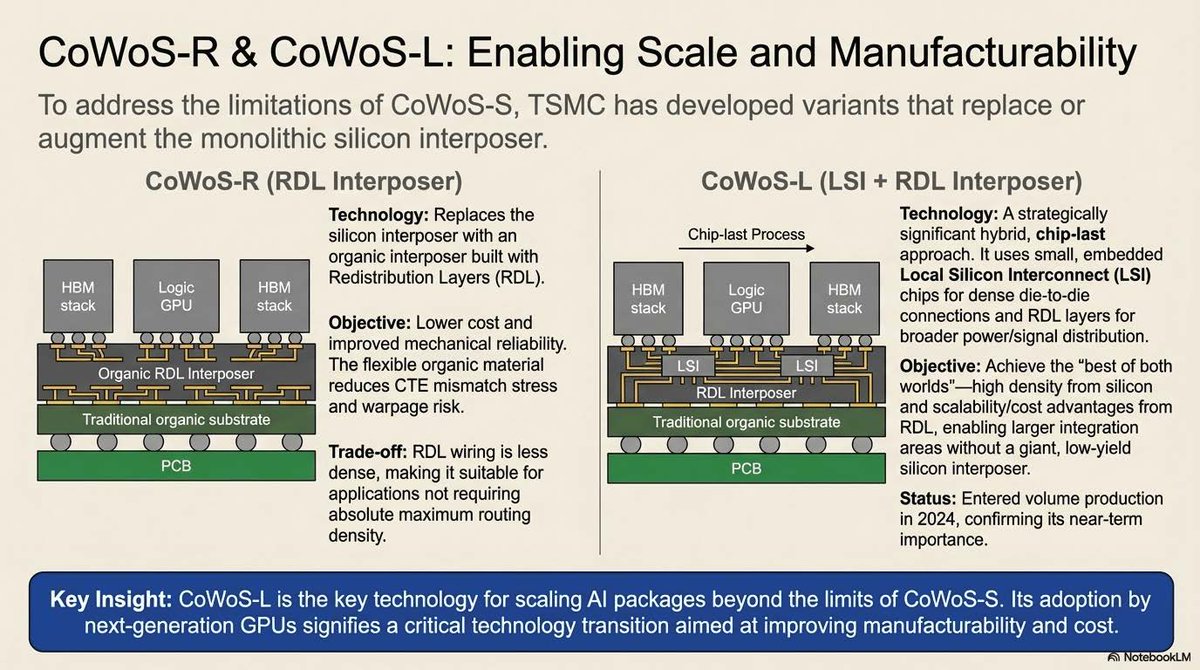
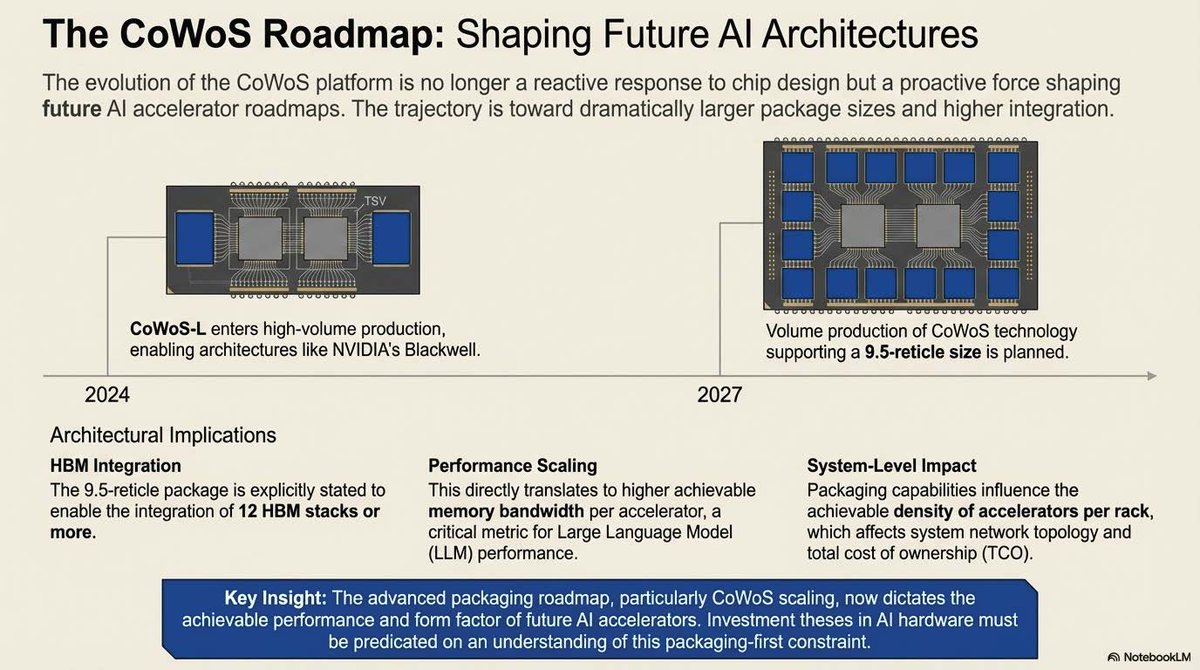
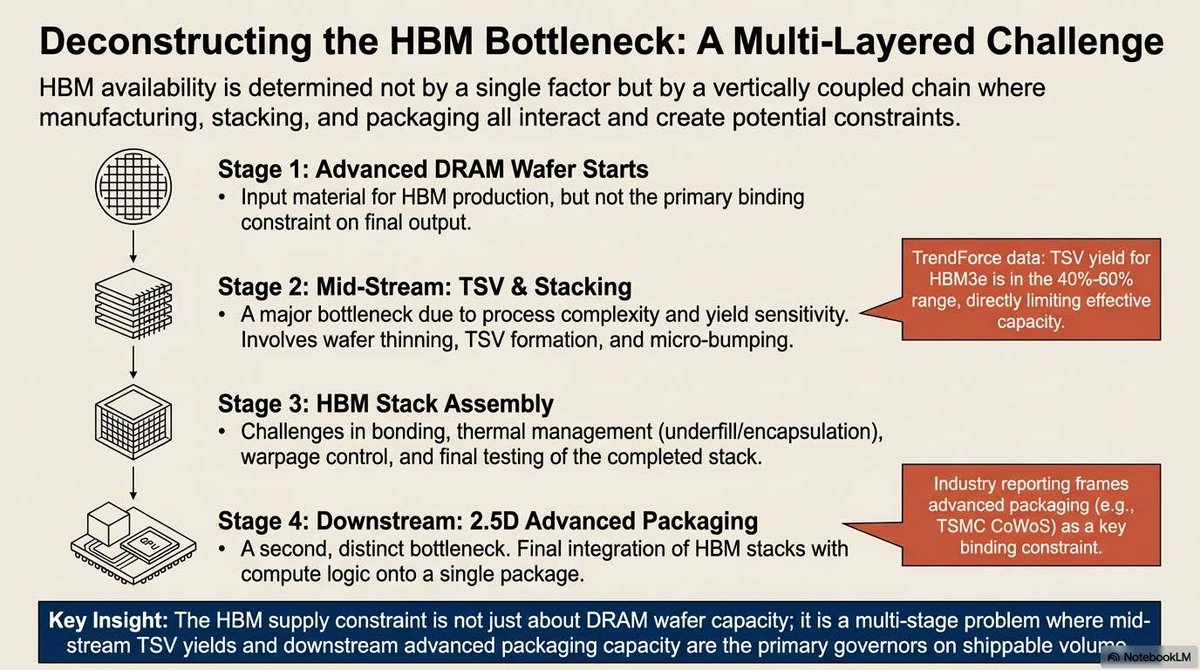
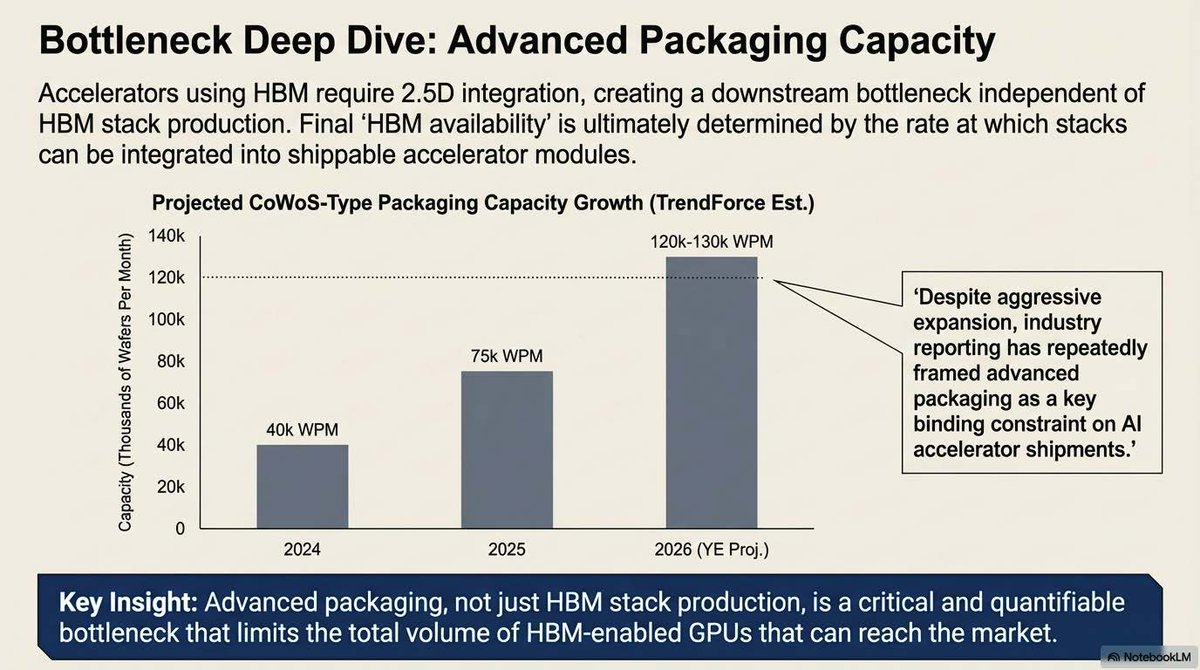
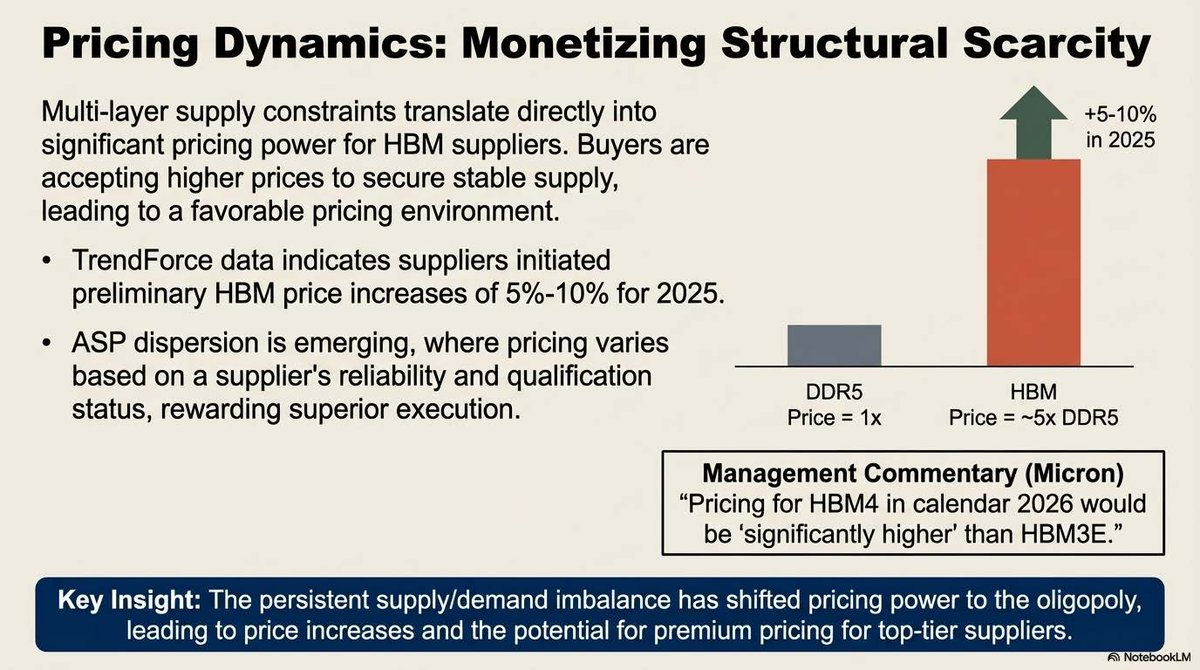
$TSMC $AMKR $NVDA $AMD Advanced Packaging: AI Accelerator Bottlenecks and TSMC CoWoS Evolution