
Backup: @the_ICT_mentor2 ICT private mentorship available. All the videos & discussions about private topics from the ICT private forum. DMs are open
4 subscribers
How to get URL link on X (Twitter) App

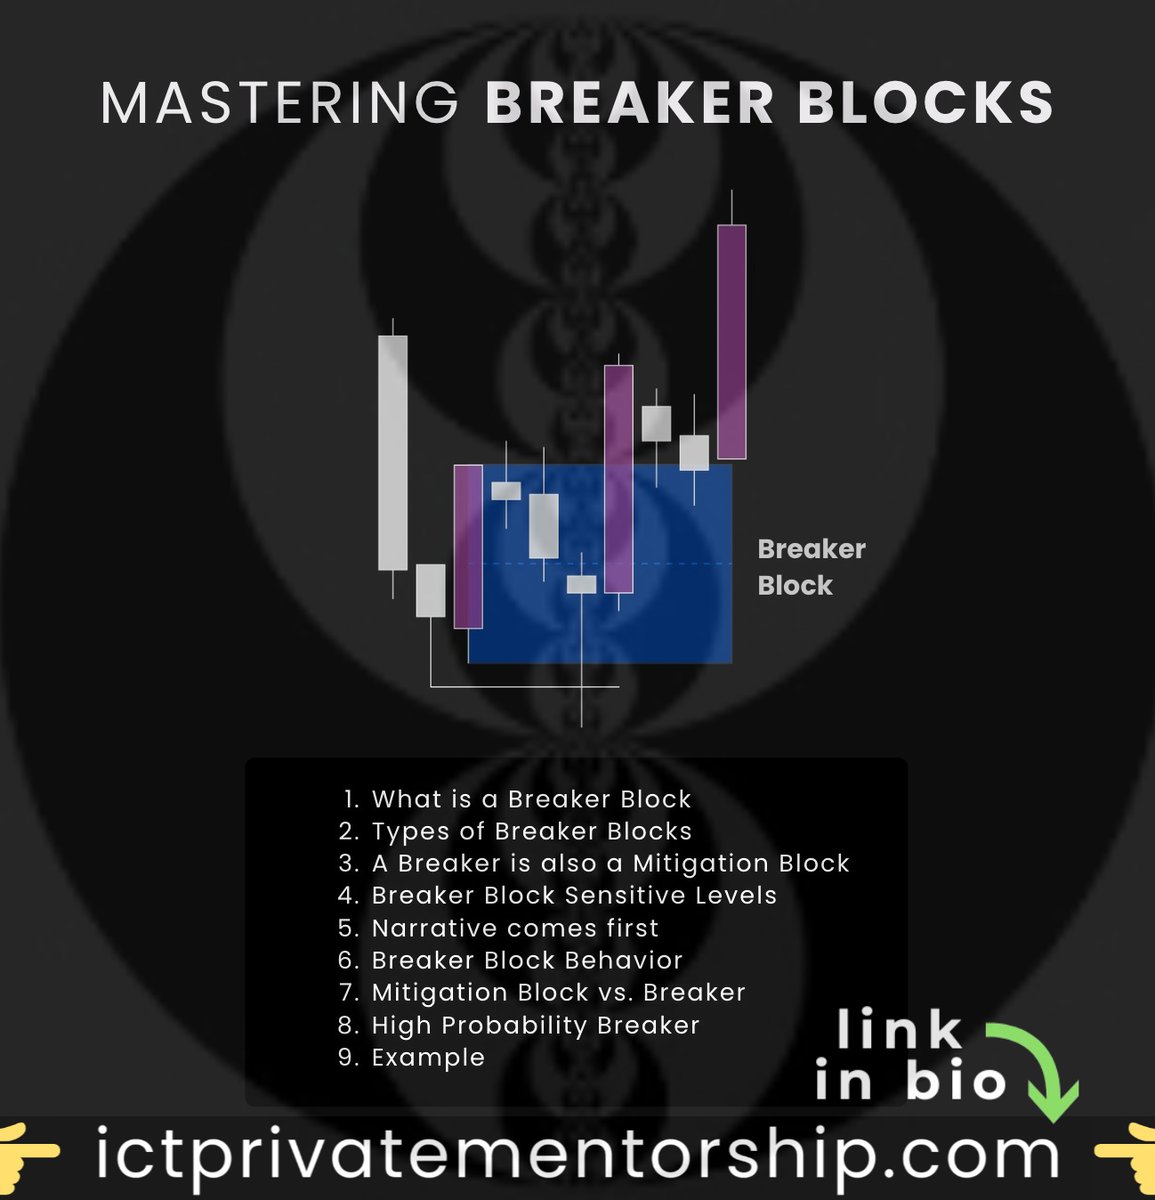
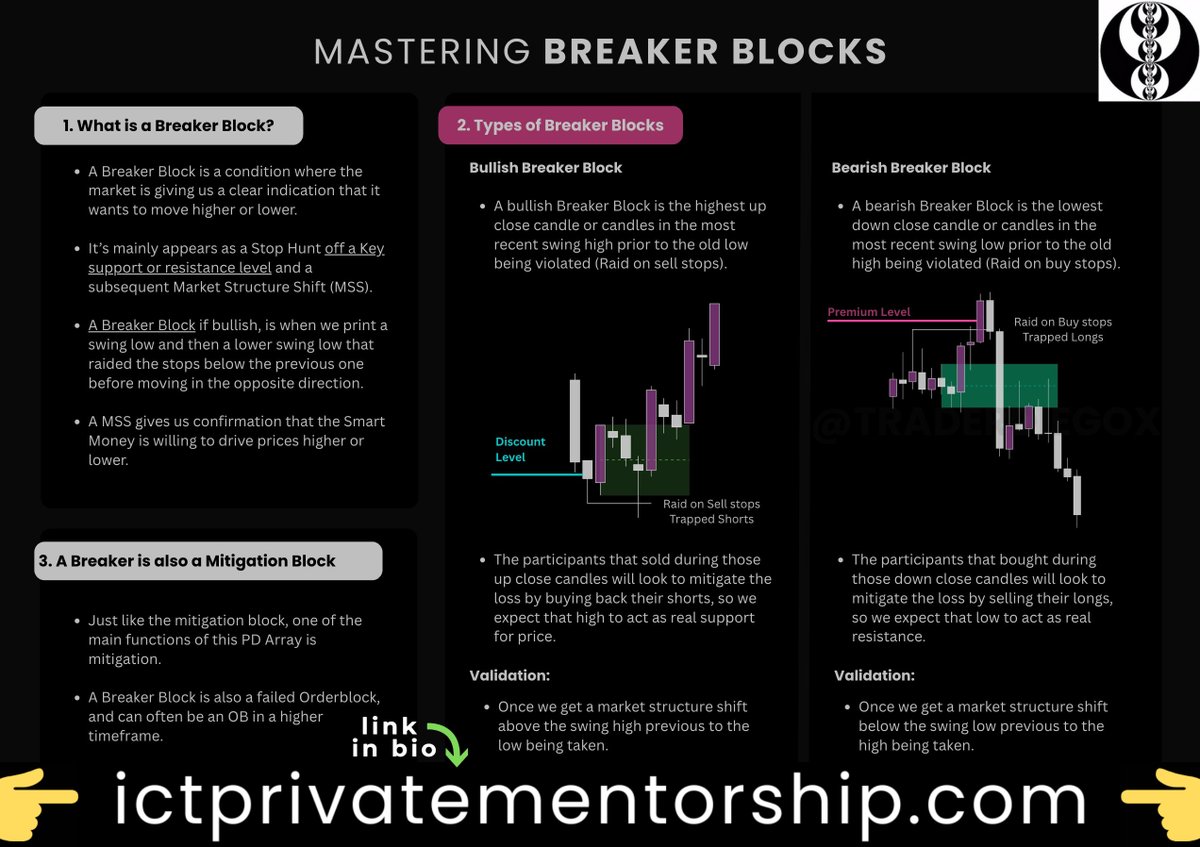
 What are ICT Breaker Blocks?

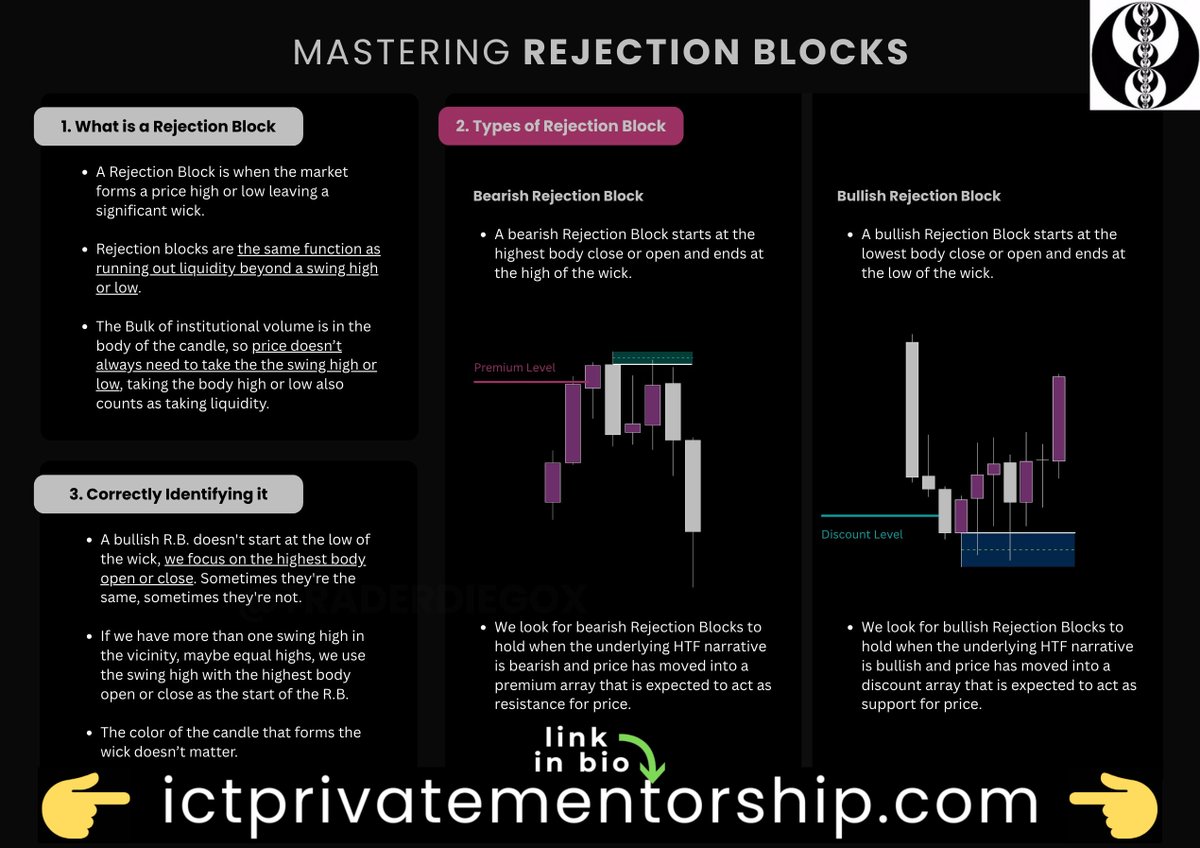
 • What is a Rejection Block?
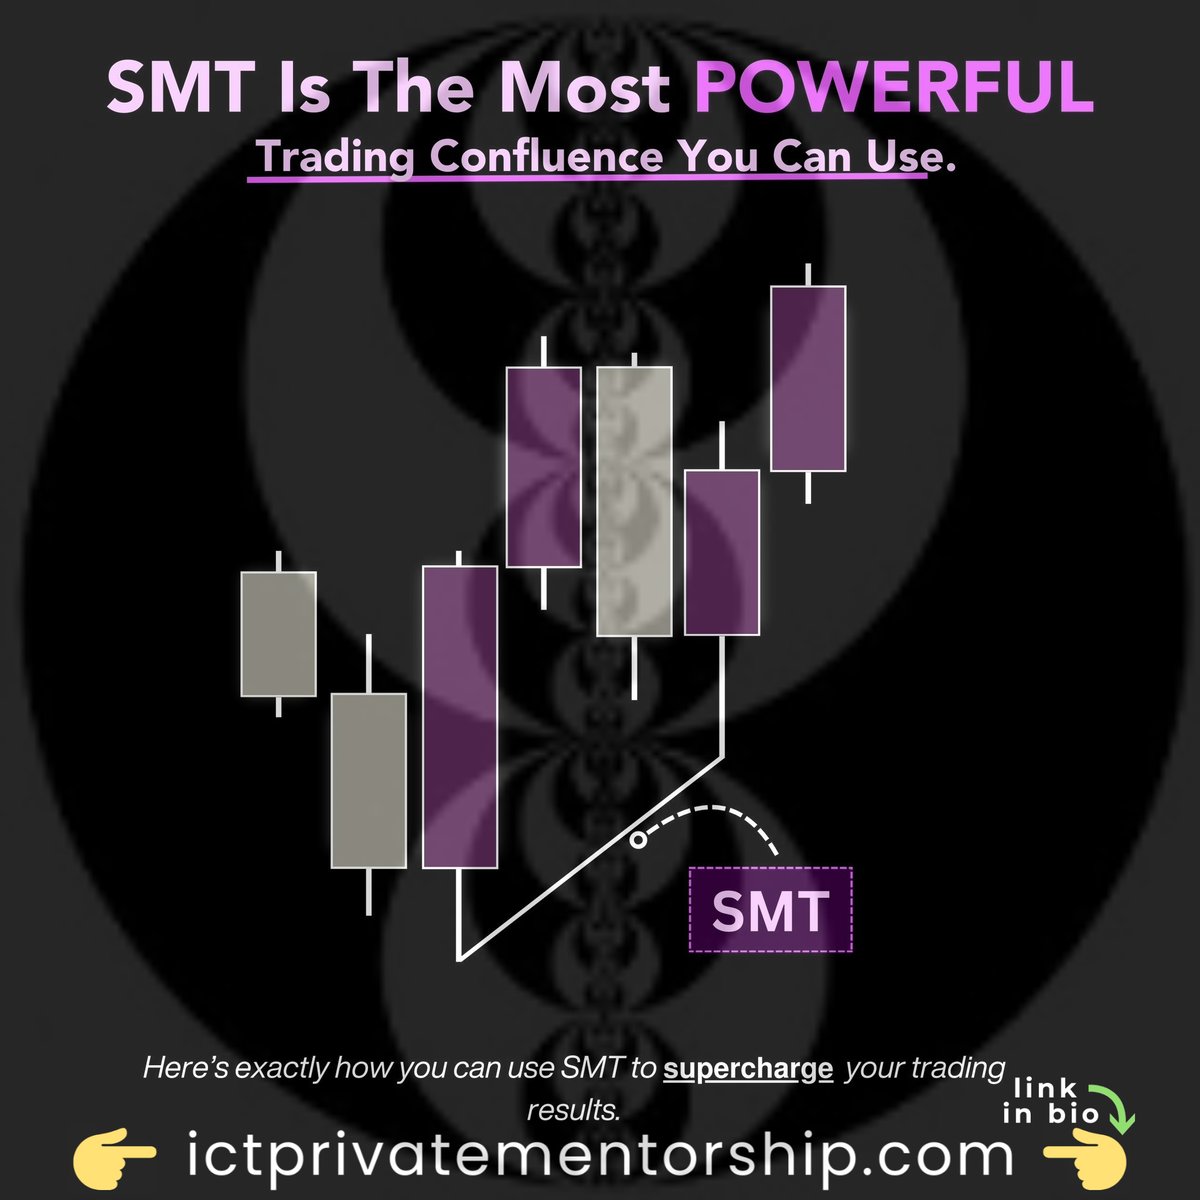
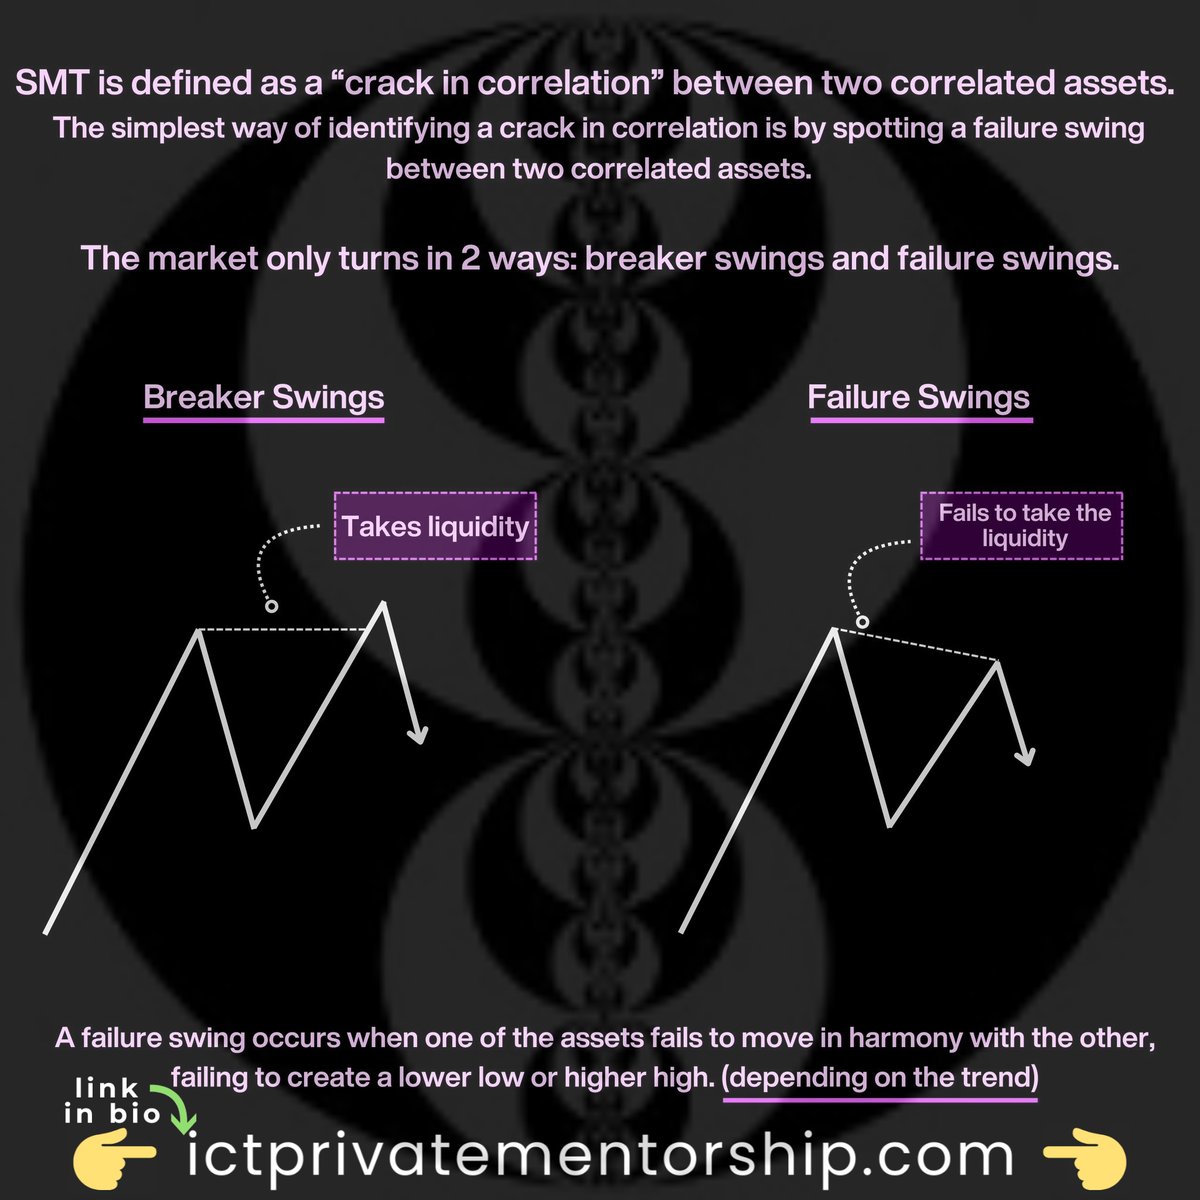
 • What are SMTs?

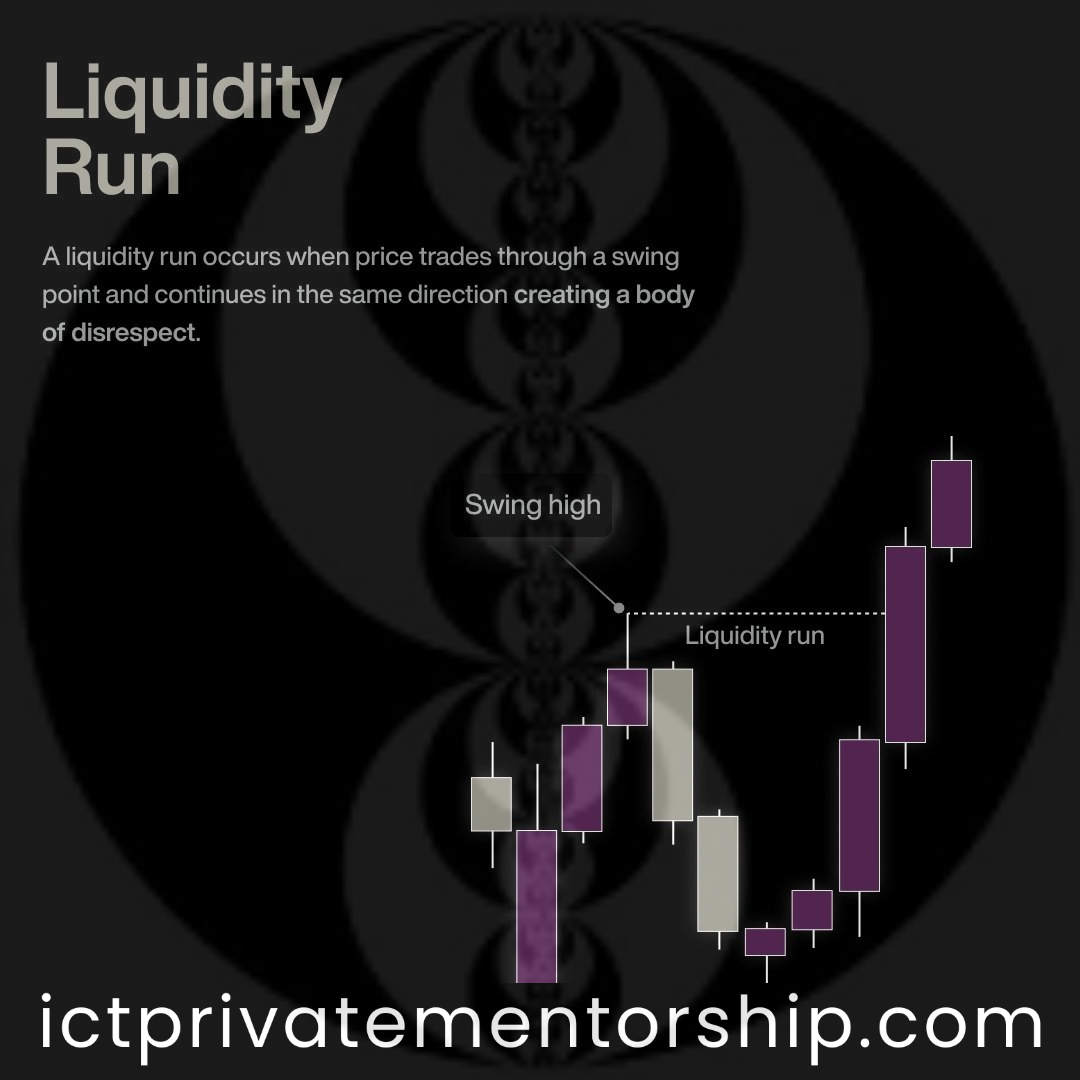
 Liquidity Run is when the market properly follows through with candle body closes after taking either a previous high or a previous low.

 Anticipating what the algorithm should seek next, whether it is to offer fair value (IRL) or if it is seeking liquidity (ERL), will allow the trader to visualize the next price swing before it happens.

 FVGs (Fair Value Gaps) have become the most popular ICT PD array, along with OBs (Order Blocks).

https://x.com/The_ICT_mentor/status/1937502904417407044
 Sell side of the curve on a Market Maker Sell Model (MMSM)

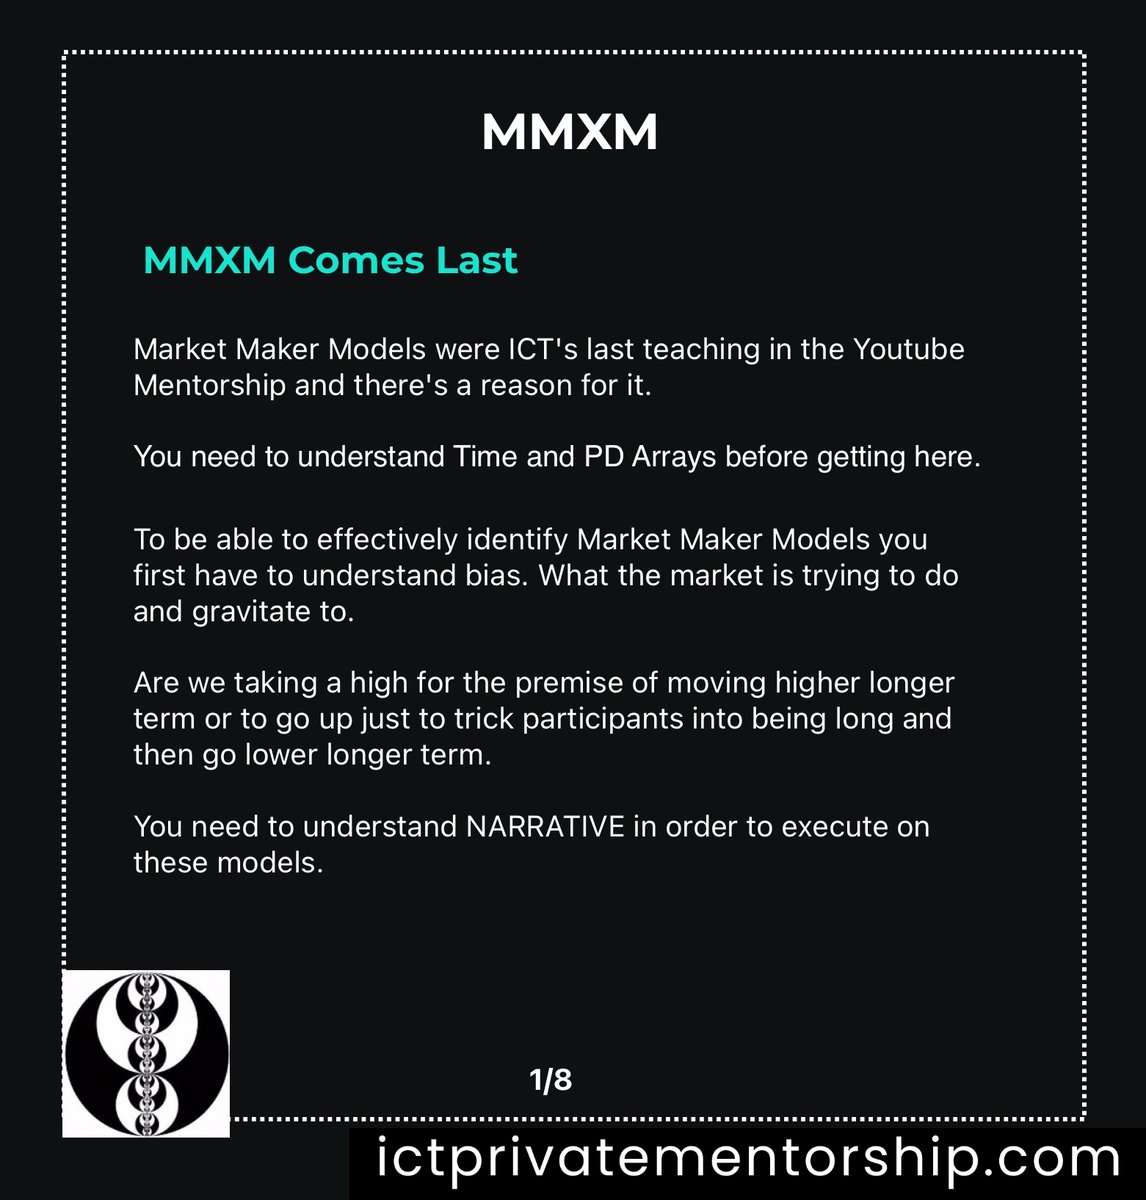
 In the public mentorship from YouTube, the MMXM can be considered as the final teaching.

 It is important to understand the relationship between these 4 market profiles:

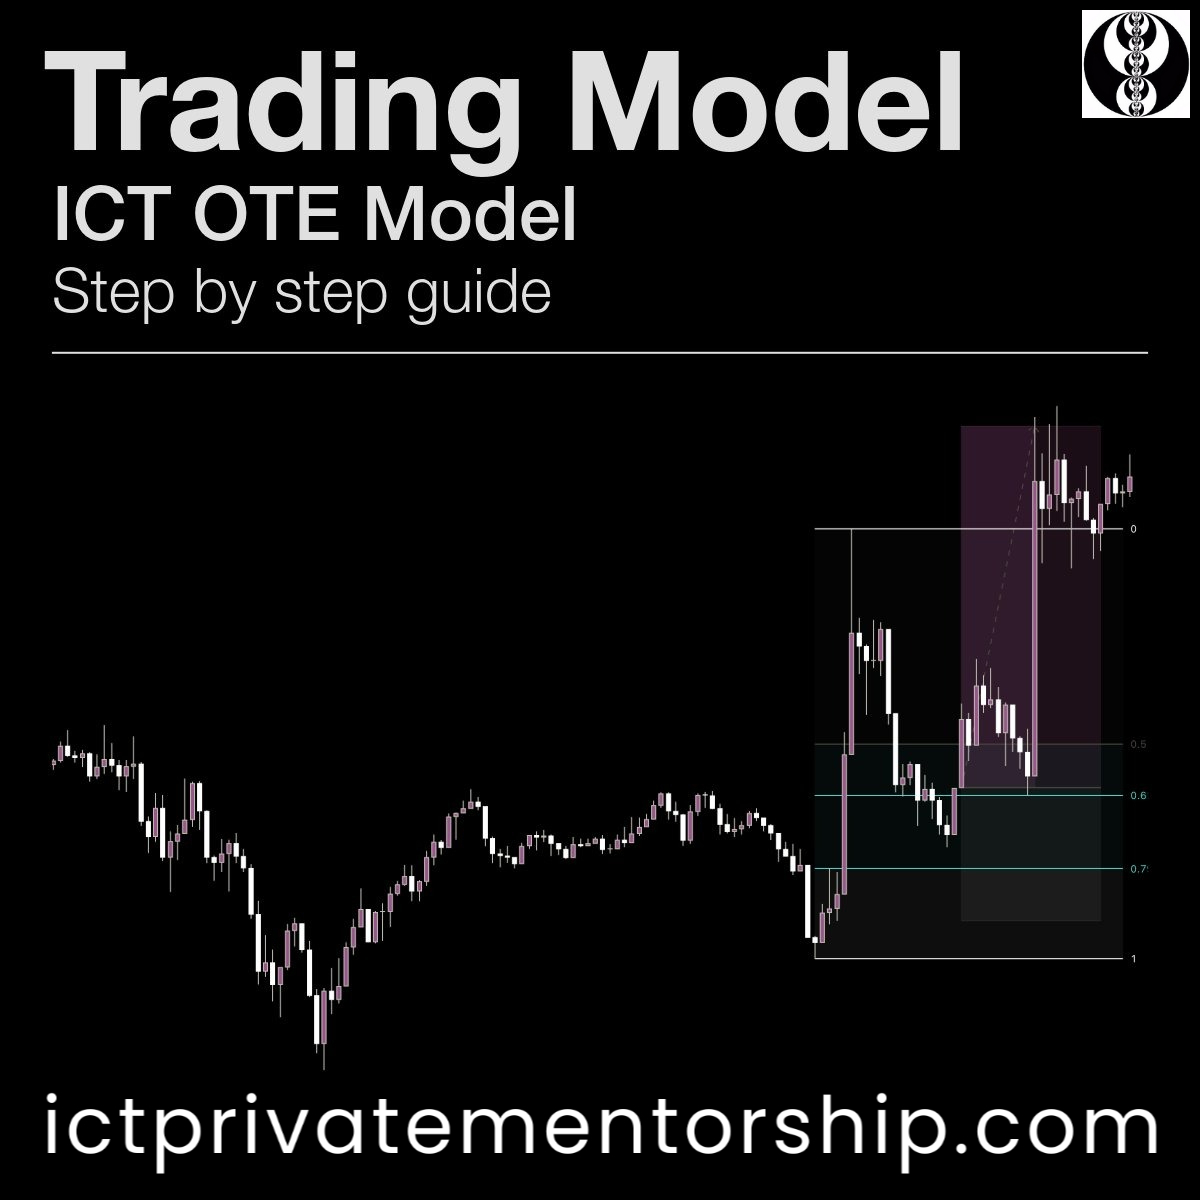
 The OTE model uses standard levels of retracements based on the current Dealing Range.
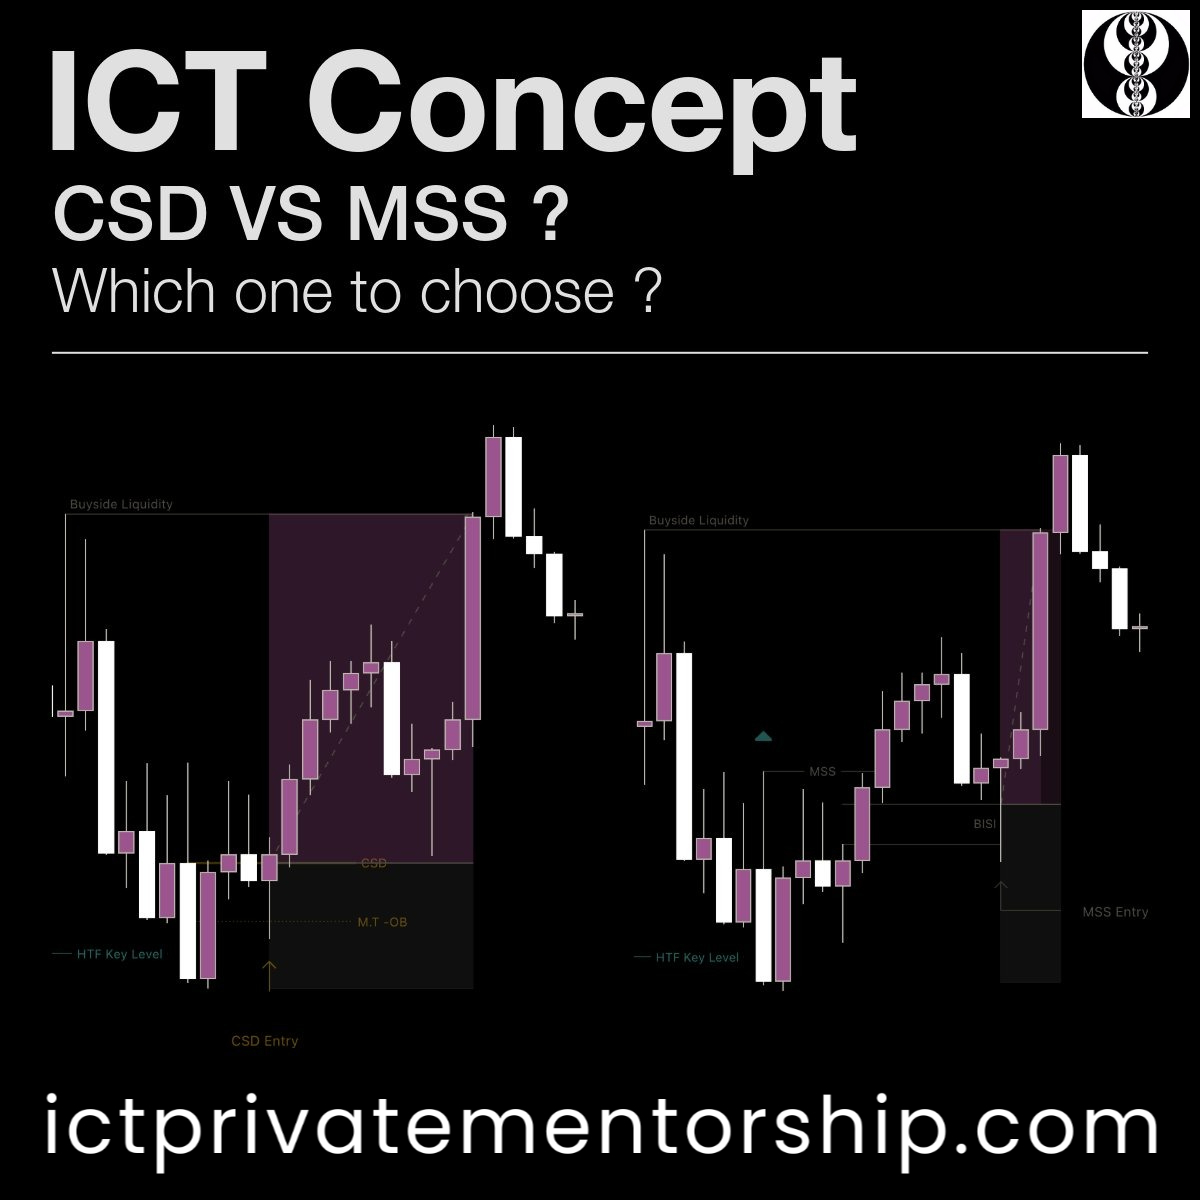
 In this thread we will focus mainly on the Change in the State of Delivery because many people are already aware of how a Market Structure Shift looks like.

 For intraday trading you always need to take into account what the day has done so far.


 These 2 images provide both the bullish and bearish variations for this particular model.
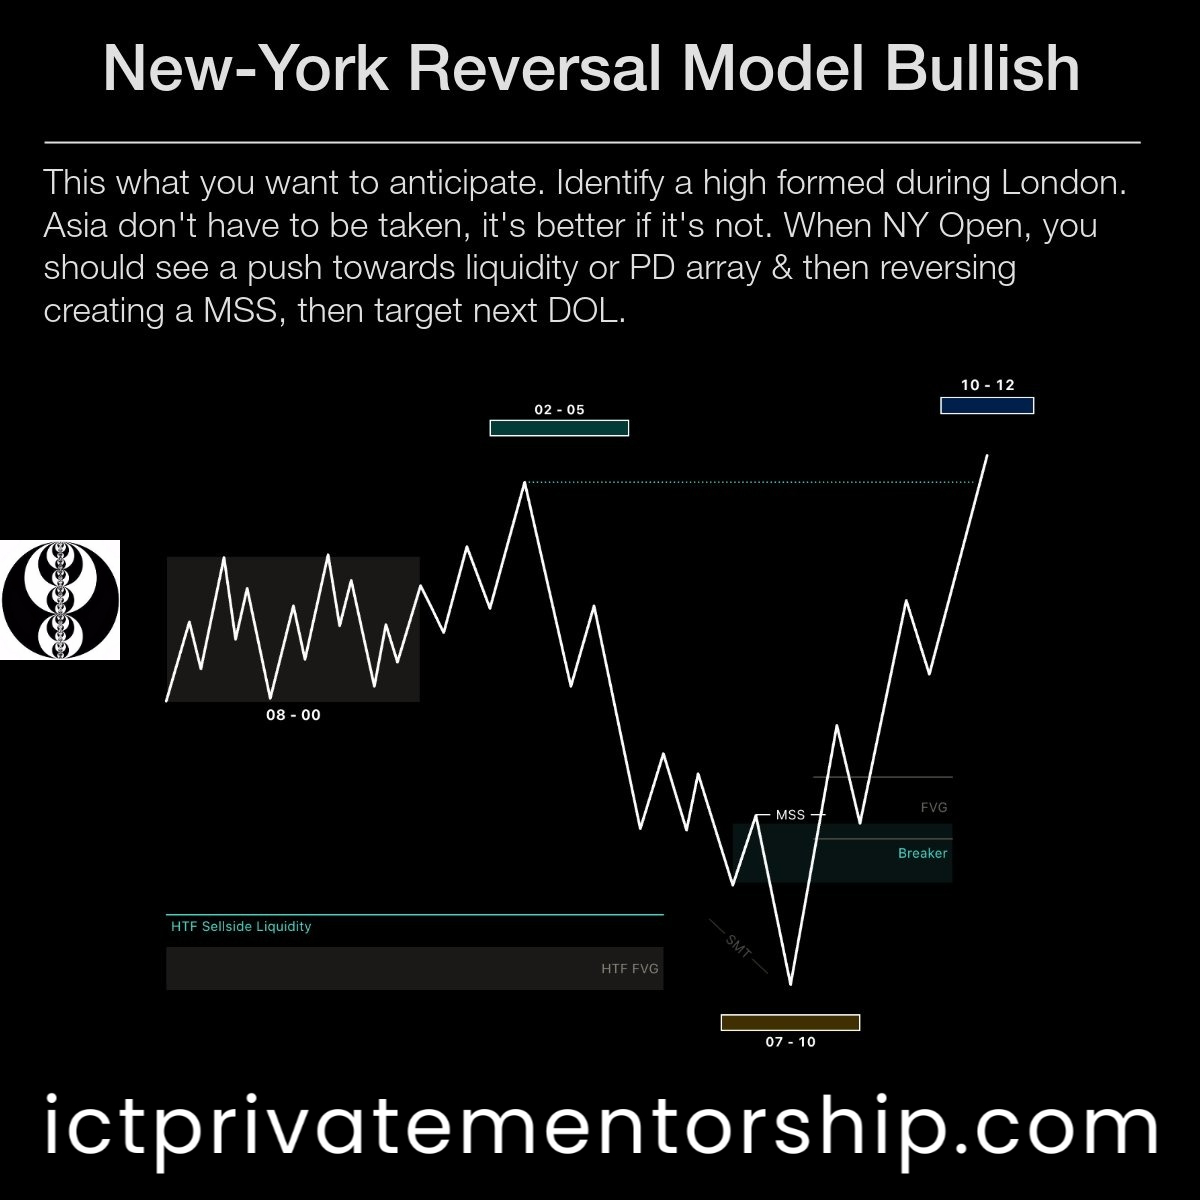
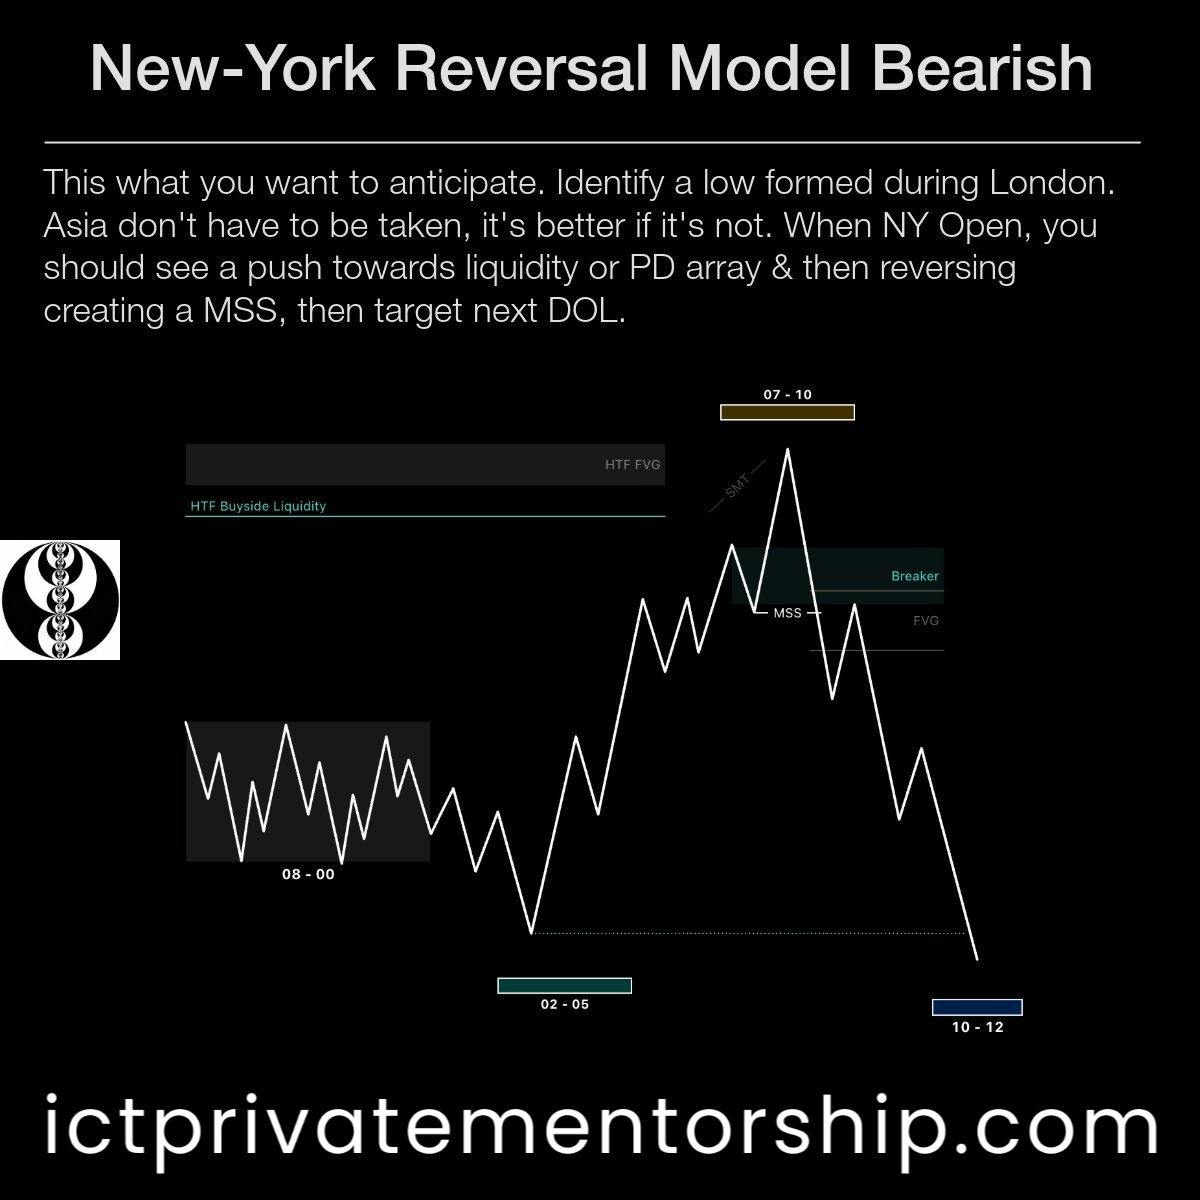

 The candle on the right side of the pictures represents a Daily candle.


 We can get a lot of information only from the Daily timeframe. Whether it is SMT divergences, liquidity grabs or imbalances.

 Breakers are considered among the most powerful PD arrays and the ones that create reversals and new trends.

 Price moves always begin with consolidation, and as ICT teaches, there is a sequence in how price changes its market profile.