JDK Analysis 🇪🇺 Profile picture
Technical Analyst • Order Flow & Market Profile • Breaking down auctions & execution • Always improving • Views are my own. Not financial advice.
Jun 5 7 tweets 4 min read
$BTC 📈

What now??🤔

🧵 Here’s a thread on what happened, and why now is probably not a good time to start panicing 👇

We can start with the HTF: Support is clearly closing in, while price is moving into technical levels we typically only see around bottoming structures. Image 2/7 The HTF gives us context, where price stands relative to historic performance and behavior.

But without MTF structure and volume, that context is incomplete: we need to tell whether BTC is being accumulated or distributed: weak low v. strong bottom.
Apr 20 5 tweets 4 min read
⚠️Very Important $BTC Update!

That was a 4th fakeout above range high.

And the base case remains;
Given the current structure, this still looks like short re-accumulation, not the kind of strong bottom we usually see before a major sustainable trend reversal!

Why is that? Here’s why👇

Strong bottoms after a prolonged downtrend take time to form! They’re not single events, they’re processes.

Large players can’t just “buy the bottom” like we as a retail trader can. If you’re small, you click buy and you’re in the position - simple.

But when your size is big enough to move the market, that approach doesn’t work!
At any given price, there are the same amount of buyers and sellers (by volume). You can’t buy if no one is willing to sell to you.
If you slam large buy orders into thin liquidity, you just push price higher and end up filling at worse and worse prices. So if you want to go long with large size you need;
- Liquidity to enter (sellers willing to sell into your bids)
- Time to build positions
- Trapped participants to trade against (easy liquidity)

That’s why you often see:
→ Price moving back and forth within a range over time.
→ Repeated sweeps and fakeouts of the lows with volume drying up.

This is liquidity engineering: 👷
Price is intentionally driven into areas where liquidity is concentrated, typically where stops cluster and breakout traders chase.
At the lows of a range, this includes stop-losses from longs and traders initiating shorts on the breakdown.
This influx of sell-side liquidity provides the necessary counterparties for larger players to open longs.
Rather than chasing price higher, they position limit buy orders below the range low, absorb the incoming selling pressure, and accumulate into that flow.
As the selling is absorbed, price stabilizes and often reclaims the range quickly, signaling that demand is in control (fakeouts of range low).

This process allows large participants to build meaningful long exposure without aggressively moving price against themselves.

A true bottom usually shows:
Multiple failed moves lower with strong volume and clear rejection. With each sweep, volume typically starts to dry up, meaning less and less liquidity is available to trade against. That’s when you know sellers are getting exhausted.
Only then do you usually see structure shift and price start breaking bullish.

Until then, this kind of price action leans more toward long-accumulation there is likely no a clean reversal.

What we’re seeing now is the complete opposite:
Price keeps testing the range high and getting rejected back into the range → buy-side liquidity above the highs is being absorbed to build short exposure.

Supply is fully in control as of now!

With each push higher, volume declines -> participation on the breakout is drying up (bearish).

At the same time, price is putting in higher lows:
→ upside liquidity is getting worked
→ downside liquidity is stacking up (HL)
Those stops below will become market sell orders later, providing the fuel for a sustained move lower.

You do you, but for me current structure could not be more obvious. I currently hold a fully secured short from the 4th range high fakeout (posted live) and if we get a 5th sweep I get stopped at BE and simply watch the reaction again. Another fakeout = another short.

Very simple!

One thing is clear; Given current structure, I will NOT miss the move towards range low should we get that move! Risk is managed well!

(NFA!) #Bitcoin #BTCImage *
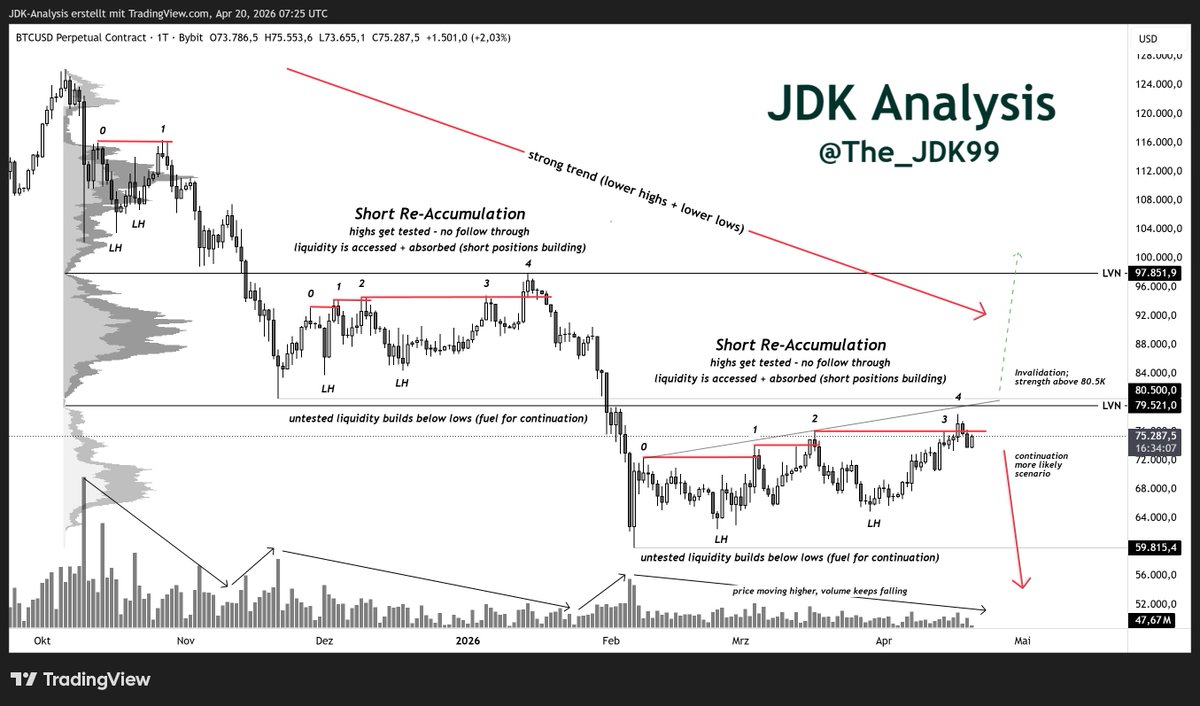
That should clearly be labeled "HL" (higher low), not "LH"! Image
Nov 20, 2025 8 tweets 5 min read
🧵 Here’s a deep dive into the tools and terminology I use every day 🔍

How the market really works.
Why price moves.
What OrderFlow is.
...

👇 1/ The Basis: Auction Market Theory (AMT)

Before charts, indicators, or signals, you must understand the auction, because price is simply the output of buyers and sellers negotiating value.

Price moves up and down to locate the levels where buyers and sellers agree.
Every tick you see is the result of a continuous two-way auction, with both sides testing levels until value is accepted.
OrderFlow later shows you how this process played out in real time.

Two Core Market States
1. Balanced Market (Value)
In balance, both sides are active and willing. Price tends to revert to the mean because the market agrees on what something is worth.

2. Imbalanced Market (Discovery)
One side becomes aggressive and price gets pushed away from value
A trend forms when aggression continues. The market is searching for a new area of agreement.
Imbalance is the market saying: “This isn’t fair value anymore, let’s go find it.”

Price spends most of its time in balance
… and occasionally breaks into imbalance to discover new value.

This simple mental model is the foundation for everything that follows; order flow, volume profile, market structure, and trend behavior all emerge from this basic auction process.Image
Aug 7, 2025 6 tweets 2 min read
🧵 Understanding CVD (Cumulative Volume Delta):

You will often see me use CVD for key level confirmation or trend/momentum evaluation.

Thanks to its simplicity and visual clarity, CVD fits naturally into any trading system, and can be directly used.

Here is how it works ⬇️ Image 1/5

Before we dive into CVD, remember it’s not a standalone indicator printing you money.

It’s meant to be used after you’ve done your analysis and marked your key levels.
Once price reaches your area of interest, CVD helps confirm whether your trade has real backing or not..