Tradable Astronaut Profile picture
My personal trading journey & insights │ Not Financial Advice │ Using The AI Terminal to catch big regime shifts šŸ‘‰ @AionAnalytics : Code ASTRO for 50% off
Apr 17 • 8 tweets • 3 min read
While everyone is celebrating the rally someone just dropped $11M on $SPY puts.

Here's what I'm seeing. 🧵 $SPY just rallied 13% in 13 days off the lows.

Last year after a similar explosive move the market went sideways and slightly red before continuing higher.

History doesn't repeat but it rhymes Image
Mar 28 • 12 tweets • 5 min read
$SPY just made new lows.

But someone dropped $3.1M in $SPY call spreads expiring Monday.

A brief pause before the next leg down?

Here's what I'm seeing 🧵 $UVXY broke out of its cup and handle today, up 12%.

Now sitting right at the descending trendline resistance from the November highs.

Rejection here = volatility exhaustion, market gets relief. Break through = more pain ahead.

Watching this level closely into next week. Image
Mar 25 • 12 tweets • 6 min read
$SPY is sitting on major support, VIX just got rejected at $30 again, and someone dropped $21M in $QQQ calls.

I've seen this exact setup before.

It was right before a 10% rip. 🧵 Everyone is modeling March 2025 ,support holds, bounces, then continues lower.

But the candle structure tells a different story.
Gap down. Capitulation wick. Next day lower but NO new lows. Then higher.

That's not March 2025. That's April 2025.

The actual bottom. Image
Mar 20 • 10 tweets • 5 min read
Today was the date I have been waiting for since January. 3/19.

Here is everything that happened today & what may next. 🧵 Image 
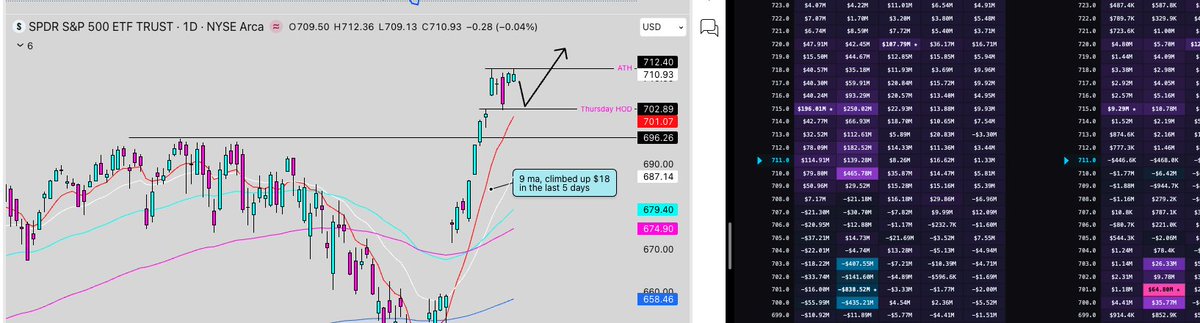
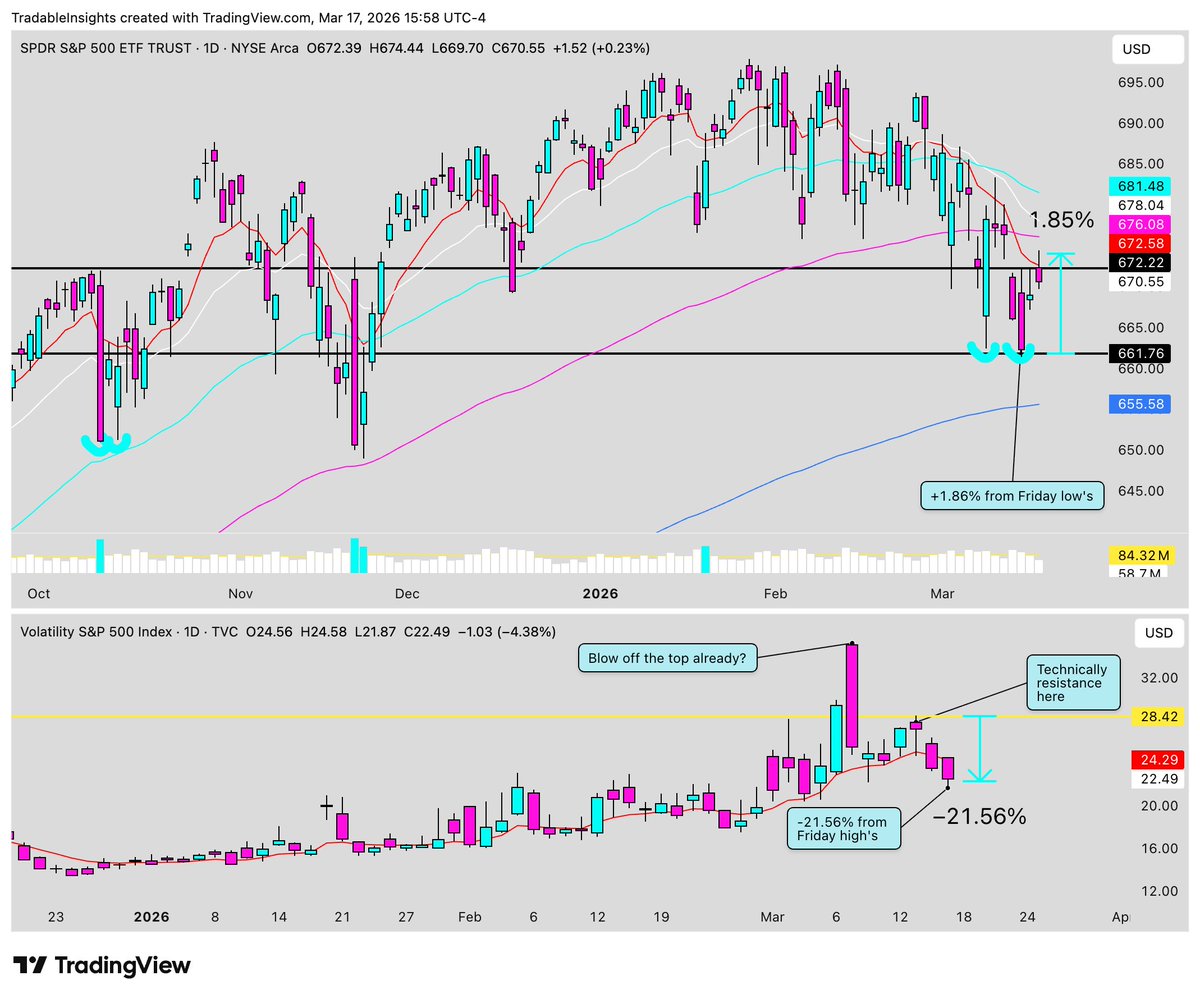
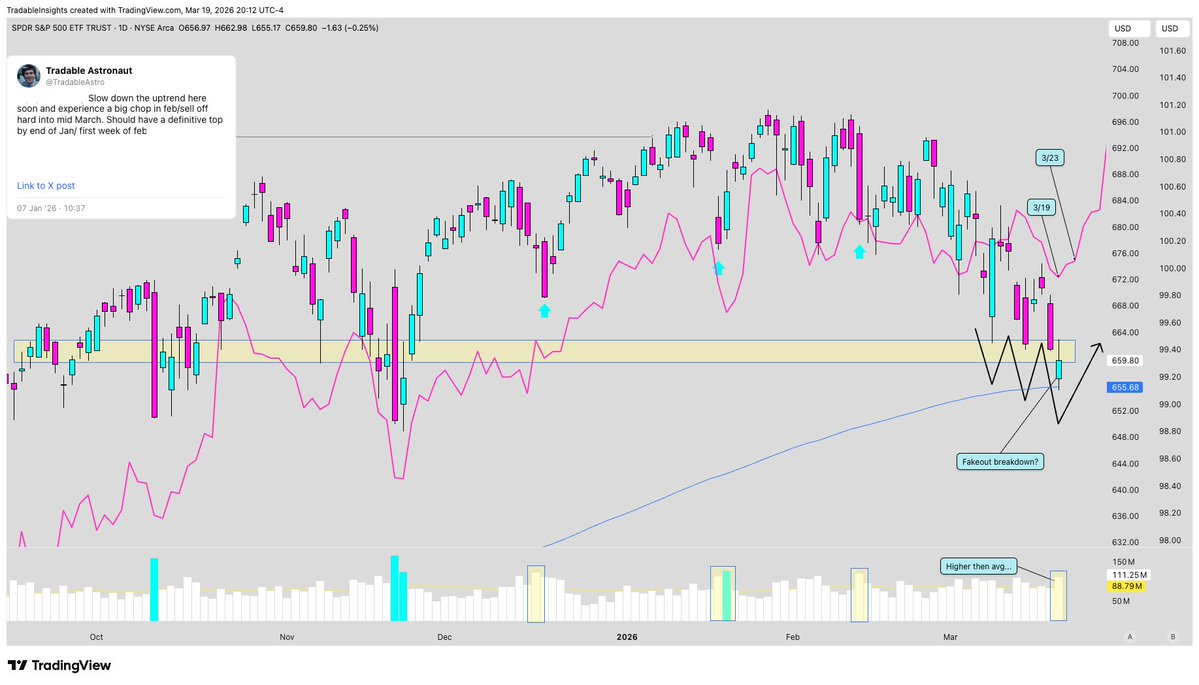
$SPY tagged the 200MA at 655.68 today & bounced.

Price faked below key support & closed back above at 659.80.

Volume spiked to 111.18M higher volume than average

Every prior major bottom on this chart had a similar volume spike like this.

We may have just seen the capitulation we have been waiting for.Image
Mar 18 • 9 tweets • 5 min read
Three months ago I said sell hard into mid March.

Tomorrow is that date. 3/19

And today the largest bullish flow I have seen in a while just printed at the lows.

Here is what I am watching. 🧵 Image 
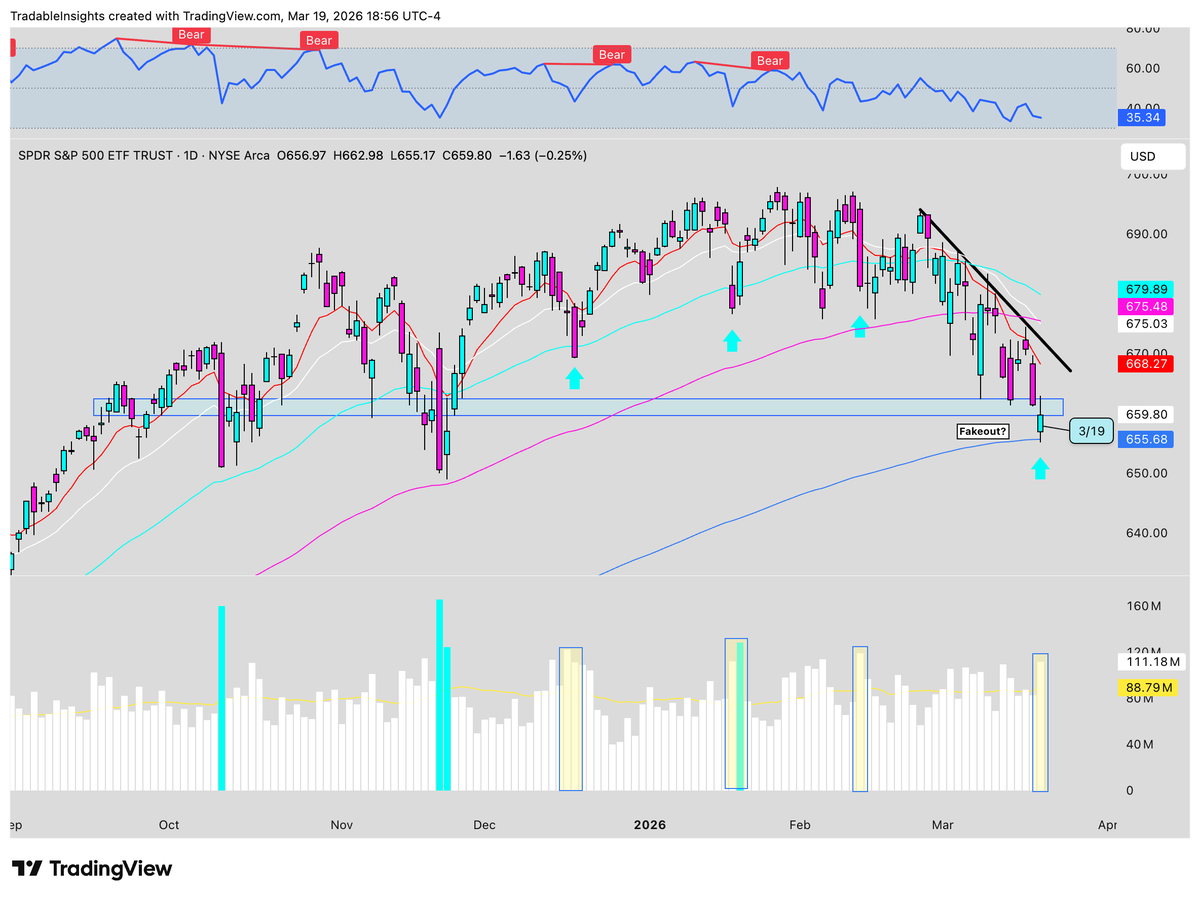
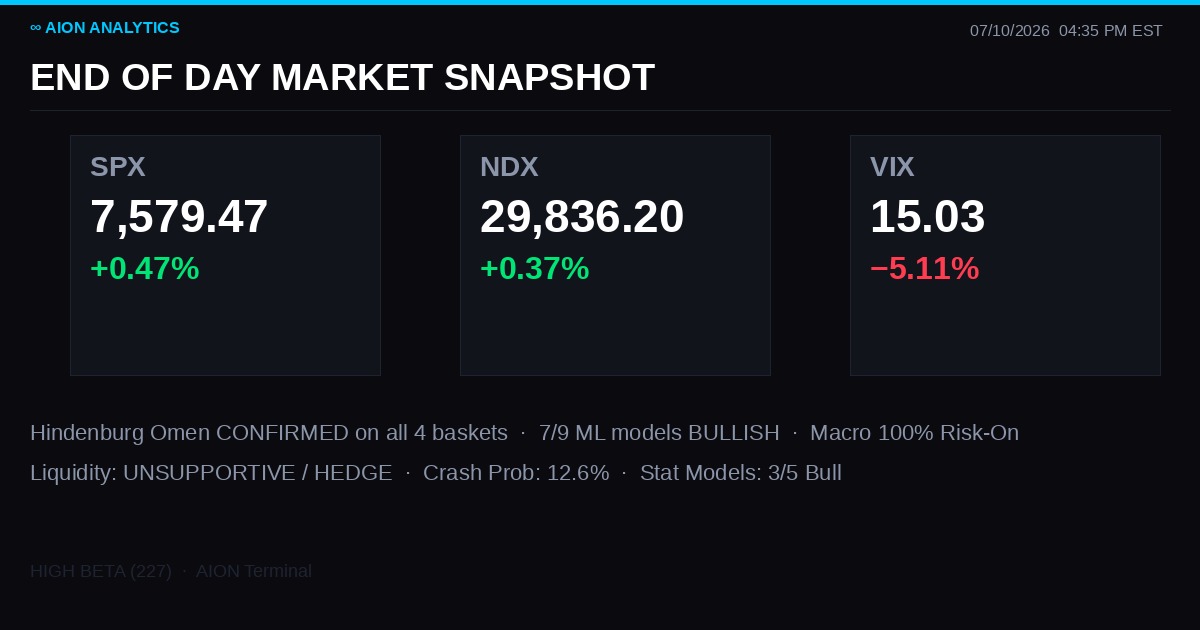
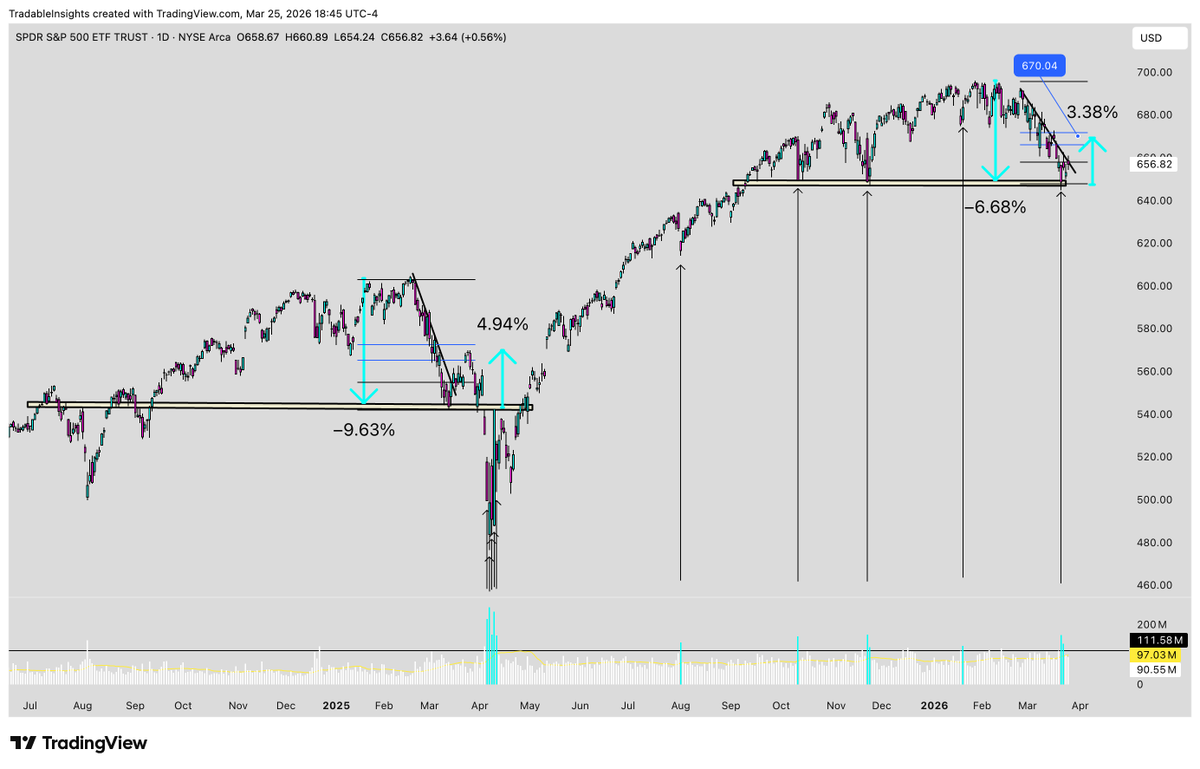
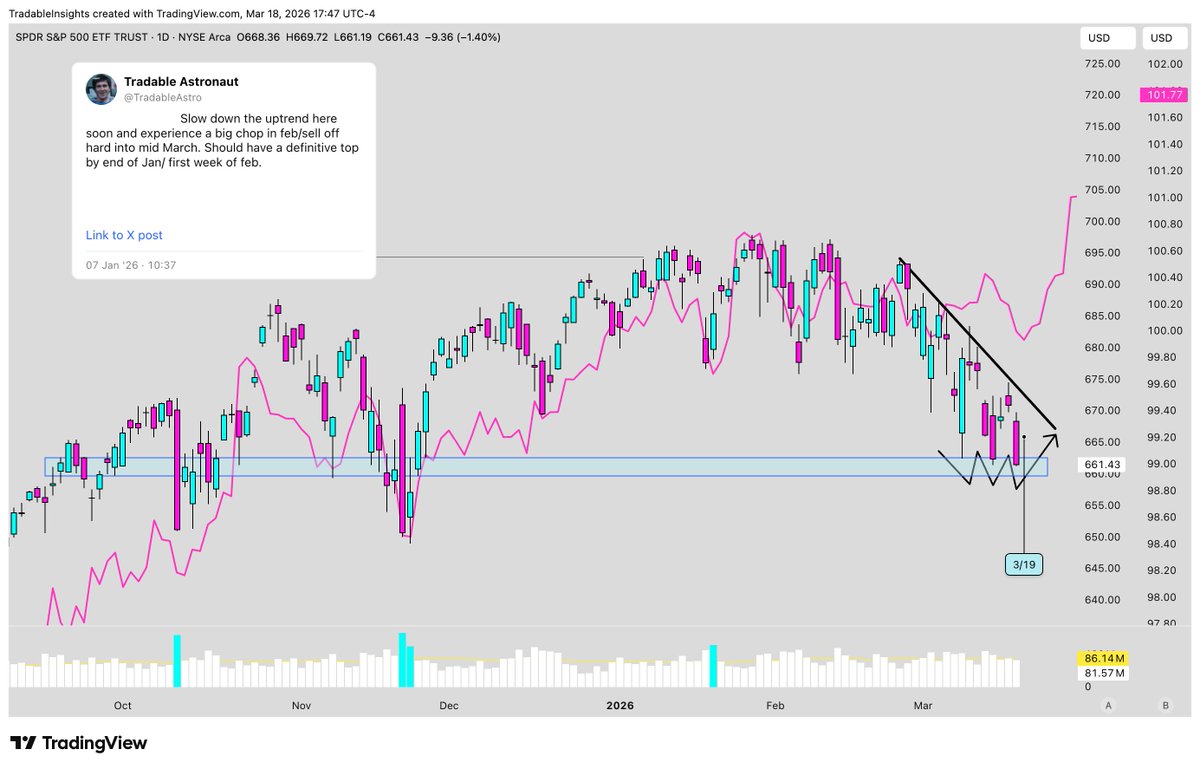
$SPY closed down 1.40% at 661.43 today.

The mini rising wedge broke down exactly as the chart suggested.
VIX bounced 12.16% to 25.08: right to the 0.5 fib as called out yesterday.

Price is now sitting on a key horizontal support level.

200MA at 655.64 right below.

But the forecast line is calling a bottom tomorrow March 19.Image
Mar 17 • 8 tweets • 4 min read
$SPY has FOMC tomorrow & the forecast puts in a bottom by 3/19.

Here is everything I am watching going into it. 🧵 Image 
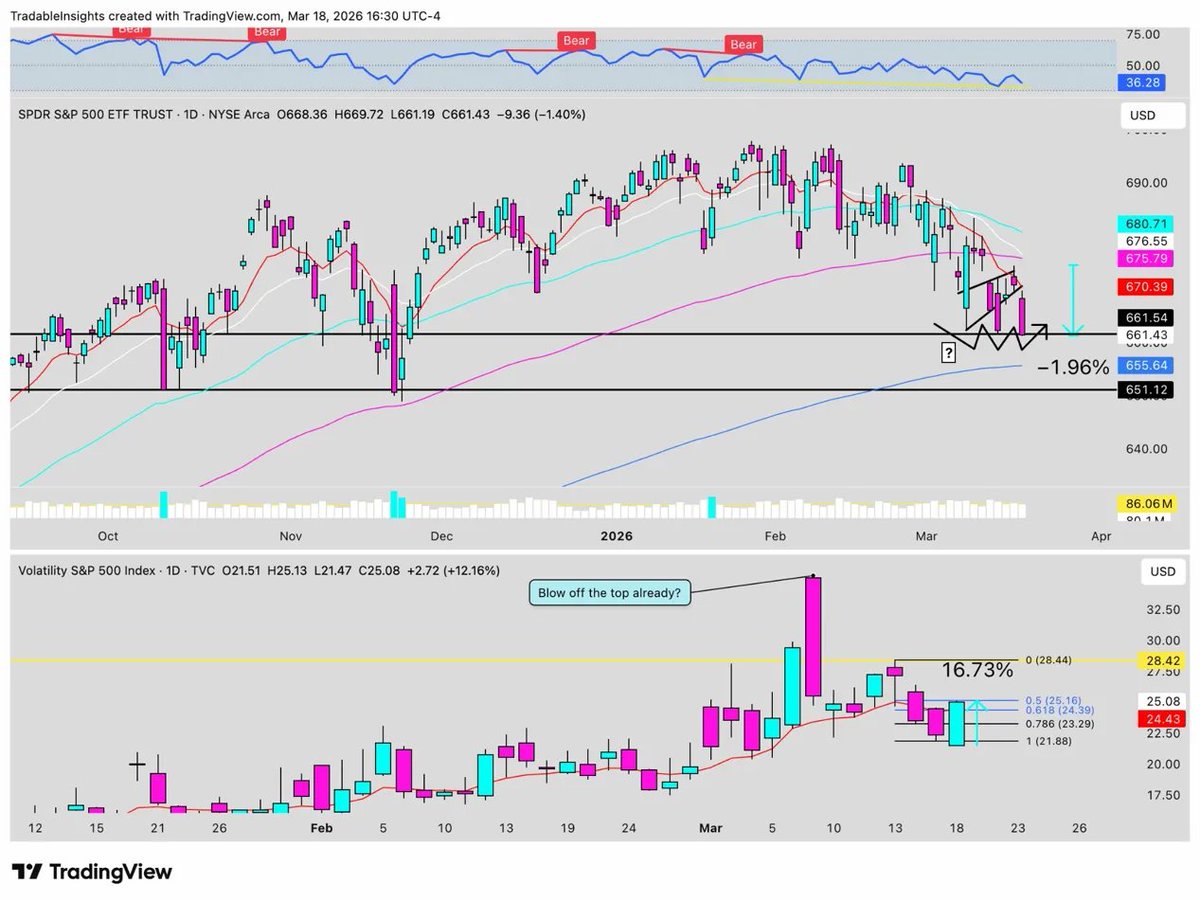
$VIX spiked to 35.34 and is now pulling back hard.

Down 5.48% today at 22.23.

Currently bouncing at the 0.618 fib.
Could see a bounce back toward $24.50 into FOMC tomorrow before continuing lower.

Markets get nervous into Fed decisions.

That chop is normal. Image
Mar 16 • 9 tweets • 4 min read
Someone dropped $265K on deeply out of the money calls on a space stock while the market was bleeding.

Now everything is lining up.

Let me show you what I found. 🧵 Image 
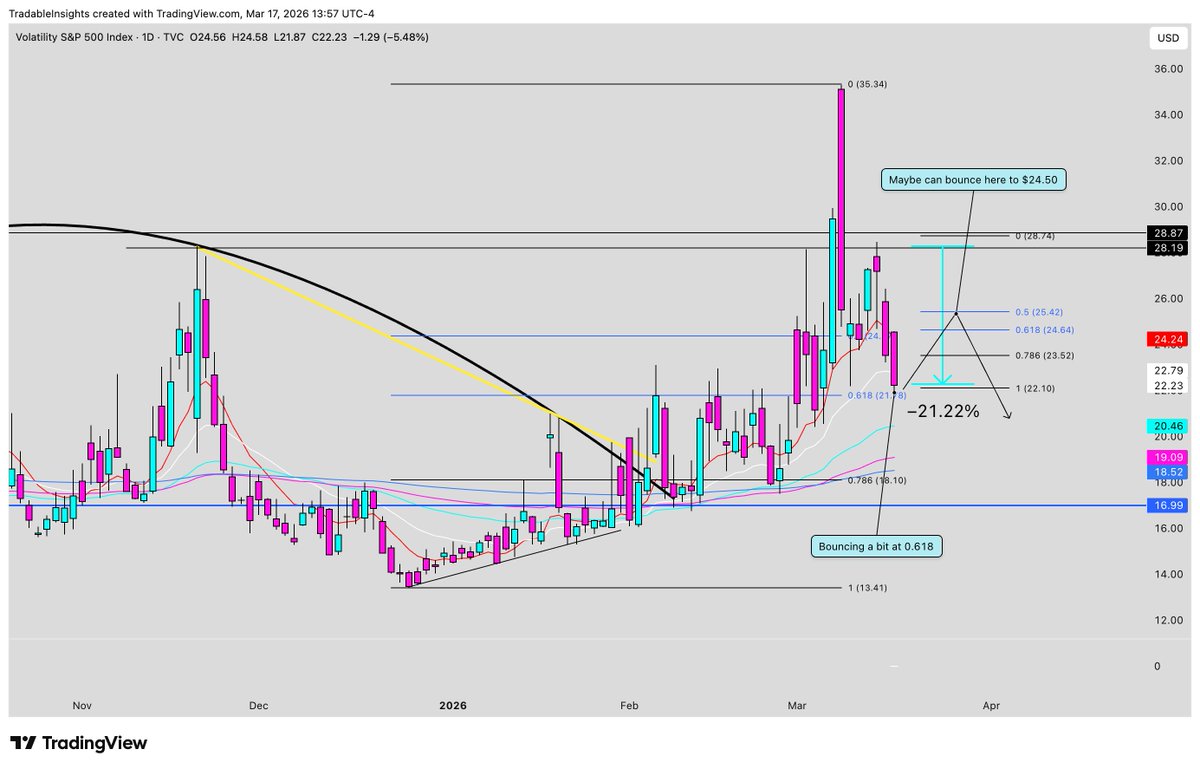
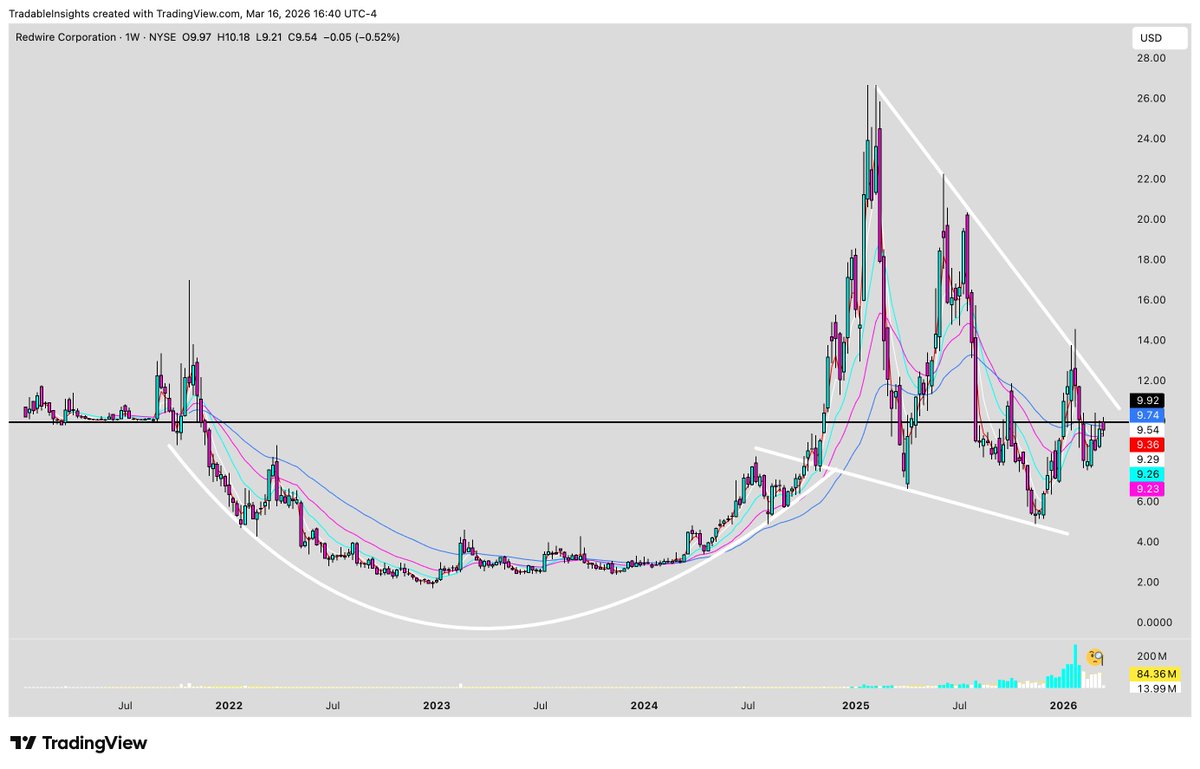
$RDW popped up on the @AionAnalytics index today with a score of 94 out of 1117 tickers.

Rank #88. Space profile. Strong Leader classification.

What caught my eye was the history.
Score of 25 on March 6. Laggard Zone.

By March 13 it was at 95. Strong Leader.

That is a full regime flip in one week on one of the worst tapes in months.Image
Mar 10 • 10 tweets • 4 min read
Today felt more like a relief bounce than anything else.

Every major bottom I have seen had one thing in common.

We still have not seen it yet. 🧵 Image 
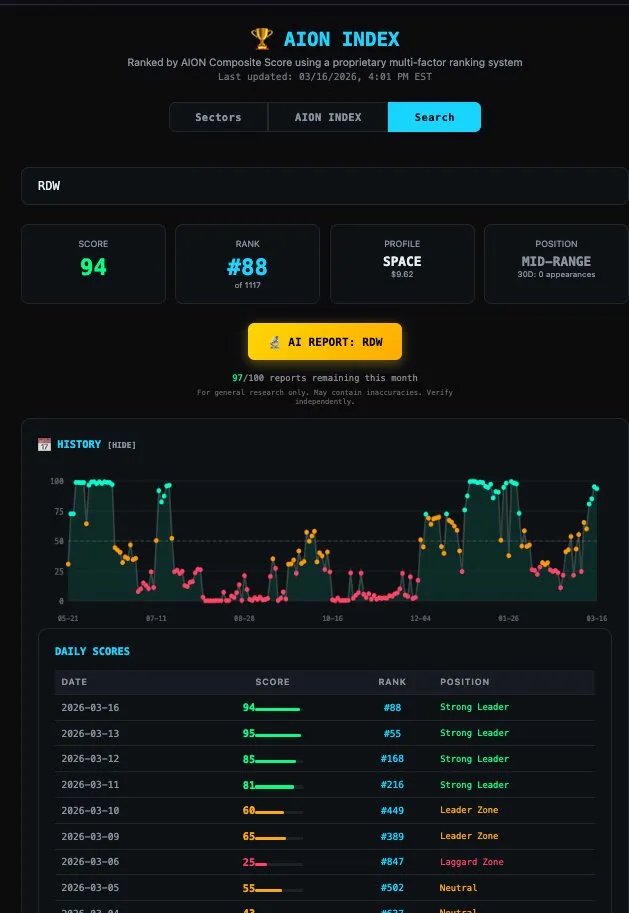
A high volume flush. A real capitulation day.

Look at every bottom on this chart going back to April 2024. Each one had a massive volume spike.

Right now? Volume is quiet.

Until that spike shows up the market has not made its case for a confirmed bottom. (for me)
Mar 7 • 9 tweets • 4 min read
The @AionAnalytics crash detection just hit 19.4%.

A week ago it was at 1%.

I have a puzzle to show you.

Let's put the pieces together 🧵 Image Here is the full spike in real time.
Feb 24: 2%
Feb 25: 1%
Feb 26: 1%
Feb 27: 1%
Mar 2: 2%
Mar 3: 4%
Mar 4: 7%
Mar 5: 10%
Mar 6: 19%

That is not noise. That is a trend accelerating fast. Image
Mar 13, 2025 • 7 tweets • 4 min read
Just a thought. 🧵

$SPY found an interim bottom after a -$66.36 drop from $459.35 to $392.99 which was on 3/15/2022

Today $SPY made a new low to make our drop -$63.55 from $613.23 to 549.68 which today is 3/13/2025

This was the beginning to the downfall in 2022, which was the first time $SPY had closed under the 200 day MA (it lasted 5 days) then had a strong rally for 3-4 days straight up.

We are currently on day 4 under the 200 day MA!

I believe we will see a real relief here soon. I do believe 2025 to be a rough year.

It is very hard to "time" a perfect bottom, which i don't think we are near. I believe an interim bottom to be found very soon. Could be next week, but tmr makes sense to me.

That is what I meant by my post previously. Which I was wrong on timing. I will not say the word bottom anymore as it is strong. But will use the word low.

Once again, this is still a scalpers market in my opinion!

"History doesn't repeat itself, but it often rhymes"

$SPX $QQQ $TSLA $NVDAImage
Image
Now with that being said we are in a scalpers market!

How does one trade this??

I have personally been trading $SPY / $SPX

how? Well for one I don't take trades until 30 minutes - 60 minutes until market open.

Then I have $SPX open with my daily supports/resistances in place.

Along with pre-market highs and lows.

Once I have those in place I start charting on 1 minute & 5 minute candles any sort of flags or wedges I may see.Image