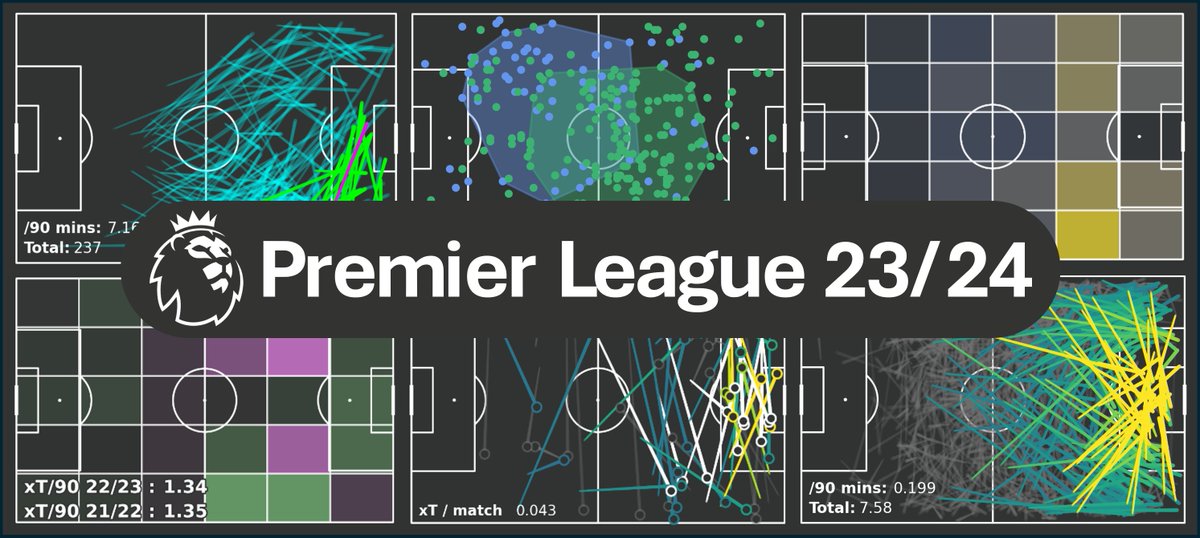
 Which players created the most threat (xT) from each zone of the pitch? (2/17)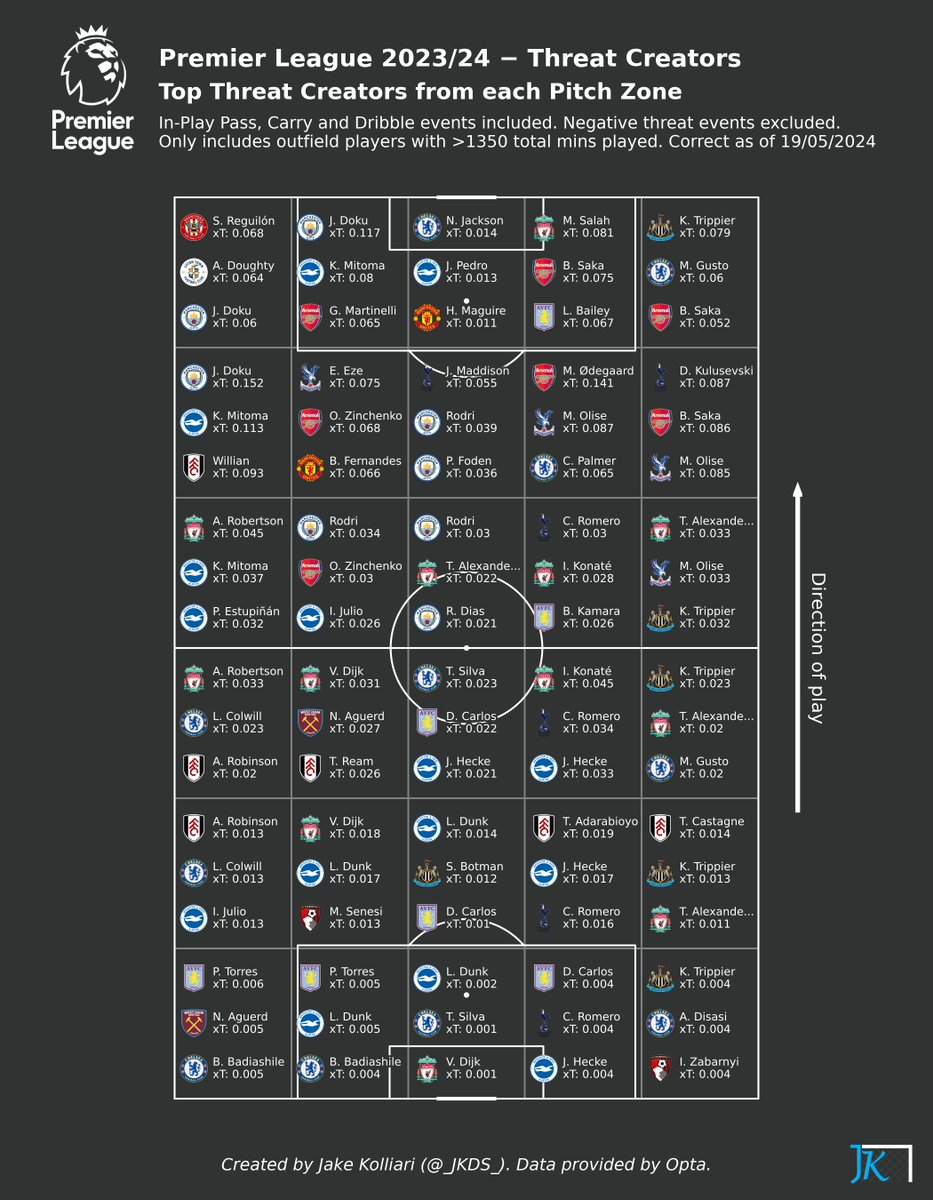
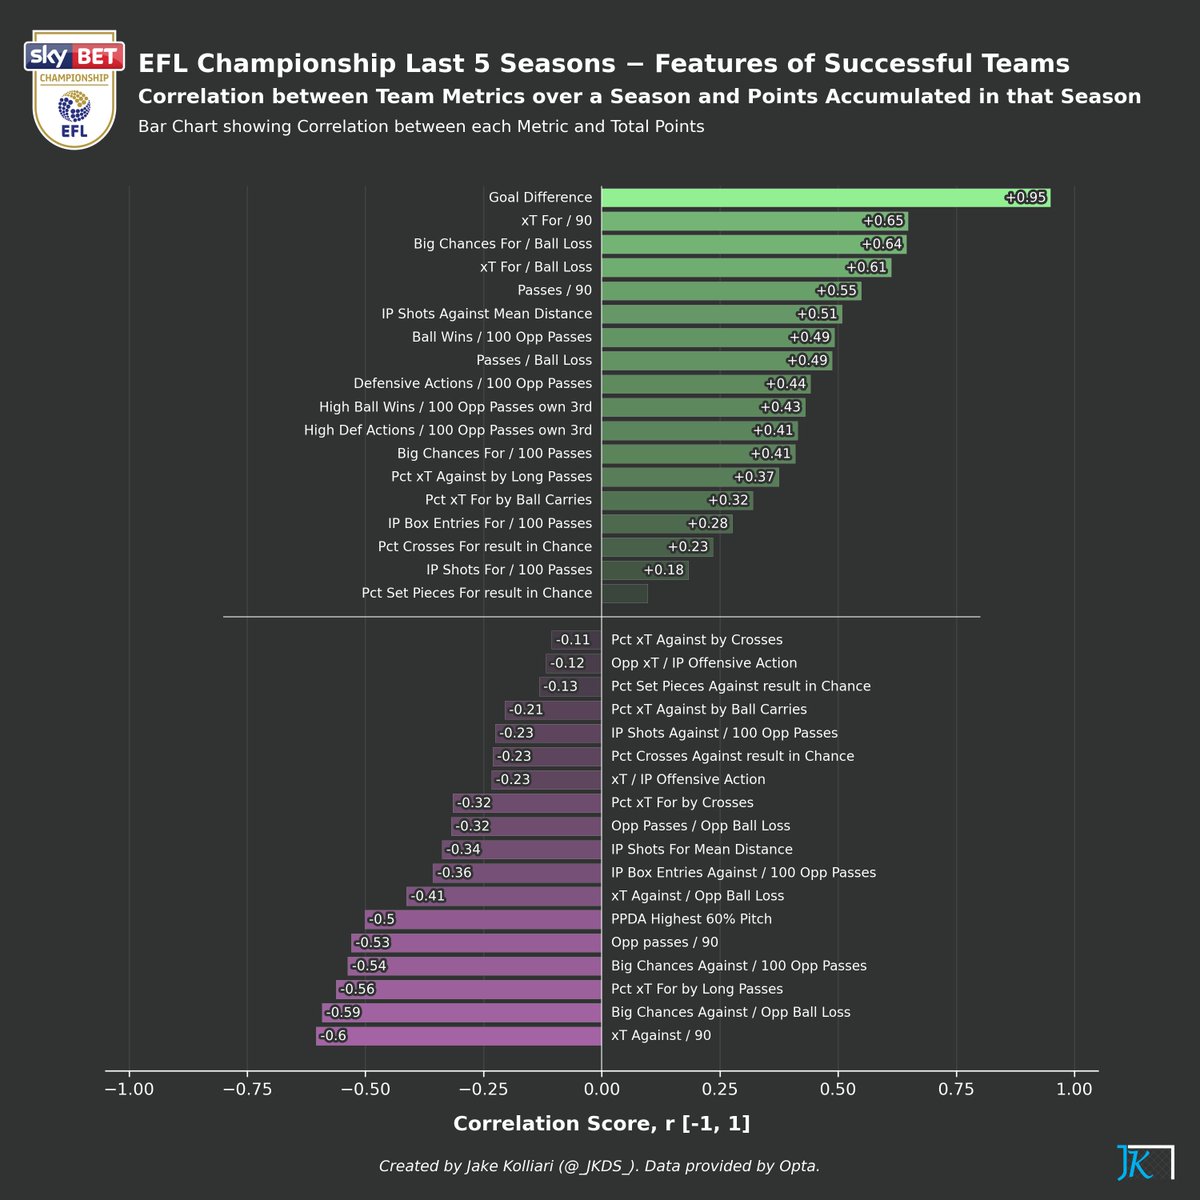 Having already completed the same analysis on the Premier League (using data from the previous 5 seasons), we will compare the correlation scores to understand the differences between successful Championship teams and successful EPL teams (2/7)
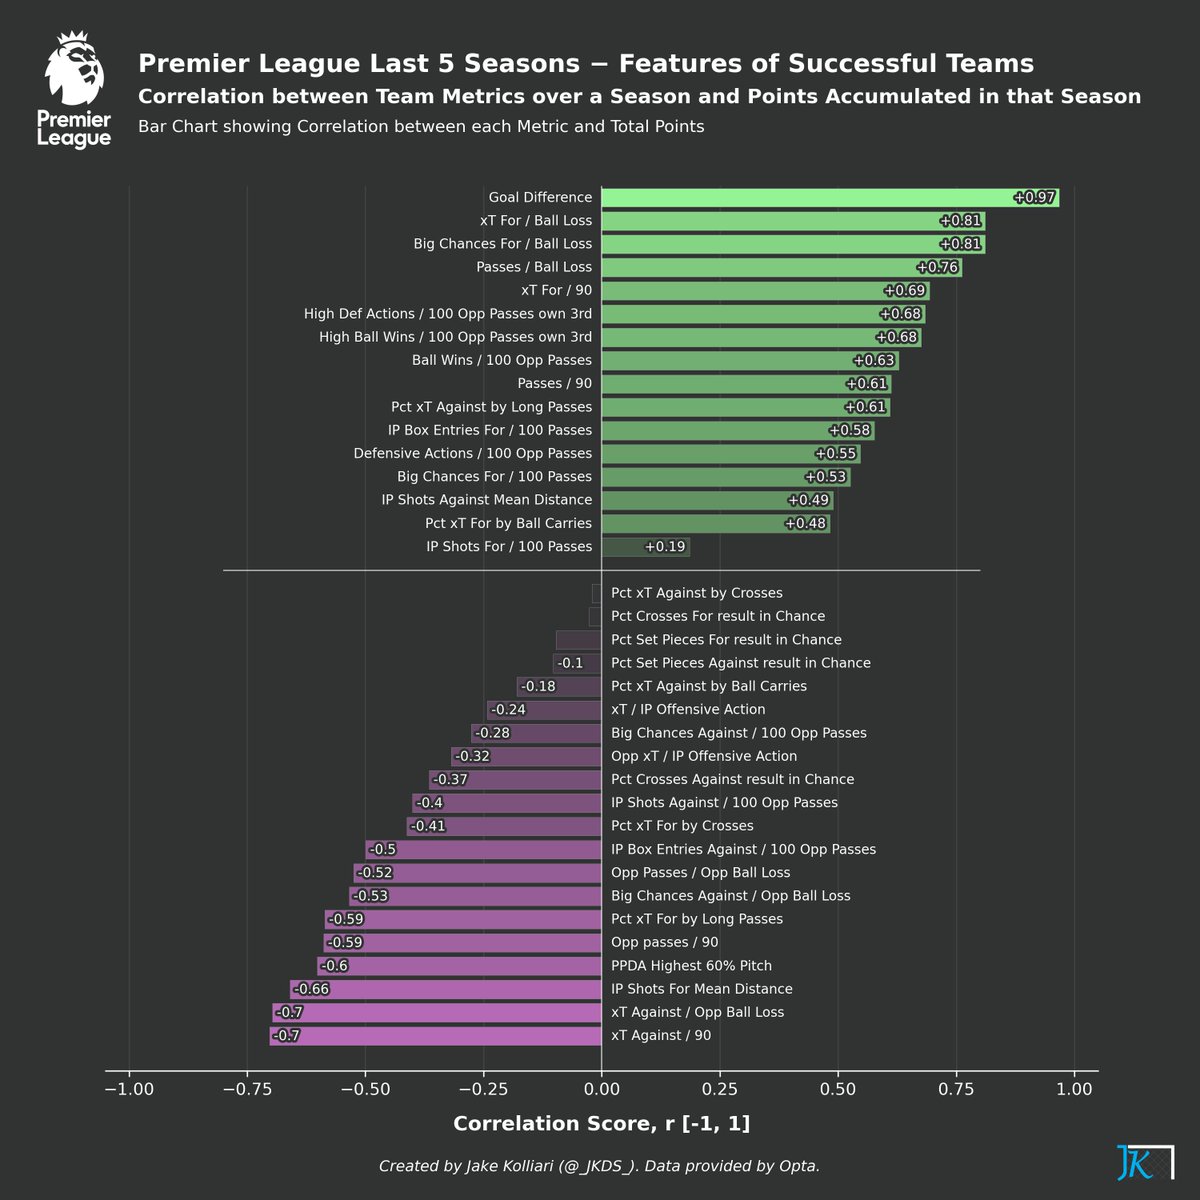 Correlation scores are in the range [-1, 1], with magnitude > 0.4 indicating moderate correlation with points.
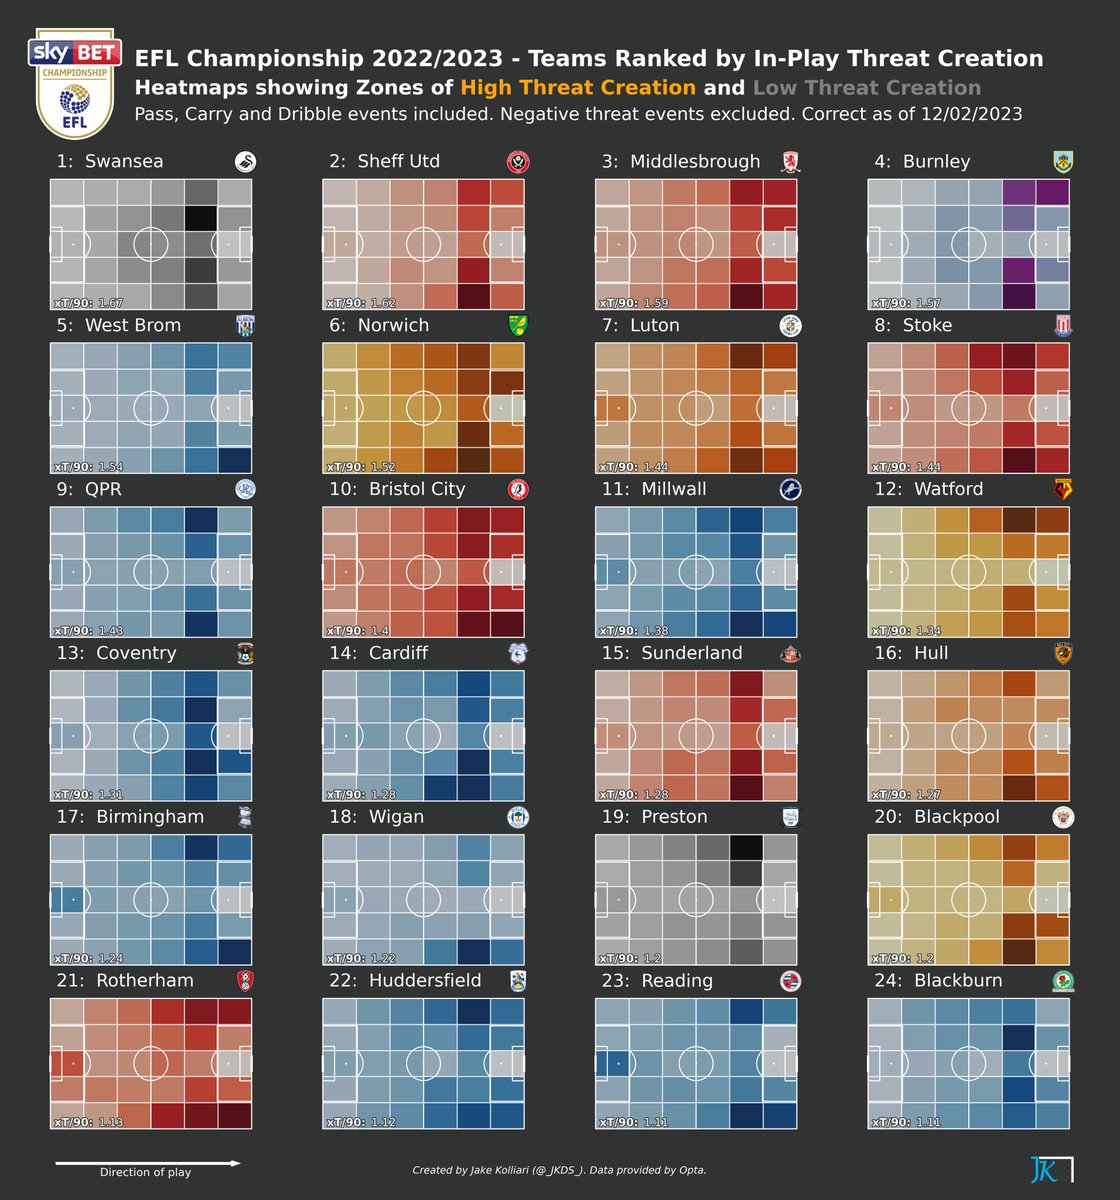
 Teams ranked by total threat creation. Liverpool, Leeds & Chelsea significantly underperforming based on threat created.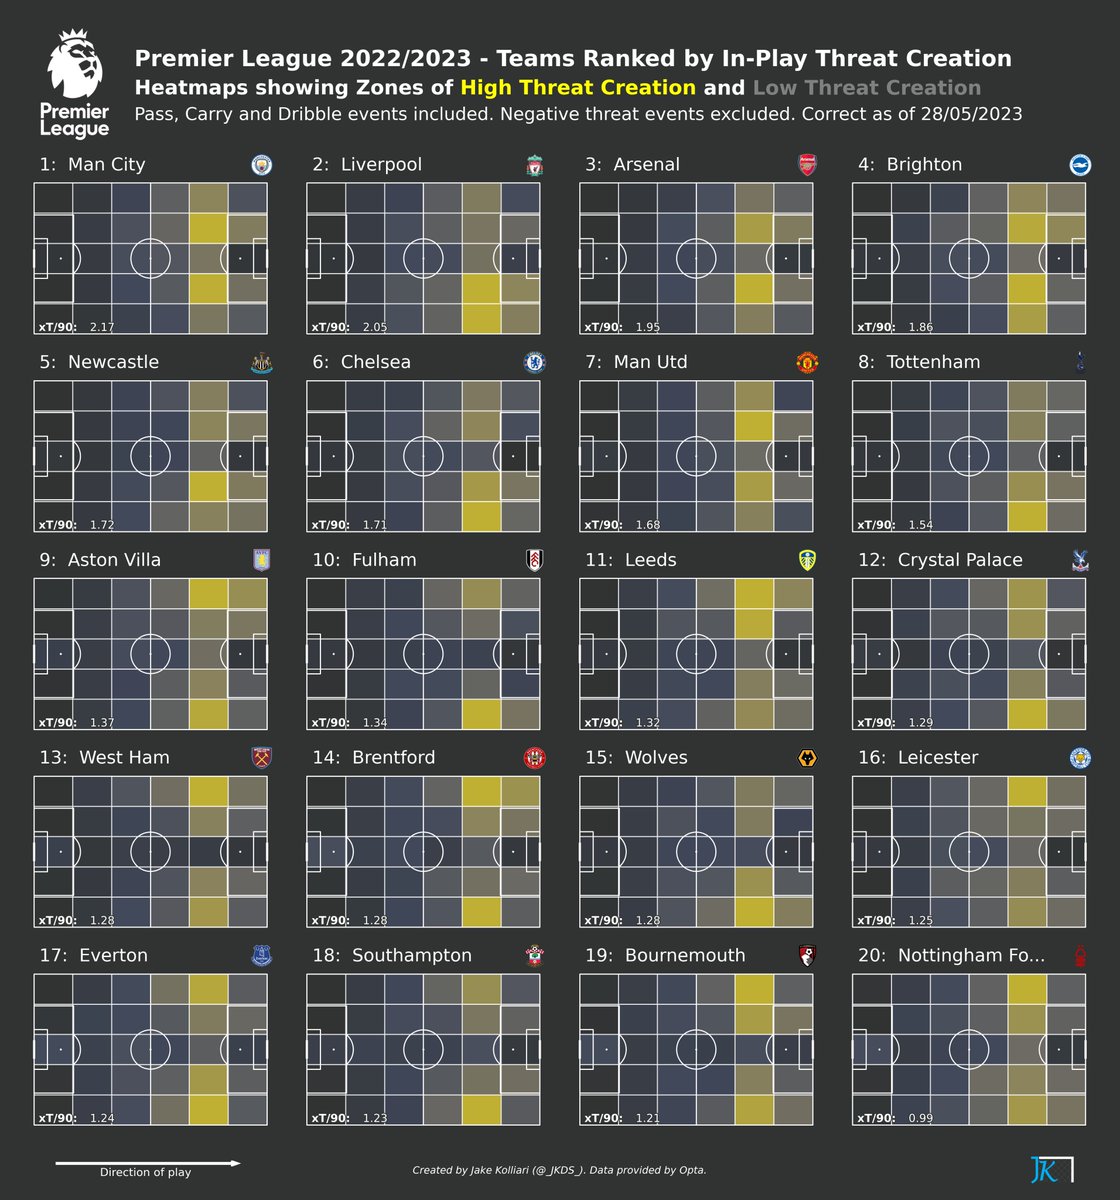
 Which players have generated the most "threat" per 90 for their respective teams - broken down into threat creation through passes and carries. (2/12)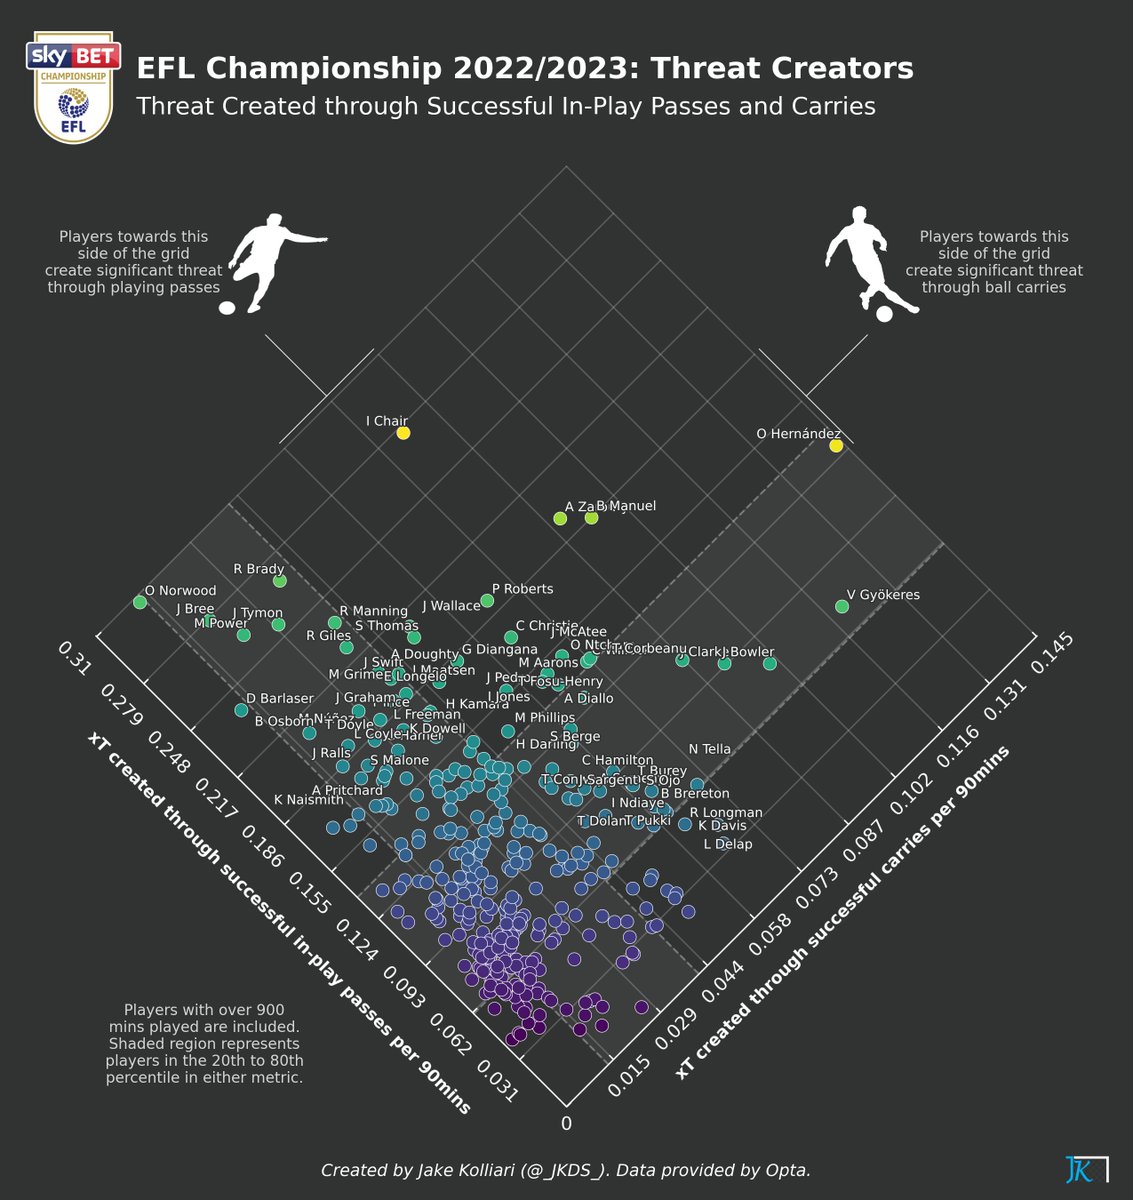
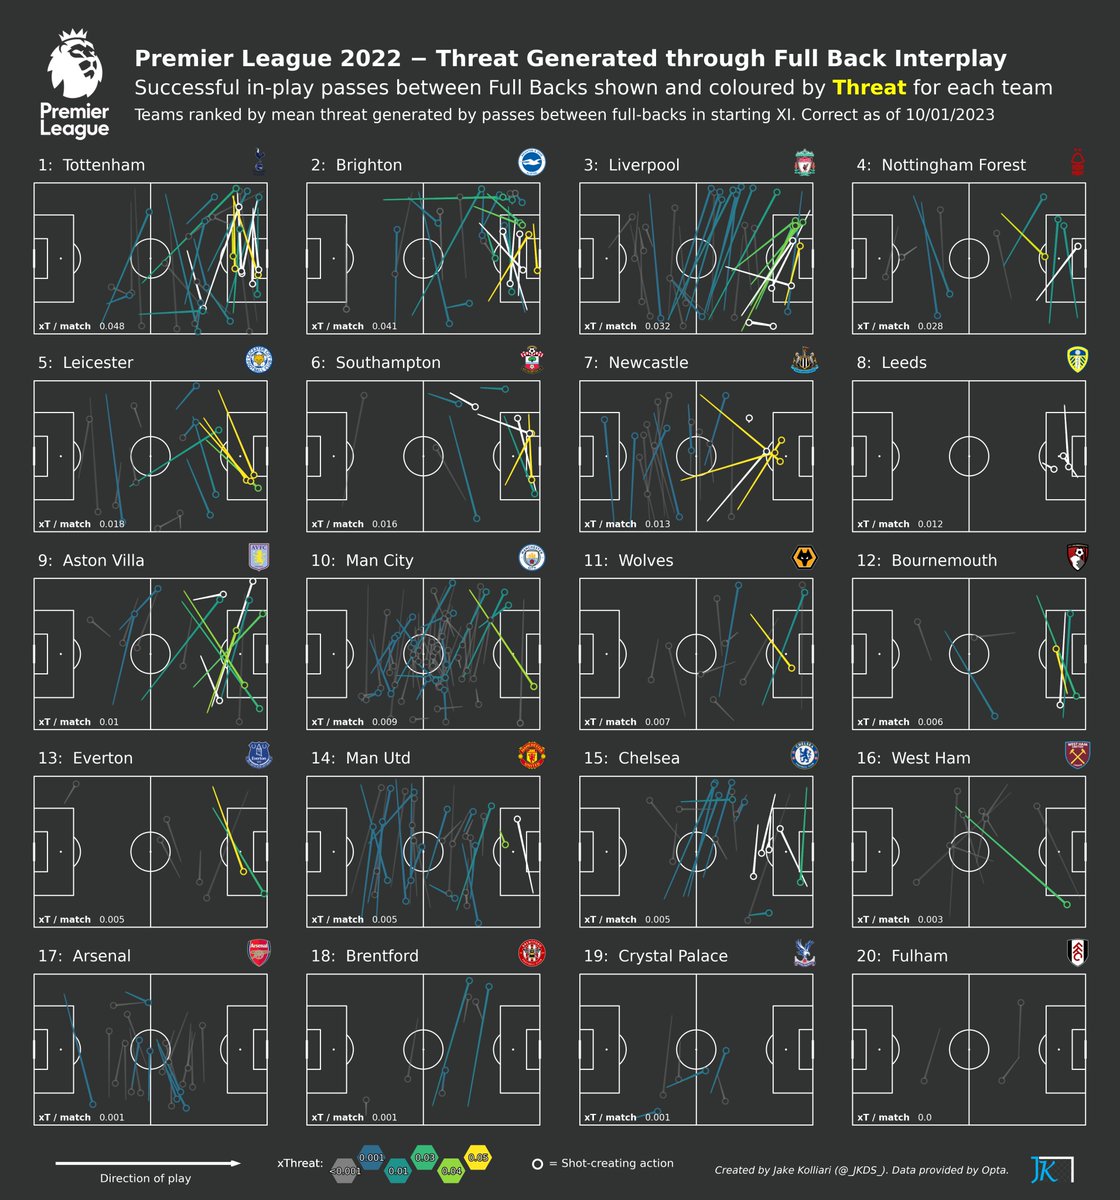 Firstly, let's address how we assess the 'quality' of passes between FBs. We use xT as a statistical measure of the impact that the pass has on a team’s probability of scoring.