Alexis C. Madrigal Profile picture
Hanging up the cleats here. Hosting @kqedforum, book with @mcdbooks, building Oakland Garden Club
Aviva Gabriel Profile picture *Inactive* Shelton Mercer (Now at @TwitChange) Profile picture Timothy McDonnell Profile picture Lê Thi Mai Allafort Profile picture 4 subscribed
Nov 18, 2022 9 tweets 2 min read
I’ve been struggling to articulate something about Twitter for a while. It’s the thing that I think is its key strength. Here goes:

Twitter is/became a space for elite persuasion, a way to push ideas to elites across disciplines. Media, Hollywood, DC, tech. It worked across scales, too. Local elites could be influenced, same as world leaders.

Twitter has never been BIG in social media terms, but it was influential because this is place where certain elites actually hung out, phone in hand, just like the rest of us.
Nov 3, 2022 9 tweets 3 min read
Something I’ve been thinking about Twitter: for those of us who are word people, this was once our place. “Words with Friends” as @kathrynschulz once put it.

TikTok may be exciting and engaging, but it’s not about words. The anxiety that word-people feel about the end of Twitter isn’t just about Twitter (tho it is that too!) — it’s also about our declining relevance on an internet that has turned largely visual with a side-helping of audio.
Nov 3, 2022 6 tweets 2 min read
I mean … maybe it is time to try it? Created an account at least

sfba.social/@alexismadrigal I thiiiiink that a Discord-like future is more likely than a Mastodon-like future, but … we’ll see?
Mar 12, 2021 5 tweets 2 min read
You know, the topline on Biden’s announcements was vaccine eligibility for all adults by May 1, but the big deal was Biden’s supply optimism:

The administration expects enough ACTUAL DOSES for all adults by the END OF MAY. Biden has sandbagged vaccine goals—100 million doses in 100 days was obviously underplaying their hand—but this feels like a legit tough but achievable goal.
Mar 10, 2021 10 tweets 4 min read
So … a fun bit of personal news. Next week, from Tuesday-Friday, I’m going to be guest hosting the 9am hour of @KQEDForum. We’ll be looking back at the plague year with a bunch of great guests.

Aaannnd there’s a media experiment you can participate in right away. Details 👇 The pandemic sent so many of us out into our streets—in wheelchairs, riding bikes, or just on foot. We found new spots, or old places started to mean something different. We want to hear about that! Really, I want you to take us to a place that's become meaningful for you.
Mar 10, 2021 4 tweets 2 min read
> @CDCDirector Walensky ... We've really appreciated the improvements to the CDC COVID Data Tracker, but there's a major problem today. Cases appear to spike, but really Missouri dumped a bunch of probable cases from throughout the pandemic. This is misleading. The CDC COVID Data Tracker needs a note so that people looking at the chart understand this spike. We've interfaced intensely with the public, answering thousands of queries from people about problems like this. People want this information and shouldn't have to scramble for it.
Mar 1, 2021 9 tweets 4 min read
Deaths are not rising based on anything we've seen. Some states are reconciling their death certificates with their existing counts and ending up reporting large backlogs.

~But that doesn't mean deaths are rising. It means the peak of the surge was even worse than we knew.~ The story around cases is a little more complicated. But you can zoom in and start to get a sense of things... Here's your regional look, which shows the little upward hooks are in the South and Northeast.
Feb 24, 2021 7 tweets 2 min read
I wanted to know: what would "beating COVID" look like in the U.S.? So I asked a bunch of public health experts how we'd know we crossed the threshold where The Emergency was over.

theatlantic.com/health/archive… The Biden administration and many public health leaders have not really wanted to lay out the goal we're trying to reach. And I get it! It's complicated!

But we need the specifics to measure progress and give people a sense of when "this will be over."
Feb 22, 2021 4 tweets 2 min read
Best documentary I can watch right now?

(Interests: the Bay Area, plants, the 1970s, cetaceans, cuttlefish, music, particle accelerators, the placenta, space, production processes, the Fed, radio, artists, the Cold War, weird stuff) So, first: holy hell this thread is amazing. Thank you. I now have laundry-folding documentaries until 2022.

I decided to watch this one. The strangeness drew me in. It’s equal parts extremely uncomfortable and extremely interesting.

Dec 18, 2020 4 tweets 2 min read
In the abstract, this might make sense. But this is just wrong.

The system that CDC was using for hospital data was not up to the task. The @HHSGov data is solid now.

Switching the reporting system now would be disastrous.

bloomberg.com/opinion/articl… The CDC itself said its data collection system was not flexible enough for pandemic response.

And besides, CDC has maintained access to the data throughout.

beckershospitalreview.com/data-analytics…
Dec 18, 2020 6 tweets 5 min read
> @HHSGov @CDCgov and @PHEgov have put out the document and data that's been guiding the COVID-19 response inside the Federal government.

This is another huge transparency win.

beta.healthdata.gov/National/COVID… A few things to note:

1) the data that's backing the main report is available. beta.healthdata.gov/api/views/gqxm…

2) This is a complex data product combining multiple datasets.

3) There is a lot of new data here, including *COUNTY-LEVEL* testing data.
Dec 8, 2020 9 tweets 5 min read
So, @HHSGov made a huge release today: facility-level hospitalization data going back to August.

It's probably the single most important data release that we've seen from the Federal government. Especially now, when hospitals are under such pressure.

healthdata.gov/hhs-publishes-… We can do immediately useful things with this data—and we'll have interactive visualizations of it very soon.

As an example, here are maps of hospitals with the percentage of staffed beds occupied by people with COVID.

Dark red is over 25%+.
Dec 5, 2020 12 tweets 6 min read
There have been a lot of questions about the @HHSGov hospitalization data. Because of the political appointees at the department, many people looked askance at HHS producing this data. We can now present some new analysis that the data is...

good.

covidtracking.com/blog/what-weve… When we account for variations in state data definitions and that (generally) CTP hospitalization data lags HHS data by one day, we see that the two datasets are nearly perfectly matched.

If HHS current hospitalization data is bad, then the state data is bad, too.
Dec 1, 2020 14 tweets 5 min read
I think it's worth preparing yourself for what's coming this week. I'm going to walk through what I think we'll see. @COVID19Tracking doesn't create projections. I'm just talking as me here, working from the model that @trvrb created to help think about the relationship between cases and deaths.

More on that here: theatlantic.com/science/archiv…
Nov 25, 2020 4 tweets 3 min read
This is really important to understand over the next few days. The Thanksgiving holiday will mean that COVID data will not be a good reflection of reality for the next week.

covidtracking.com/blog/daily-cov… Image As for other holidays, the numbers go way down for several days, and it takes a week for the 7-day averages of most metrics to become useful again.

BUT: hospitalization stats are *less* affected by these problems, so keep your eye there. Image
Nov 19, 2020 18 tweets 7 min read
As cases exploded in the U.S., I kept discounting them in my mind: "Well, treatments have improved. Maybe the death rate won't be nearly as high as the summer."

Then I saw this from @trvrb, who sounded the alarm early about COVID-19 in the U.S.

Shakily, I looked into what Trevor did. He looked at state case and death numbers to determine how many days in the past cases best aligned with today's death toll. Empirically, the number was about 22 days.

Here's the match.

(I'll be using charts I made to illustrate here.)
Nov 13, 2020 7 tweets 2 min read
October 7: we cross 50k cases
November 4: we cross 100k cases
November 12: we cross 150k cases

Where is our nation’s government? Where is the Coronavirus Task Force? I know there are many, many civil servants inside the Federal government working hard on this response. We owe them our thanks.

But they can’t fight this fight without support from the top.
Jul 16, 2020 6 tweets 3 min read
This is my dire evaluation of our current situation, if we don't see major policy changes to stop this virus.

theatlantic.com/health/archive… The best news I can give is that governors in states with growing outbreaks are beginning to talk about this disease in new ways.

Jul 11, 2020 4 tweets 2 min read
Considering the totality of the data, this was probably the worst COVID-19 week since spring.

Testing didn't increase, but cases did. Hospitalizations kept mounting and deaths began to move upwards for the first time since the week of April 12th. Worse, there's no end in sight. No policies have gone into effect that seem likely to reverse the trends. And we've already baked in worse because of all the lag.

So, even if southern governors started now, the infections and deaths would continue to show up for weeks.
Jun 30, 2020 6 tweets 3 min read
> @yayitsrob and I have bad news to report from our conversations with laboratory experts.

Despite the increases in COVID testing capacity, the second surge has pushed our labs to the breaking point (again).

theatlantic.com/science/archiv… To be honest, I was not expecting this. Then I had a grim phone call with a source and we began racing to send up this flare.

The testing supply chain problems have not been solved. Especially at a time when we could use more capacity than ever.

npr.org/sections/healt…
Jun 19, 2020 7 tweets 3 min read
Today was the worst day for COVID-19 case numbers in more than a month. Major problems across the south and southwest.

We've already baked in a lot more infections than you see here—and few harm reduction policies appear to be on the way in these states. 
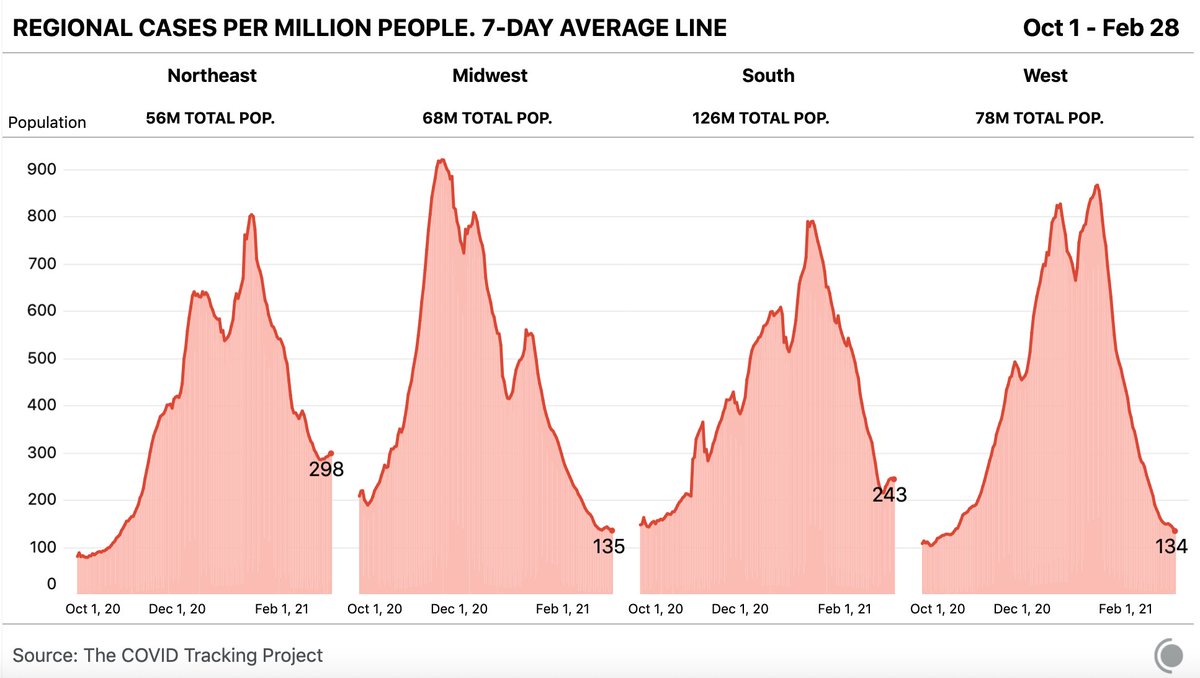
And though the total testing numbers are better than they've ever been... The south is producing 50%+ of the cases with only 33% of the testing. And things are trending in the wrong direction.