Data Scientist Advocate @ObservableHQ & teaching environmental data science @ucsantabarbara. Opinions mine. Data | Education | Art | Community. She / her.
 🧵2/9
🧵2/9 
 Start by defining two generic points on a function f(x), separated by some distance delta x. 🧵2/8
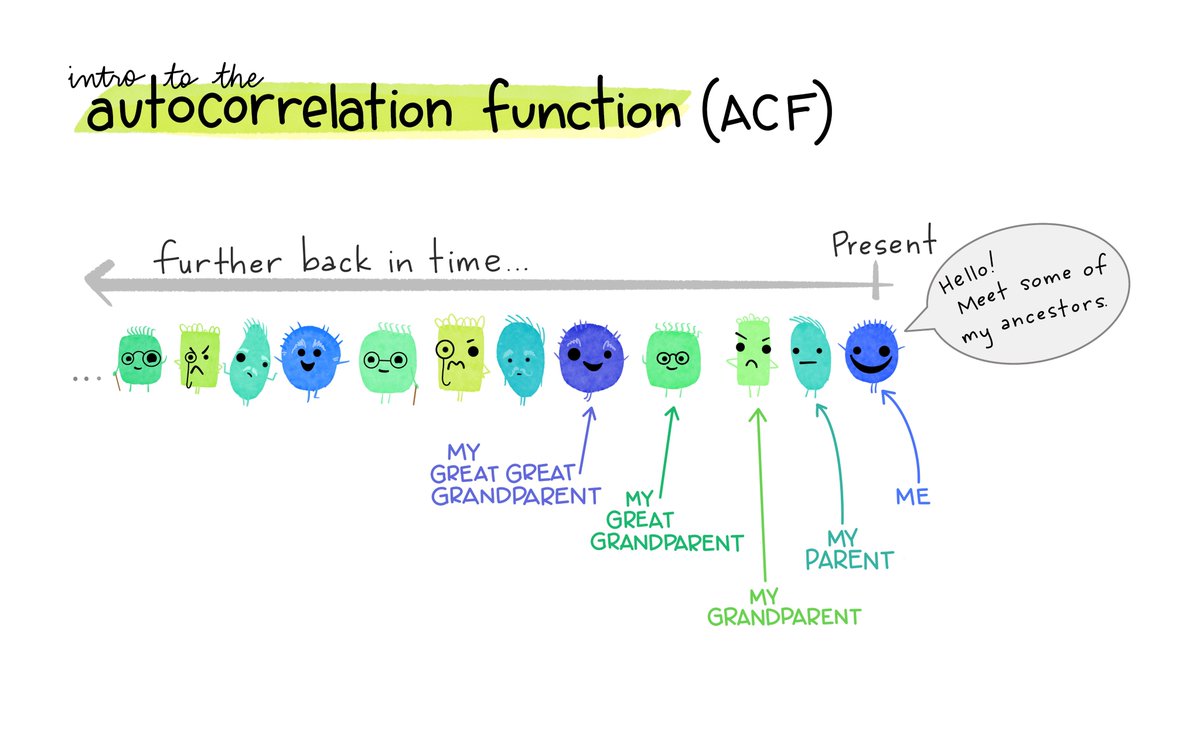
 🧵2/9: There are some notable patterns in similarities between monsters separated by different numbers of generations...for example, in this family, monsters tend to be very similar to their great-great grandparents, but very different from their grandparents...
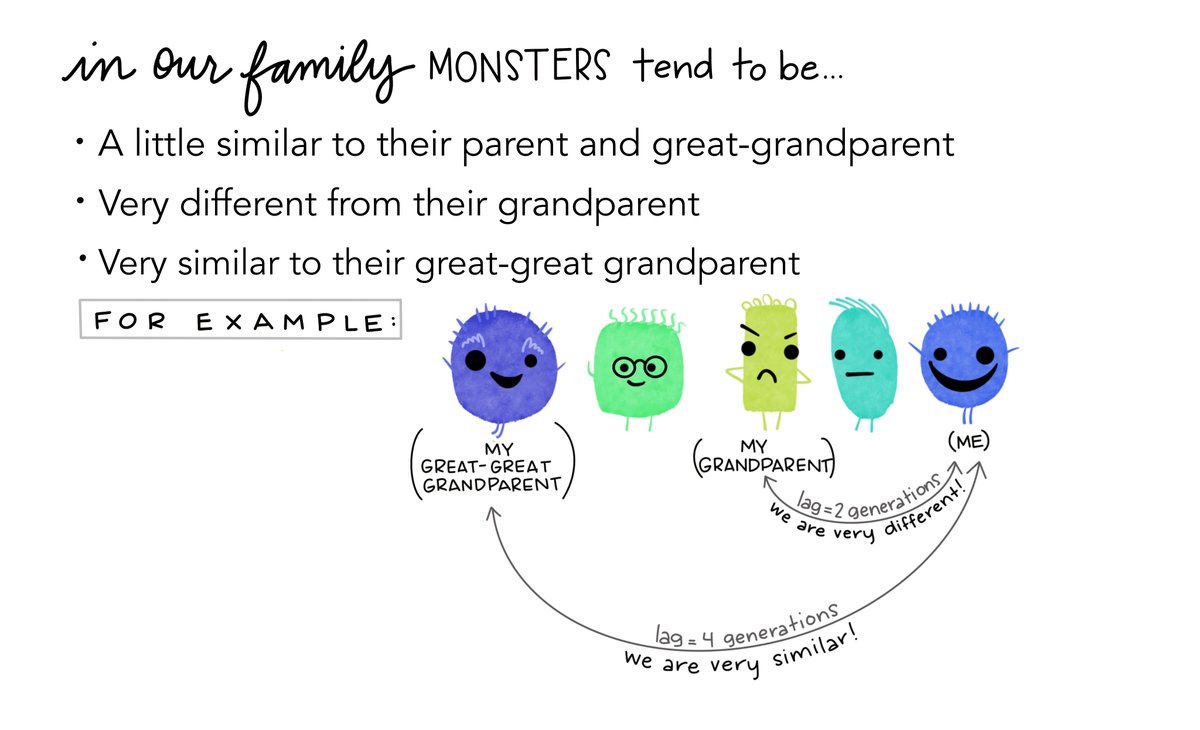
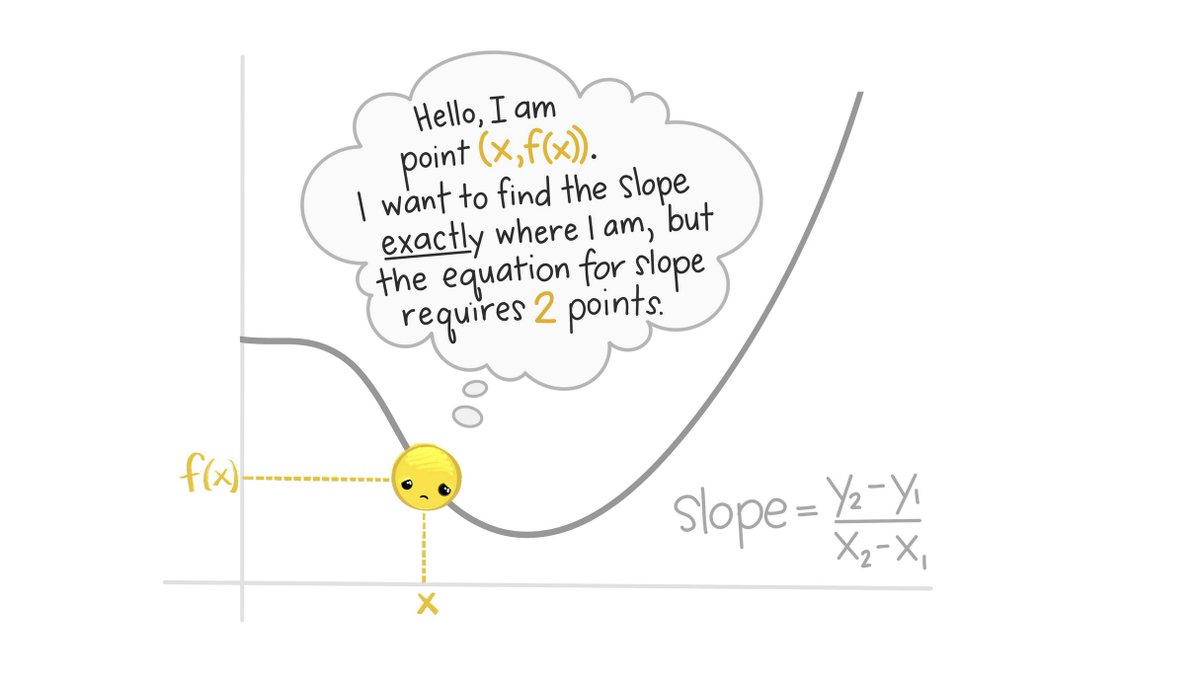
 Start by defining two generic points on a function f(x), separated by some distance delta x. 🧵2/9
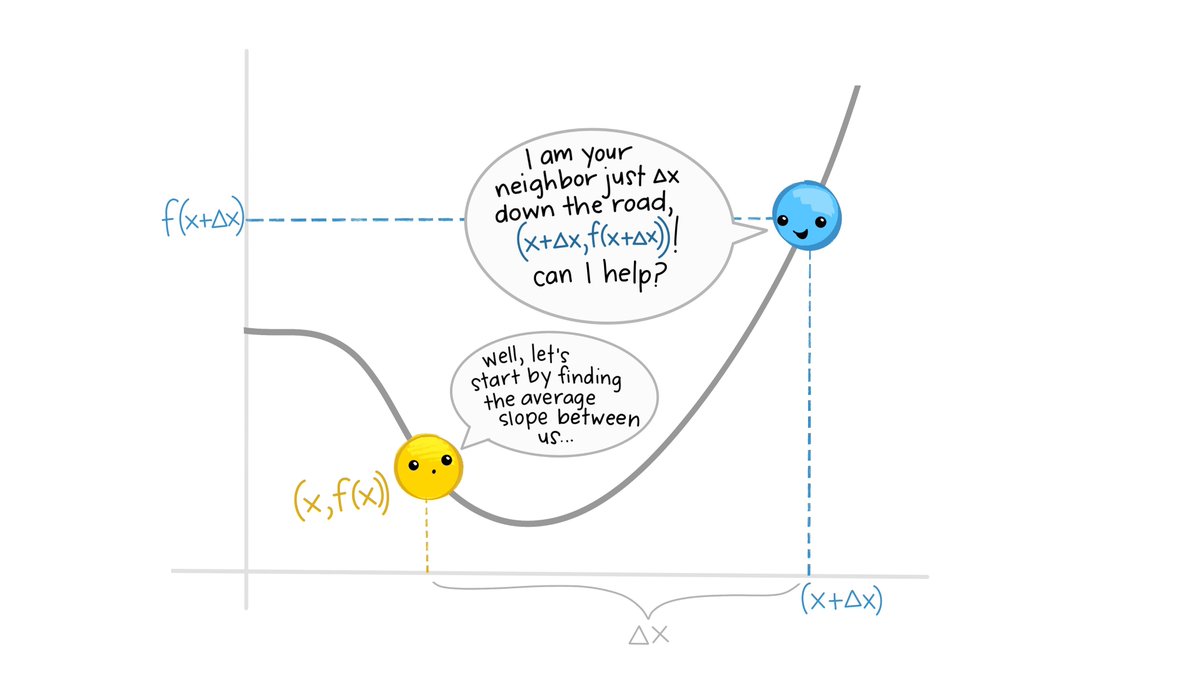
 🧵2/9: Learn more in our new post on the RStudio Education blog: Release the penguins! education.rstudio.com/blog/2020/07/p…
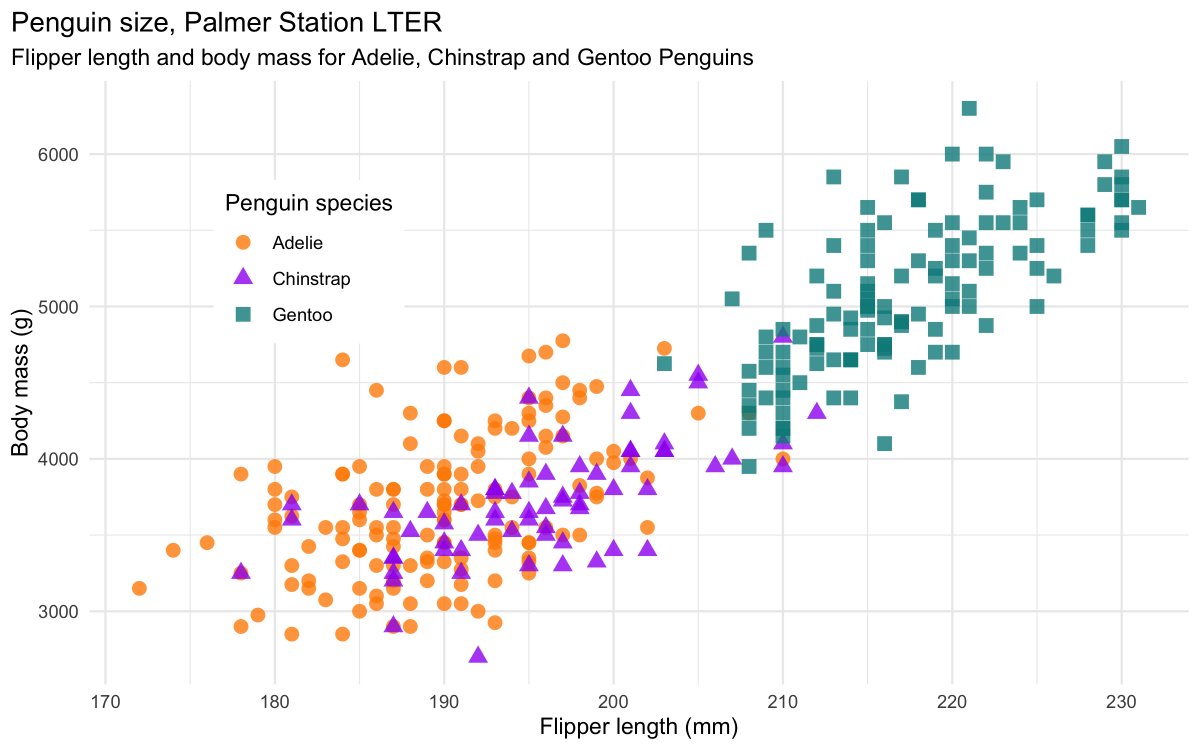 The data, published in Gorman et al. 2014 (journals.plos.org/plosone/articl…), contain observations for 3 penguin species on islands in the Palmer Archipelago, Antarctica: 🧵 2/6
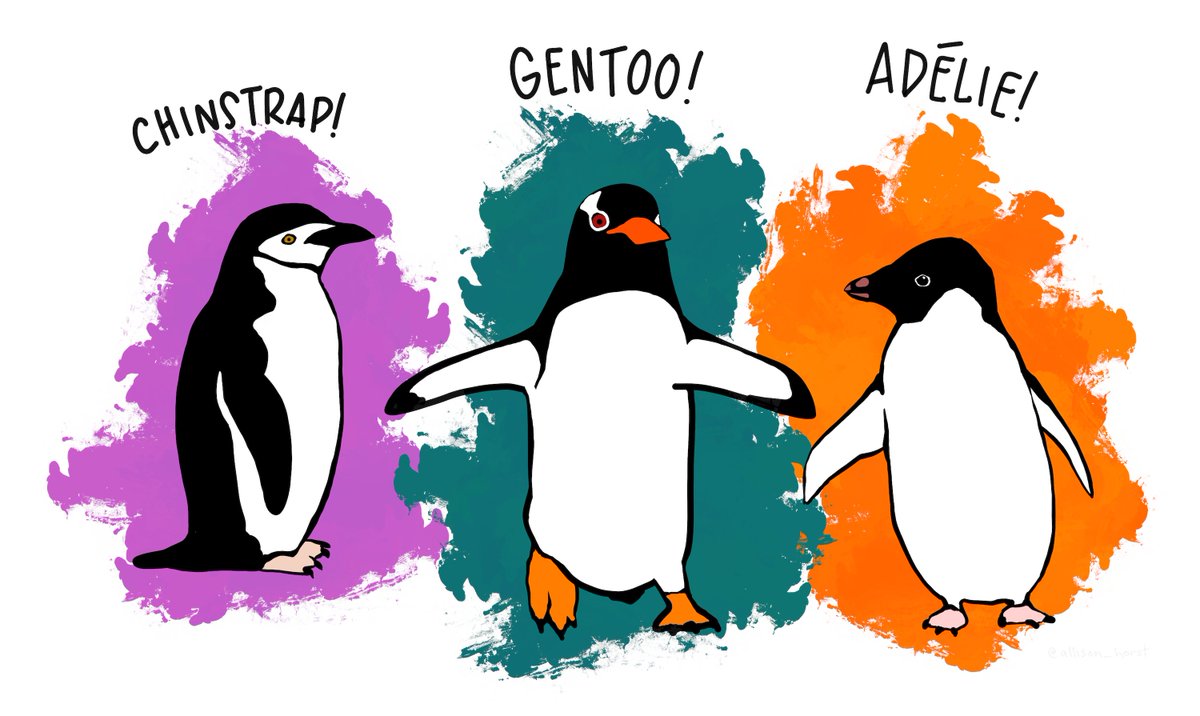


 Thinking warm-up:
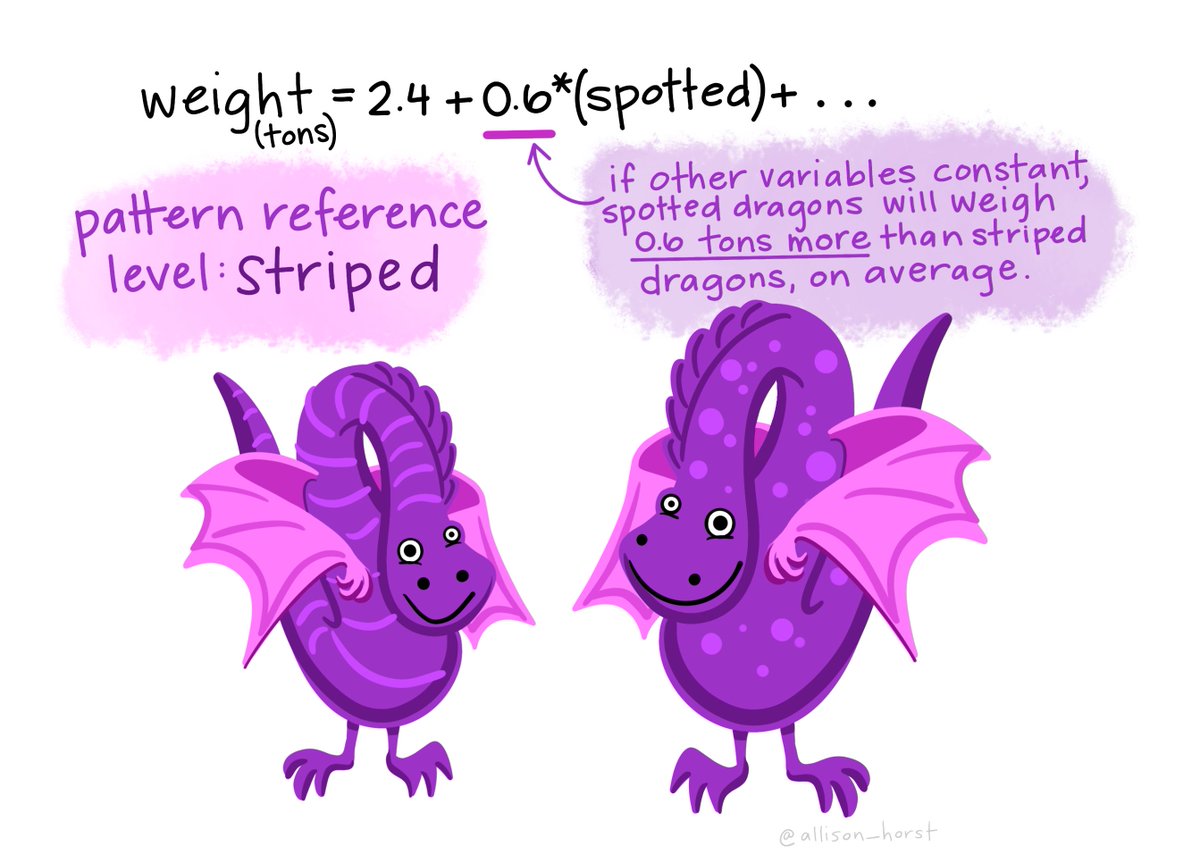
 interpreting categorical predictor coefficients