Ben Ansell Profile picture
Politics Professor, Nuffield & Oxford, FBA. Host of What's Wrong with Democracy. Substack: https://t.co/iBvUvBGqtN. Why Politics Fails. Reith Lecturer.
LittleGravitas 🇪🇺 🇪🇸 🇺🇦 🇮🇱 🇵🇸 #FBPE Profile picture Globalbizdynamics Profile picture Niamh Hardiman Profile picture 3 subscribed
May 9 9 tweets 3 min read
New from me. Is Isaac Levido right to claim a hung parliament is in sight after the local elections? Is John Curtice wrong that the Conservatives are 99% going to lose? A quick thread on why Levido is hanging on to a false cope 1/n Image Last year, after the local elections, we had a similar conversation where the projected national vote (PNV) looked much more favourable to Conservatives than the regular national opinion polls. And I suggested that the reason was tactical voting. I continue to think the same. 2/n
Feb 15 17 tweets 5 min read
On immigration and housing in the UK. A quick thread.
There has been a 'debate' over the last few days online about whether high levels of immigration are responsible for unaffordable housing in the UK. Albeit with rather little reference to data. Here's some... 1/n As followers will know I have spent a lot of time working with UK housing data. Generally high house prices are associated with low support for tax and spending and with lower support for populism. See lots of things I've written. But what about immigration? 2/n
Jan 22 29 tweets 11 min read
🤖THE ELECTION APP IS BACK!🤖
New year. New post. New app. And most of all, new electoral boundaries.
I updated my election predictor app to the new boundaries, added lots of fun graphs, and written a lengthy post.
What do we learn? The boundaries won't save Rishi. Read on... 1/n Image 
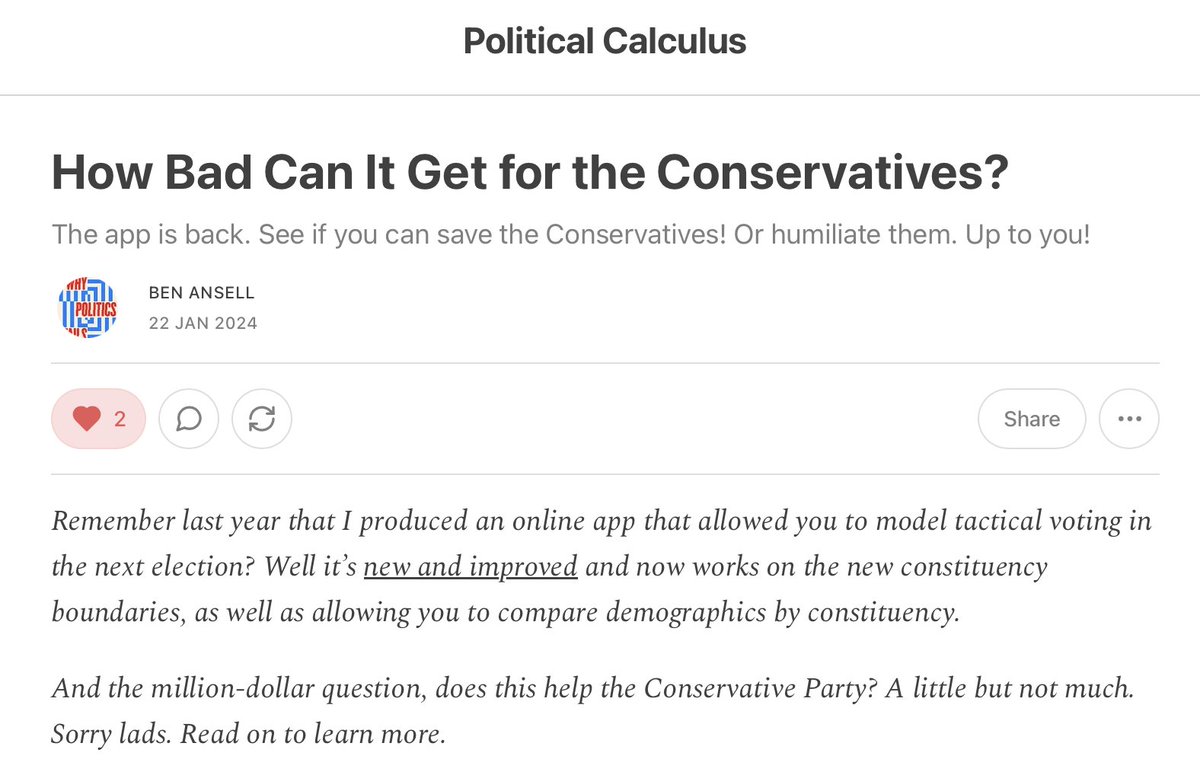
Last year I created an election predictor tool that allows you to change the level of tactical voting among progressives or Reform/Cons.
This got lots of coverage by @mattholehouse @Smyth_Chris, @maitlis etc. You can read more here
2/nbenansell.substack.com/p/tactical-cop…
Mar 8, 2023 17 tweets 9 min read
This thread attracted a bit of interest yesterday, so I've followed it up with a longer look at swing voters in the potential 2024 General Election and why Sunak is trying to 'stop the boats'. Here's a 🧵about the post with some data. 1/n

benansell.substack.com/p/stick-or-twi… Yesterday I had this rather ungainly graph that showed the levels of social authoritarianism in groups of voters by their GE19 vote and current (Oct 22) vote intention. It was a little complex. Just because I could doesn't mean I should've. So I have a simpler plan. 2/n
Mar 7, 2023 14 tweets 4 min read
Why are the Conservatives doubling down on small boats? Because that's what the voters they want to win back care about. And I'd expect continued 'greatest hits of social authoritarianism' policies. Quick thread with some data on attitudes among different types of voters. 1/n I'm going to use data from a YouGov poll I ran in October 2022, which had a vote intention question. Things didn't look great for Conservatives then but it's likely that many of their 2019 voters are lurking in the Don't Knows. Compare with (left) and without (right) DKs. 2/n
Jan 30, 2023 9 tweets 4 min read
If you didn't catch it over the weekend, my Substack looks at how Brits feel about taxing wealth. A quick summary of the survey results people found most interesting. First a cartogram of the UK-exNI with constituencies sized by support for taxing wealth rather than income 1/n Image And by party we can see that about 50% of Labour GE19 voters and SNP voters prefer to tax wealth (as opposed to taxing income or being indifferent). Only a quarter of Conservatives feel that way. Libs, Greens, and non-voters in the middle 2/n Image
Jan 2, 2023 12 tweets 4 min read
Following up on @jburnmurdoch's excellent piece on generational political divides, my new Substack post does a deep dive into generational differences in British politics. 1/n
benansell.substack.com/p/generation-g… John wondered whether the Millennials were just different in terms of how aging translated into voting. My own survey from a month or two back showed huge age differences in vote intention. 2/n
Sep 23, 2022 25 tweets 12 min read
💷💷💷 Rather than ramble aimlessly about today's 'mini-budget', I thought I would change tack and present a very fresh (i.e. finished yesterday) paper that has actual data on what the British public want tax rates to look like. To see, read on... 1/n The paper is with @aslicansunar and @madselk and we look at how closely people's tax preferences tie to changes in tax thresholds. Quite relevant for today's changes to the basic and additional rate of taxation in the UK. It's available here benwansell.files.wordpress.com/2022/09/progre… 2/n
Jun 18, 2022 10 tweets 3 min read
In response to Priti Patel's comment that opposing sending refugees to Rwanda is racist because people wouldn't mind sending refugees to Sweden, France etc, I thought it would be worth comparing the level of democracy in the places refugees come from to that in Rwanda 1/n I decided to look at what scholarly measures of democracy look like in the 8 most common origins of refugees to the UK in 2021. That is Iran, Eritrea, Albania, Iraq, Syria, Sudan, Vietnam, and Pakistan (I have switched Afghanistan with Pakistan because no data yet on Taliban) 2/n
Feb 16, 2022 6 tweets 2 min read
Quick thread response to this note by Matt. He's right that age divide is very large currently. And 2017 and 2019 had largest age gradient since 1960s. But... these elections don't look so different, when you adjust for income, home ownership and education 1/n @jrgingrich and I have a chapter in the forthcoming IFS Deaton Review where we look at this. Here we show the relationship between age and voting Conservative between 1964 & 2019. Left is bivariate (just age), right is adjusting for income, education, homeownership and gender 2/n
May 17, 2021 24 tweets 11 min read
🚨💉🏡 NEW ARTICLE 🏡💉🚨
"Social Distancing, Politics and Wealth" out in Open Access in West European Politics, joint with @aslicansunar and @madselk through our @ERC_Research grant WEALTHPOL. Yes, we wrote a COVID article ;) What do we find? 1/n
tandfonline.com/doi/full/10.10… The paper uses Google Community Mobility data at the local level in the 1st wave of COVID19 and looks at the correlates of workplace and residential activity. Who went to work more? Who stayed at home? We focus on the UK, Sweden and Denmark and then expand to European regions 2/n
Feb 24, 2021 29 tweets 15 min read
💉Who wants to take the vaccine? Together with @jrgingrich, @Jackstilgoe and Martin W Bauer, I've conducted a 2 wave panel study of how people in the UK feel about taking the vaccine. And it's pretty good news, though with some challenges left. 🧵1/n
ox.ac.uk/news/2021-02-2… Here's the good news. Whereas only 50% of people were "very likely" to take the vaccine in early October, over 3/4 are now. Adding people who are "likely" that's moved to almost 90%. And many demographic gaps (gender, ethnicity) have closed. See rpubs.com/benwansell/729… 🎺🎉. 2/n
Feb 4, 2021 15 tweets 5 min read
I had a statistical conniption about the Aberdeen study published in BMJOpen earlier today. Let's see if I can explain my concerns in a less techie fashion. The gist of the article is that countries with more flights arriving had more deaths. That so? 1/n

bbc.co.uk/news/uk-scotla… The article, which you can read at bmjopen.bmj.com/content/bmjope… relies on the following scatterplot to make its point. Indeed, there does appear to be a relationship between arrivals and (logged) daily death rates. 2/n
Feb 4, 2021 5 tweets 3 min read
Since the authors of this study kindly make their data available, we can see that their multivariate finding largely depends on using absolute deaths and flights not per capita. To wit, on the left their results replicated, on the right the per capita version 1/n 
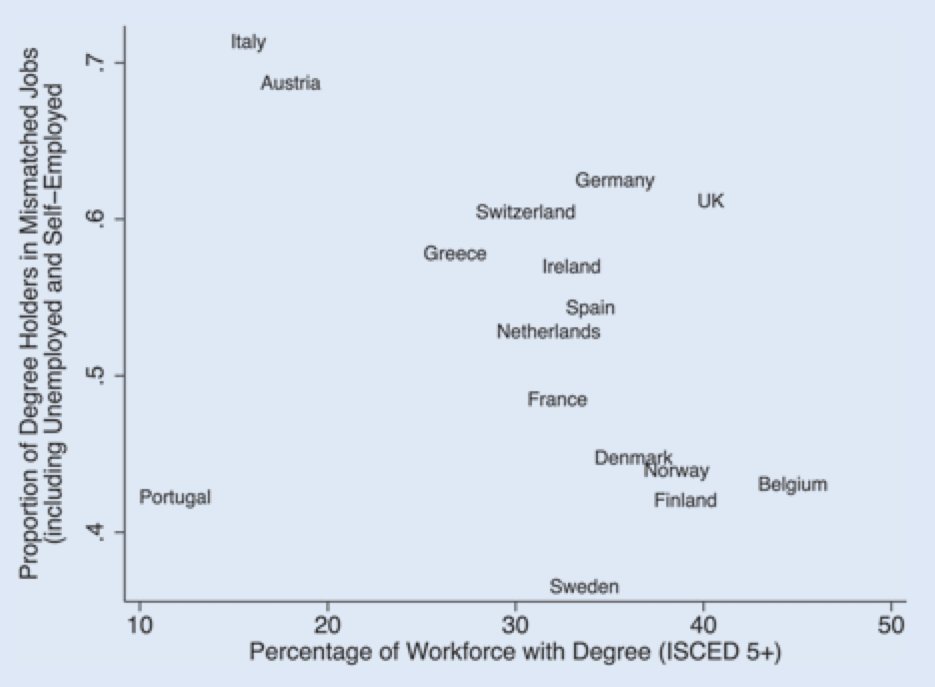
Now if we then log flights per capita we can recreate their 'finding' - see below. But I'm somewhat nervous about what that means about the role of outliers. Basically we have too few observations and too much instability of results for me to be comfortable with this. 2/n
Dec 9, 2020 13 tweets 4 min read
🇬🇧🇪🇺 Who caused Hard Brexit? Some thoughts from the perspective of a social scientist. In the last few days we have seen an interminable debate on whether Remainers, Soft Brexiters, or Hard Brexiters are responsible for Hard Brexit. And it’s a false debate. Why? 1/n People are confusing 'causes of effects' with 'effects of causes'. What this means is that we are all interested in - the former - why Hard Brexit happened - but using arguments about how one actor did something - the latter - as our explanation. These are different! 2/n
Sep 7, 2020 22 tweets 10 min read
🧑‍🎓MERITOCRACY IN THE NEWS👩‍🎓 @David_Goodhart and Michael Sandel have both written provocative new books about the trouble with 'meritocracy'. Both argue that non-graduates have been undervalued and that graduates in non-graduate jobs are disillusioned. What do the data show? 🧵1/n The former question is a tough one since there are two issues at stake. 1. Are non-grads elected as politicians? And 2. Are their policy preferences represented? But consensus in polisci is the answers are (a) Not as much as they used to be and (b) Not as much as for the rich.2/n
Apr 18, 2020 25 tweets 8 min read
😷Social Distancing in the UK Update😷 Now with ANIMATIONS🎥Last week (see below) I looked at Google Community Reports on changes in workplace (& other) activity across British regions. I now have an extra week of data & income measures at the regional level. What do we see? 1/n First off, the Brexit relationship was still there on April 9th (see below) - workplace activity has declined more in 'Remain' areas. The big question is why and I very deliberately was careful about that. Maybe it's because these areas are richer and people work from home? 2/n
Apr 14, 2020 26 tweets 9 min read
🚨 Where are people social distancing in the UK?🚨 Thanks to the Google Community Reports we can see how people have behaved since March. Good news - social distancing is happening everywhere. Less good news - there is still a divide. And guess what explains it... BREXIT...😬 1/n The brilliant people at the ONS Data Science Campus have scraped the Google Community Reports and matched them to demographic and regional data. All I have done is further match this to the 2016 referendum vote at the local authority or county level. github.com/datasciencecam… 2/n
Feb 17, 2020 16 tweets 5 min read
🚨The problems with democracy coding and bias 🚨 Political scientists among you will know about the Polity IV score. This has been until recently the preferred measure of democracy for many scholars. So why, you may ask, does it not like democracy in US or UK? 1/n Until quite recently - I'll let you guess the year - Britain and the US were coded as +10 on the Polity score. That's the max in a -10 to +10 scale. Same as Sweden, Germany, Spain, Portugal, Poland, Hungary... 2/n
Dec 17, 2019 5 tweets 2 min read
Are you a fan of parallel universes? Want to boost Boris, or save Jez? If so you may enjoy my GE2019 Resimulator. I've taken the results for the UK (ex NI) and plugged them into an election simulator where you can adjust polls from their actual numbers.1/n livedataoxford.shinyapps.io/GE2019_Resimul… With a uniform national swing on 2019 it's fairly obvious how hard it would have been for the Conservatives to lose majority. Their lead over Labour would have had to collapse to 5 points - lower than almost any polling. 2/n
Dec 15, 2019 14 tweets 13 min read
🚨🚨ELECTIONS AND HOUSING UPDATE 🚨🚨
Regular readers know my obsession with the decline of house prices in predicting General Elections but their important role in predicting Brexit vote. So what happened in 2019? The connection between house prices and Tory vote was severed 1/n In a piece for @anandMenon1 @UKandEU I argued that the close connection between local wealth measured by house prices and the Tory vote had declined since 2010. And the reason was Brexit as a cross-cutting issue. 2/n

ukandeu.ac.uk/has-brexit-cha…