
Professor • Teacher • Columnist @NRC & @NTvG_actueel • Tweets about @cocites, methodology, critical thinking, evidence, and lack thereof • she/they.

 Of evenementen al dan niet veilig zijn en zo ja onder welke voorwaarden wordt in dit onderzoek bepaald met een risicomodel. Dat is een gebruikelijke methode, maar er zitten haken en ogen aan.

 Everyone who wants to do science needs to find out
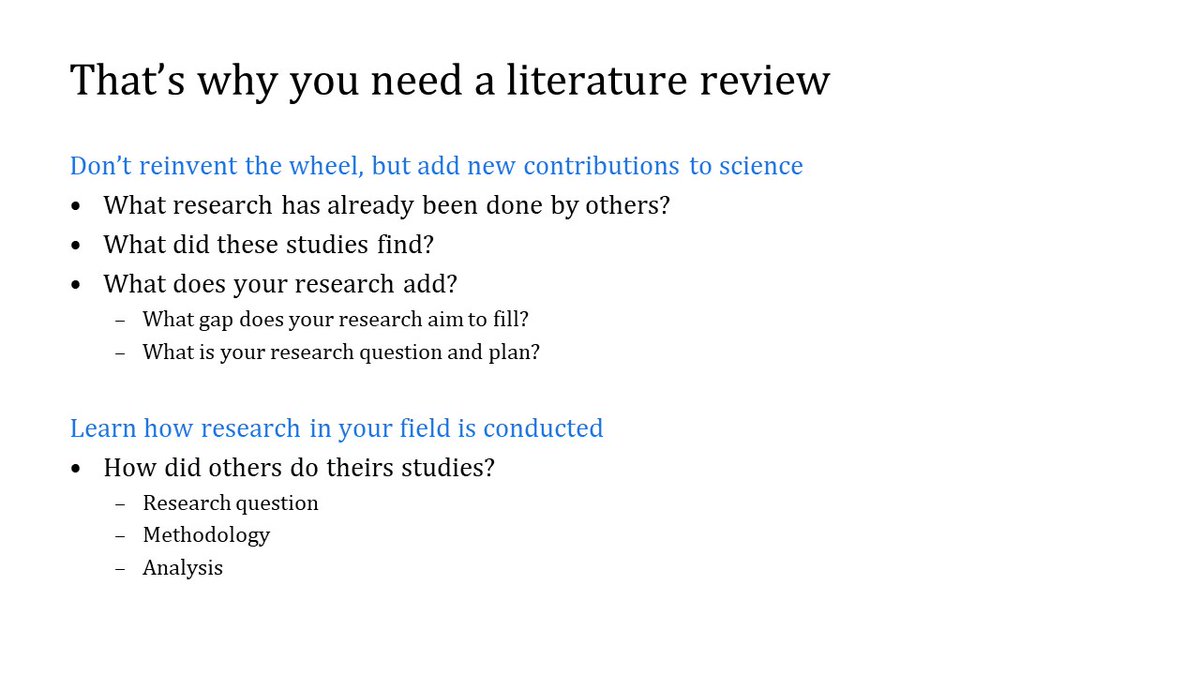
 The authors talk about naps longer than 60min ... that feels like daytime sleeping to me. They find this predominantly in women and in older people? Is that two subgroup analyses? Could be older women?
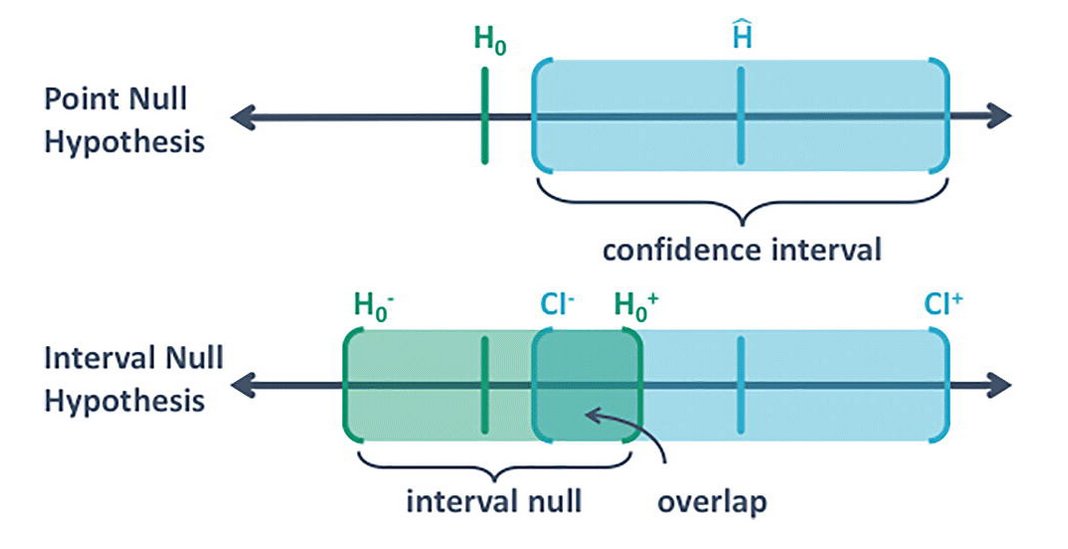 See how they are applied, with the Interval Null in grey.
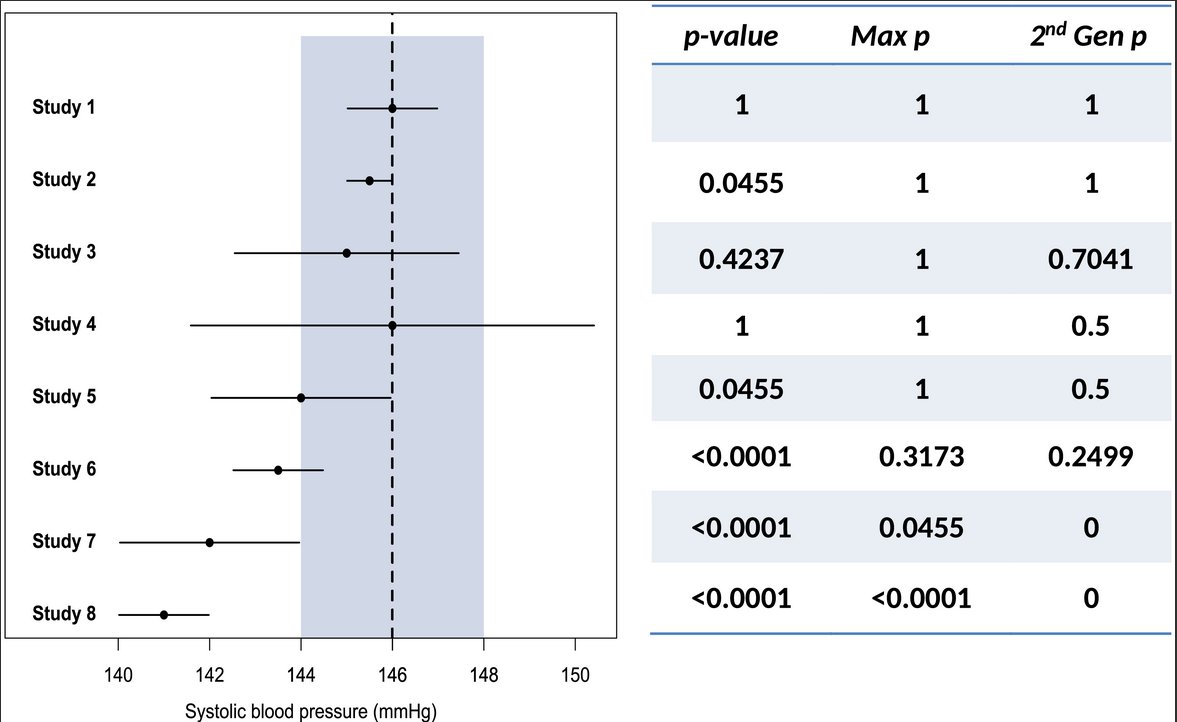

 I told them that the gnome is a gift from my uncle after my partner and I bought our house in the Atlanta. I had joked the house was so cute, it could need a gnome in the garden. And so I got one.
 Hier een onderzoekje over de Australische app (te snel ingevoerd, technologisch een ramp).
  A personal intro: My first work on genetic risk was my MA thesis on why some women perceive their risks of hereditary BC so high that they choose preventive surgery.
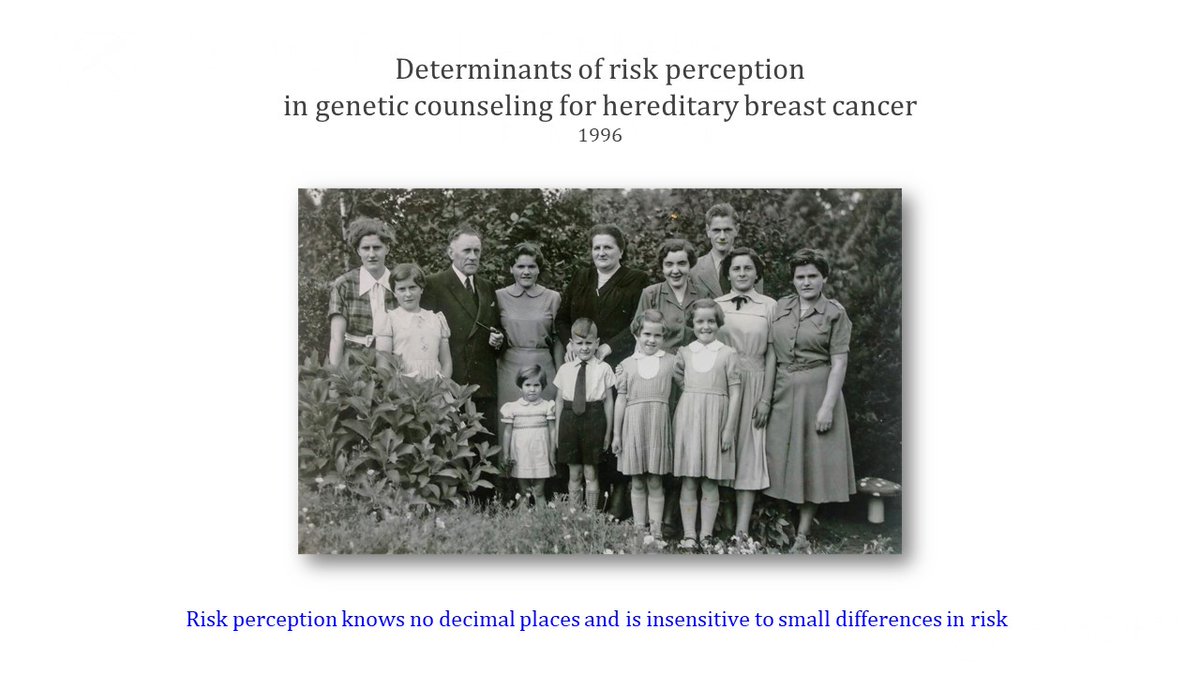
 Phenotypes were adjusted for age and sex (and others). Are these the confounders? Confounding what?
 Polygenic scores (PRS) studies often rely on drawing inferences about the presence and absence of association based on the the p-value. This is tricky in the UK Biobank as the sample size is large enough to flag tiny effects as statistically significant, as we will see.
 CoCites starts from articles, not keywords, and finds articles on the same specific topic.

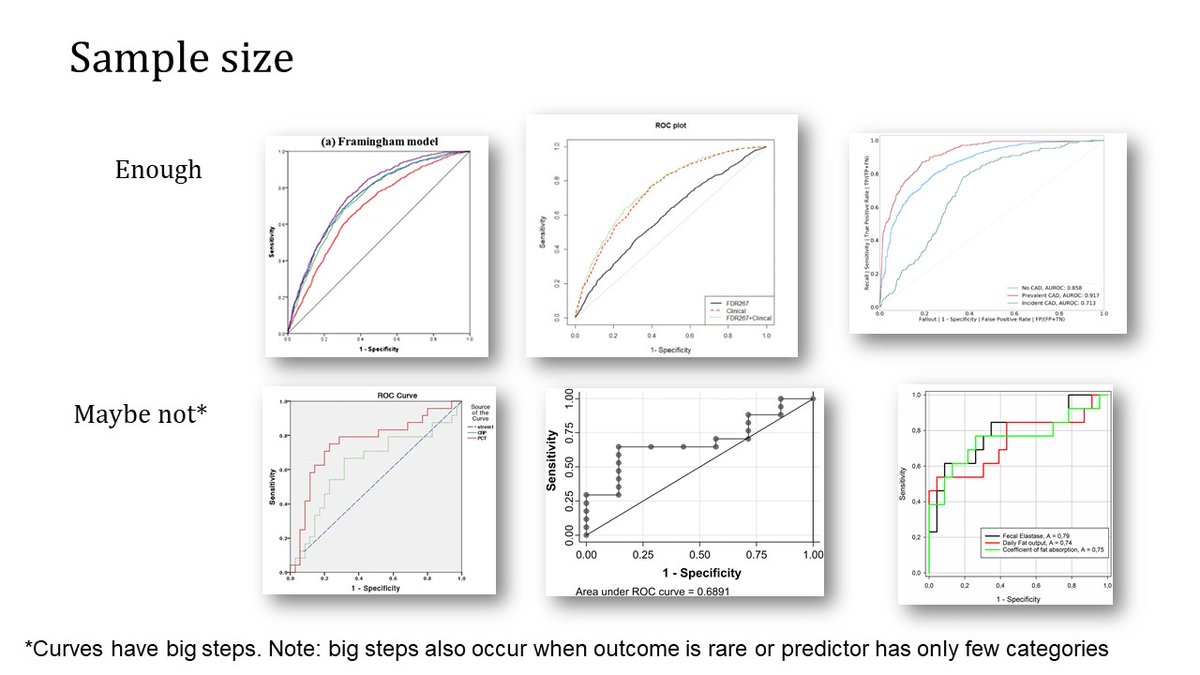 2. The differences between curves hint *how* adding predictors improves predictions. If the risk model will be used to identify high-risk indivs, the curves should differ in the lower left corner. Improvements only in the middle of the curve are unlikely relevant.
 Doing science means following the scientific method. The hypotheses we choose to investigate (also in hypothesis-free research) follows from the rigor of our background research and a process that is called inductive reasoning.
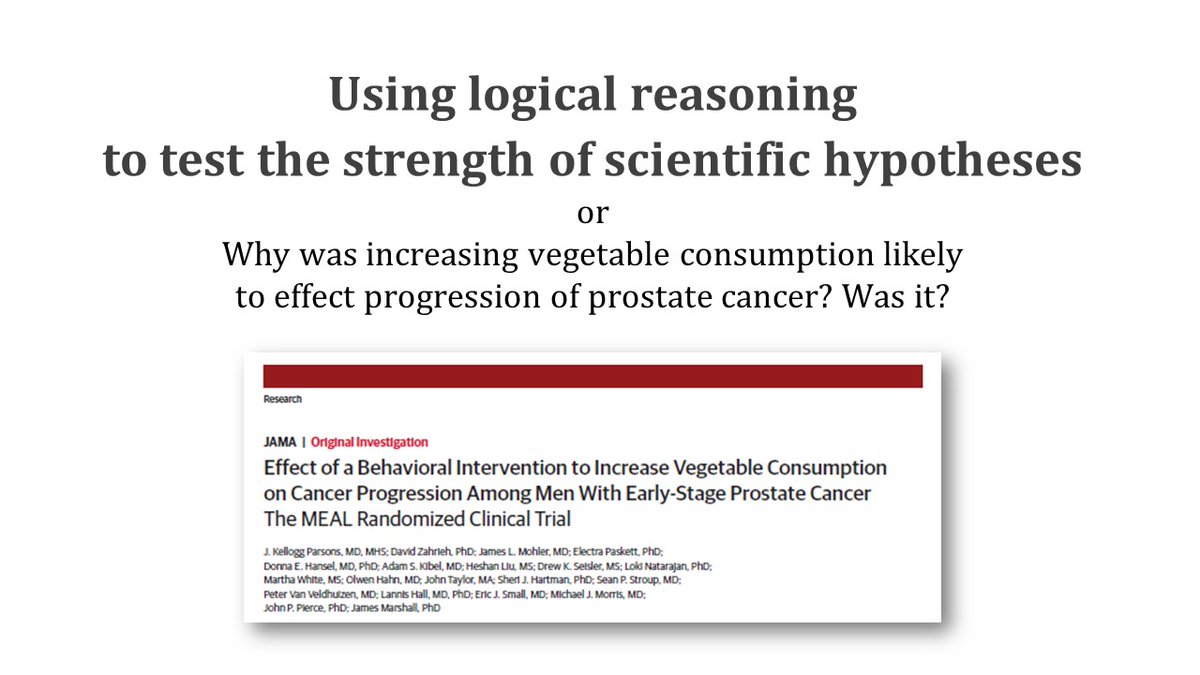 The most common forms are inductive and deductive reasoning.
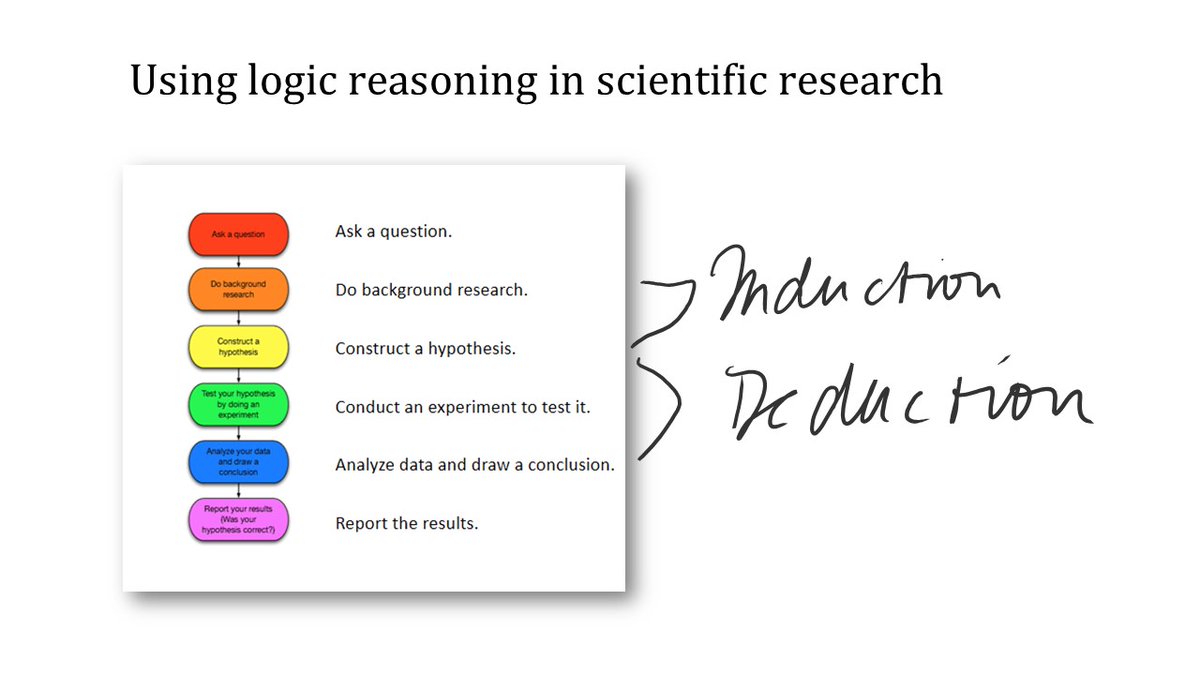

 I've never seen Cox PH being used this way: case-control data with time-varying exposure, with age at first exposure as timeline. Anyone?