
Kenan Sahin Distinguished Prof. of Poli Sci, MIT; Director, @MITElectionLab; Co-Director, @CaltechMITVTP
 The second graph is a scatterplot that shows the time (in hours) it took to declare a state (y-axis) against the ultimate margin of victory by the winning candidate. Intuitive result overall, but still significant variability.
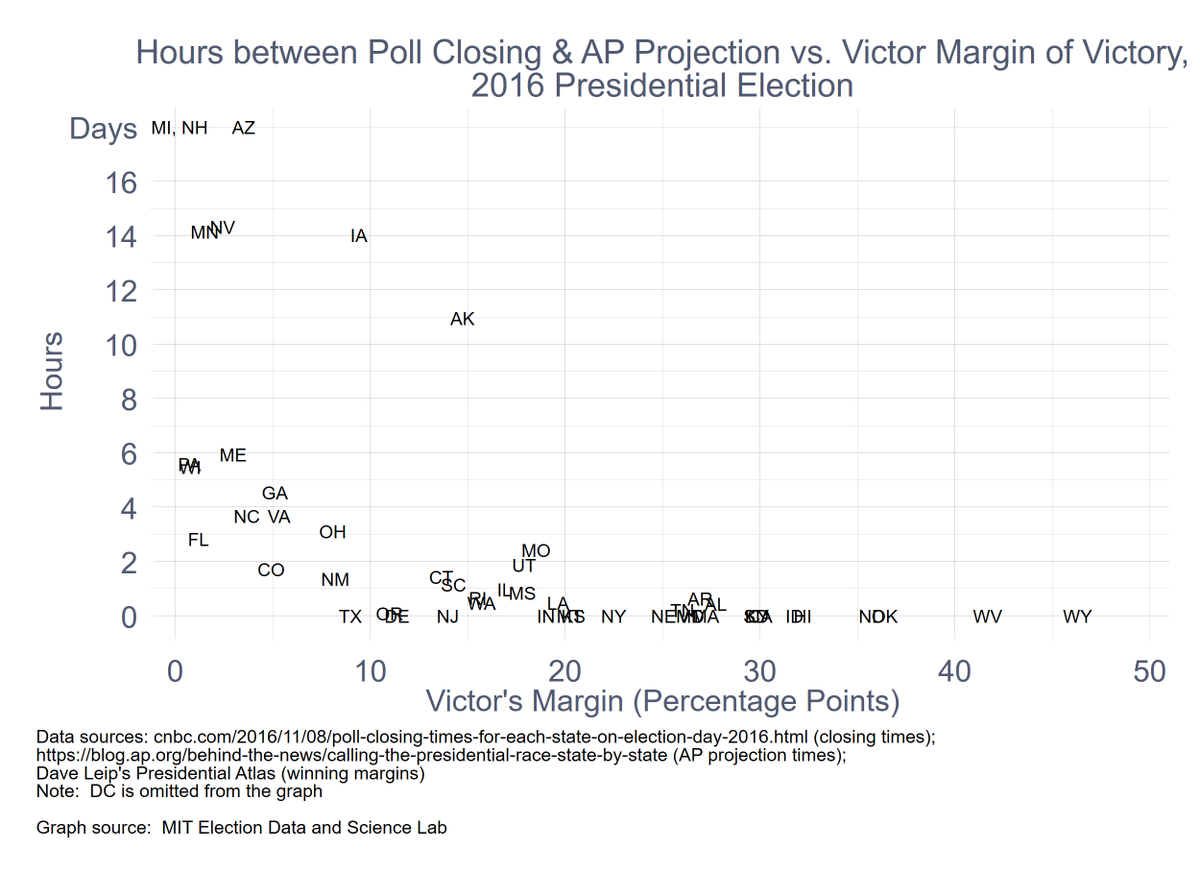
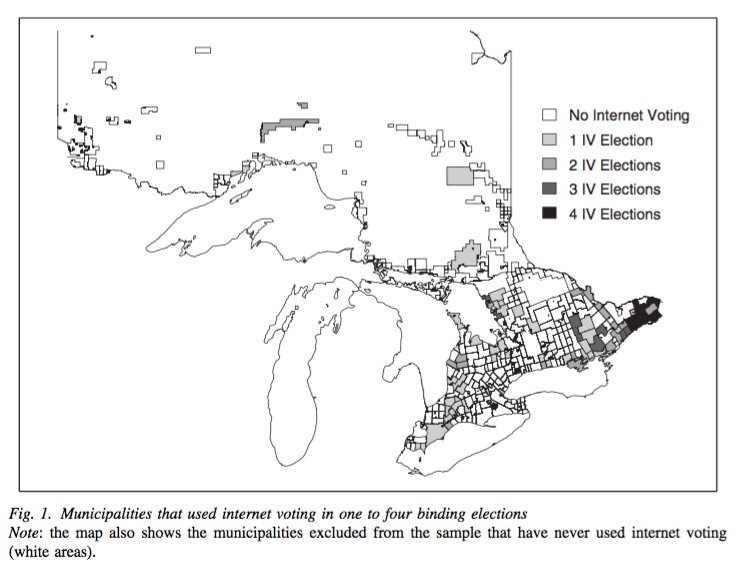 While framed as an article about Internet voting, it might be better to think about it as an article about convenience voting in low-salience elections. It has a lot for friend, foe, and indifferents about Internet and convenience voting to think about.