Spencer Mossman Profile picture
Oct 8, 2025 6 tweets 4 min read
📊 Premier League Midfielder Influence

🧵 Thread Image 95% of midfielder actions and responsibilities can fall into three buckets:

1) win the ball back
2) progress the ball
3) create or score

Depending on which part of the pitch the midfielder occupies, the importance of each varies; for Moi Caicedo I care more about his ability to do the first two, for Eberechi Eze I care more about the latter two... you get the picture.

This is the framework I generally use for midfielder evaluation, and it is also the topic of this thread.

These three tenets don't fully encapsulate "ability" or "quality", but they do illustrate "influence", which is in turn a component of ability.Image
Sep 2, 2025 7 tweets 6 min read
🇧🇪 Senne Lammens

- Pros: currently the best shot and cross stopping data in Europe
- Cons: not a sweeper, unproven from a minutes and competition level perspective

€21m for my favorite GK 'prospect' is one of the best deals of the window.

🧵 Thread. Image
Image
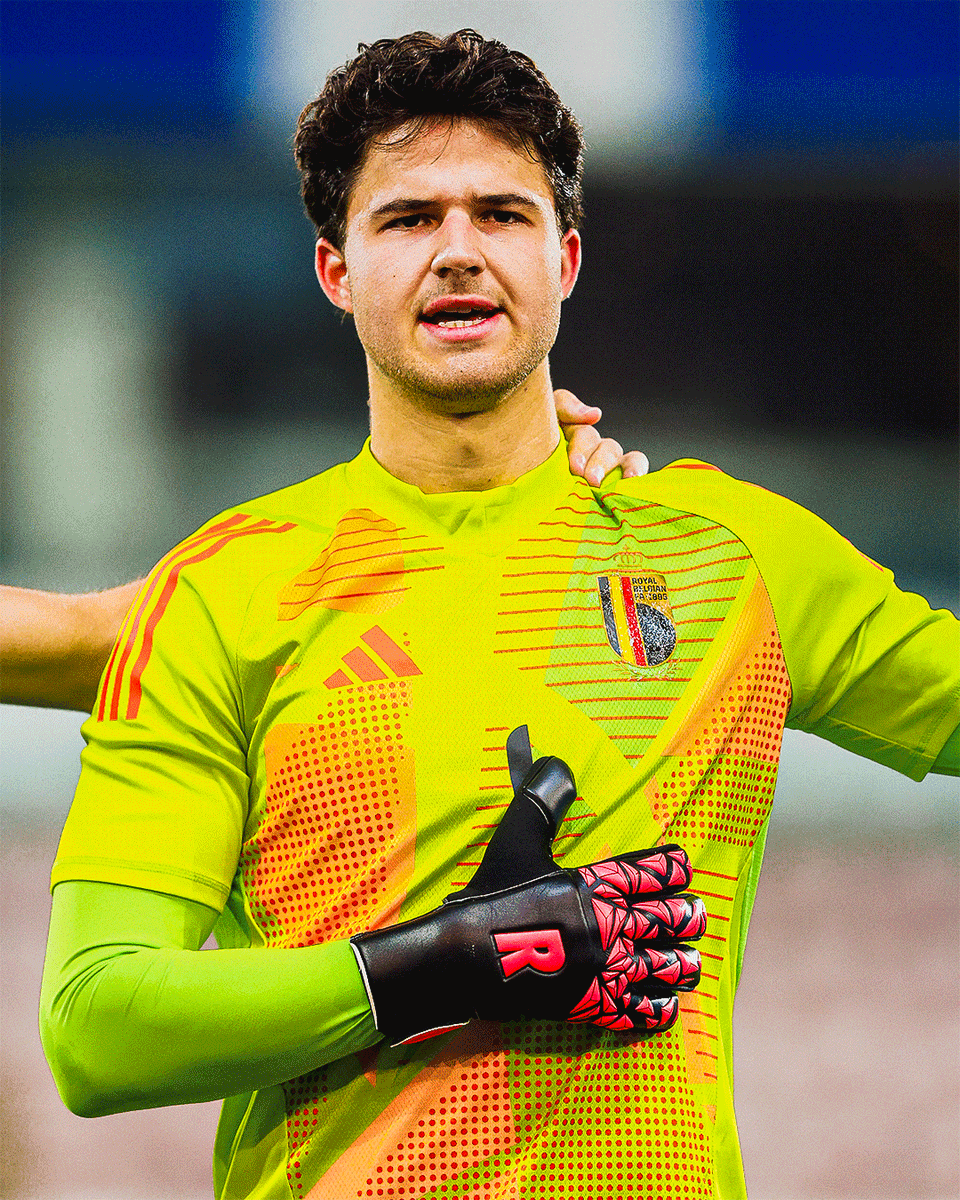
When I say Senne Lammens has the best shot and cross stopping data in the world currently, it is not hyperbole.

Below is the collective of T9 league (T5 + ENG2, BEL1, NED1, POR1) GKs with 2400+ minutes since the start of the '24/25 league campaign, plotted by PSxG-GA/Sh vs. cross stop %.

The latter metric is pretty self-explanatory, but the former is my favorite for measuring shot stopping... the post-shot xG faced by shots on target less goals, prorated to a per shot basis.

This means Lammens has added 0.078 worth of xG value for every shot he's faced - the third best mark in the dataset.

He also has the 8th best cross stop %, meaning he, indeed, has the best combination of the two metrics of any keeper at the top of Europe's game right now.

Some evergreen thoughts (for this thread, anyways); we have a big-time push & pull going on here that inflates and deflates the his data:

- Push: He's just 23 years old, and just about all GK metrics improve with age until the late 20s
- Pull: his sample size of just one season isn't huge, and it was in the Belgian Pro League which is a big step down from the Premier League

In my opinion, this nets to a slight qualitative docking you should apply to the data of his I will share. It is not as good as it seems, but also quite far ahead of most of his age-group peers, which evens out to "elite prospect" territory in my opinion.Image
Aug 5, 2025 7 tweets 5 min read
🇫🇷 El Chadaille Bitshiabu

- 6'5", 20 y/o, left footed CB
- ELITE progressive numbers for his age
- High activity box defender

The greatest delta between potential and hype of any young CB for me.

🧵 Thread. Image
Image
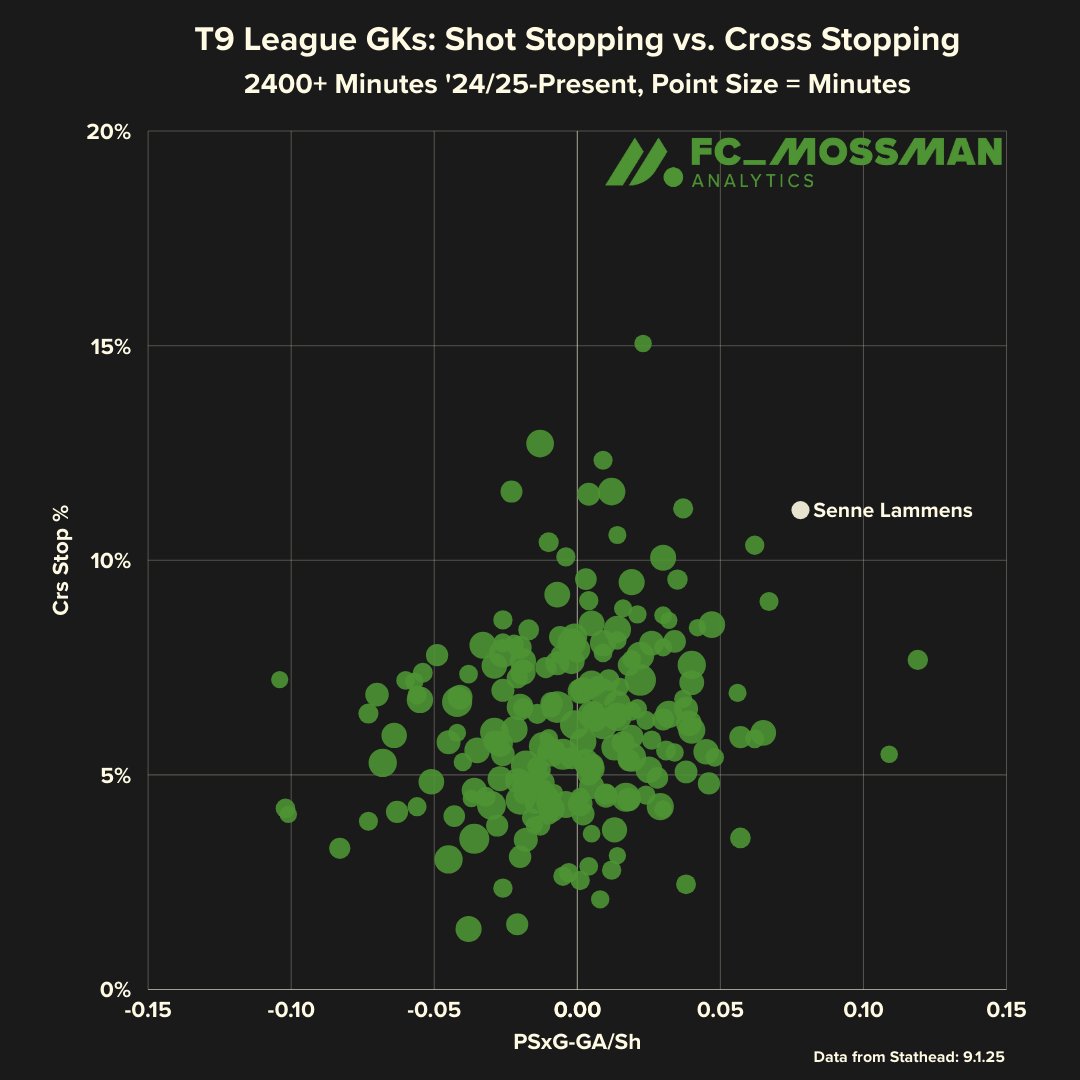
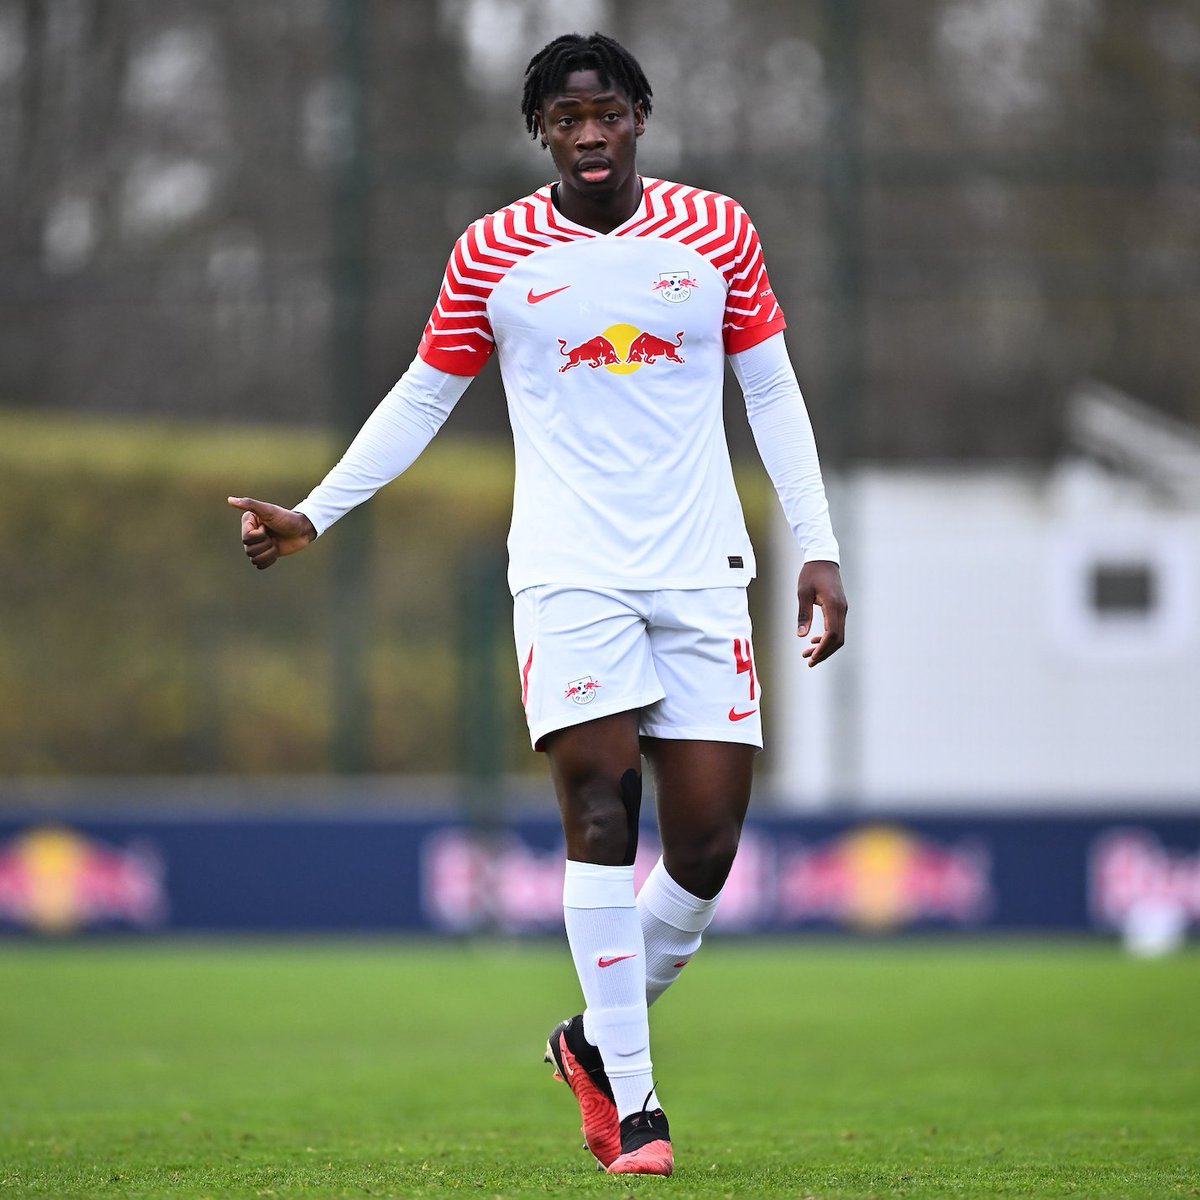
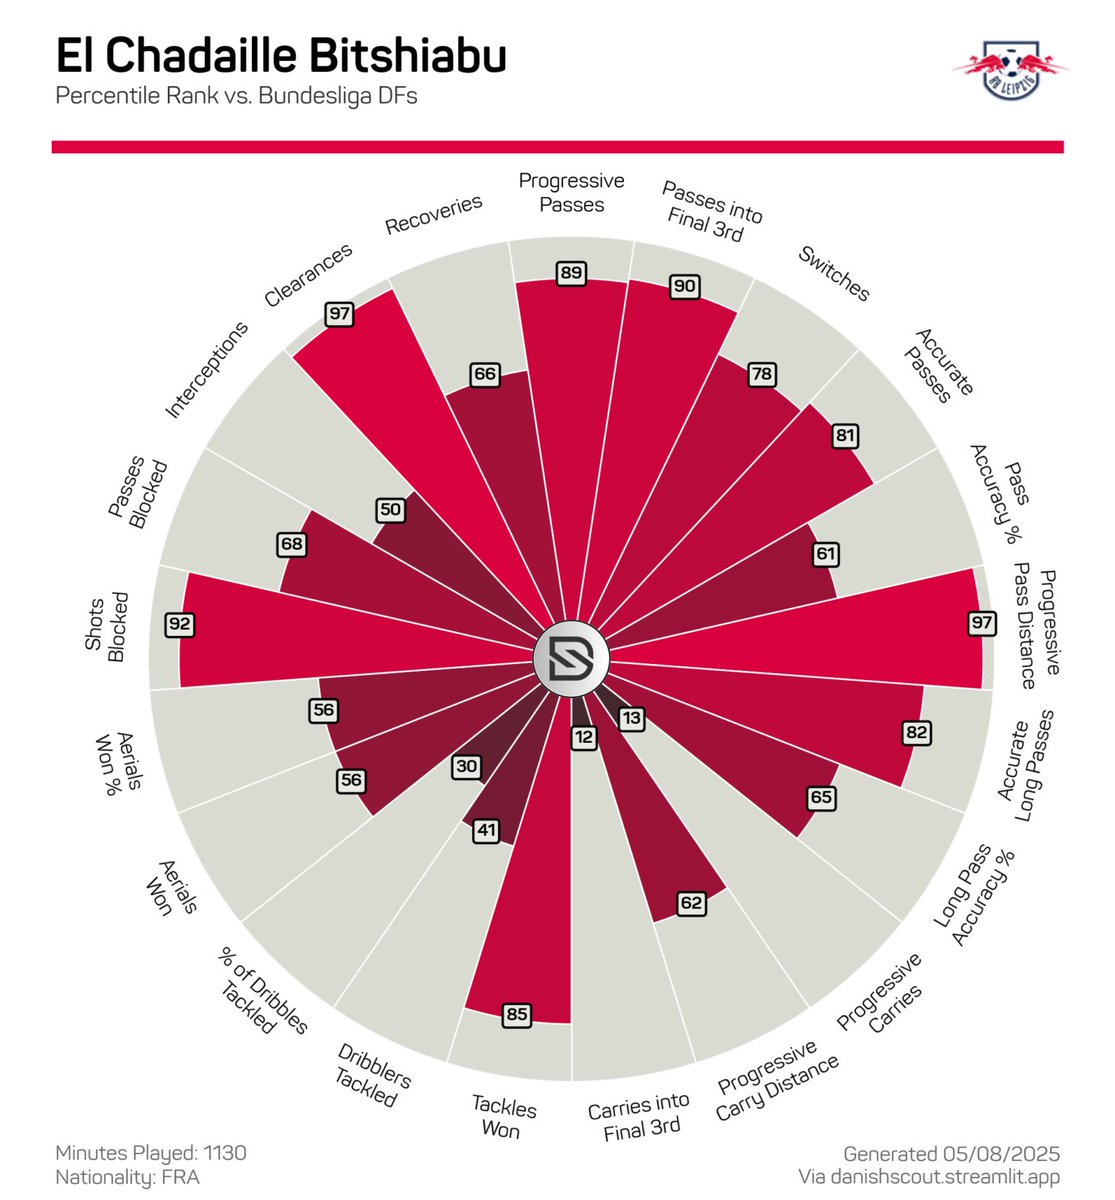
El Chadaille Bitshiabu is a massive left footed CB that came up through the PSG academy but was purchased by RB Leipzig in June 2023.

Less than two months later he tore the MCL in his right knee, which stymied his development.

However, this season, he came back in a huge way (the purpose of this thread).

I think he's best suited as a CCB in a back three, or LCB in a back four with an active wide area defending left back along side him. He and Castello Lukeba made quite pairing over the latter half of the season.Image
Jul 24, 2025 9 tweets 5 min read
🇧🇷+🇧🇷=🔴

🧵 Thread. Image
Image
Nottingham Forest continues to hammer the Brazilian market to significant effect, this time with two Botafogo gems, Igor Jesus and Jair Cunha.

In this thread, I'll give a bit of a scouting report on both players, plus expand on Forest's concerted efforts in South America.

I know the moves happened a couple weeks ago, but its a pretty unique approach within the Premier League, so wanted to give it special attention.Image
Jul 10, 2025 4 tweets 2 min read
🇧🇷 Rodrygo in La Liga for Real Madrid:

- 0.65 npxG+xA p90 on the left
- 0.43 npxG+xA p90 on the right
- Capable in a high press; willing to track back
- Consistently elite runner and man beater

Quality x Versatile.

🧵 Short Thread. Rodrygo off the left in green.

Rodrygo off the right in blue (maybe purple? idk I'm color blind).

Distinct improvement in all offensive output metrics when he plays on his favorite side. Image
Jul 9, 2025 10 tweets 8 min read
Debunking Hugo Ekitike's "poor finishing"

🧵 Thread. Image 
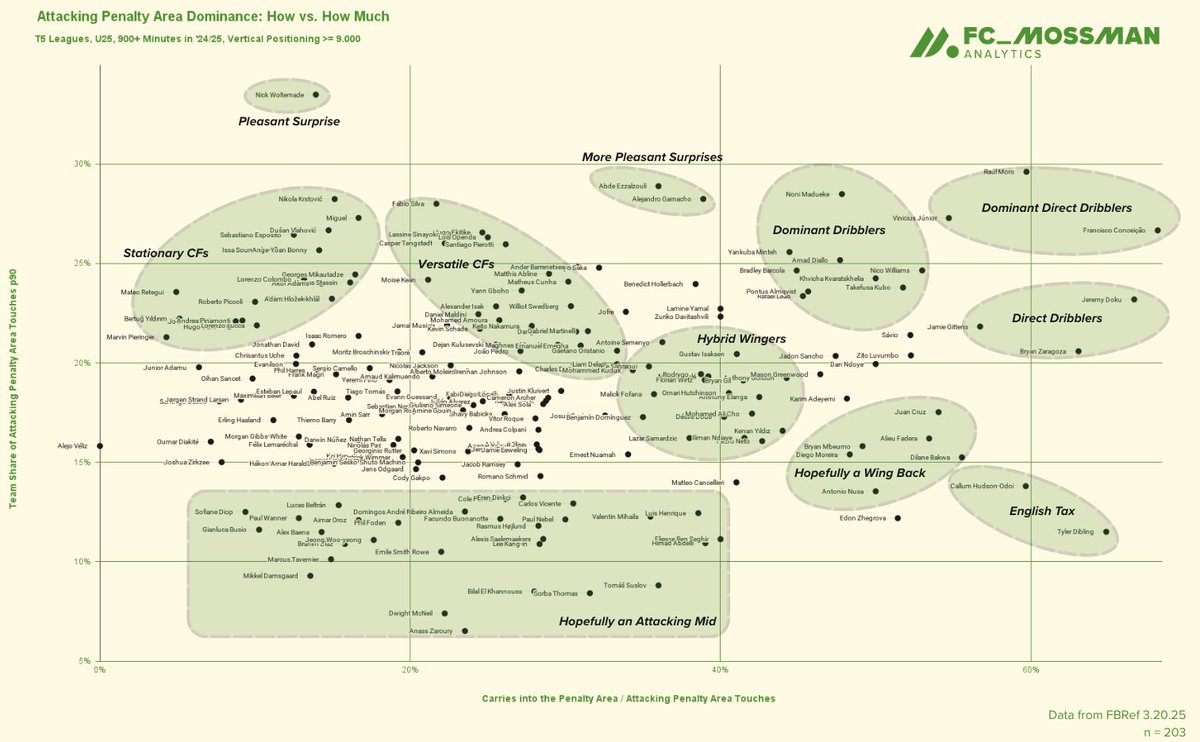
Ekitike looks like a poor finisher on surface level goals to xG analysis.

He had the largest np:G-xG underperformance in T5 leagues this past season, underachieving his npxG by 5.3 goals.

Below is the list of 9 players to under-perform npxG with 100+ shots.

Ekitike is joined by Valentin Castellanos, Nikola Krstovic, and Robert Lewandowski as the only "CFs" to be on the list.Image
Jun 26, 2025 8 tweets 4 min read
🇪🇸 Cristhian Mosquera

➕ Tenacious tackling, burgeoning on the ball
➖ Surprisingly poor in the air
📈 Massive ceiling

🧵 Thread. Image
Image
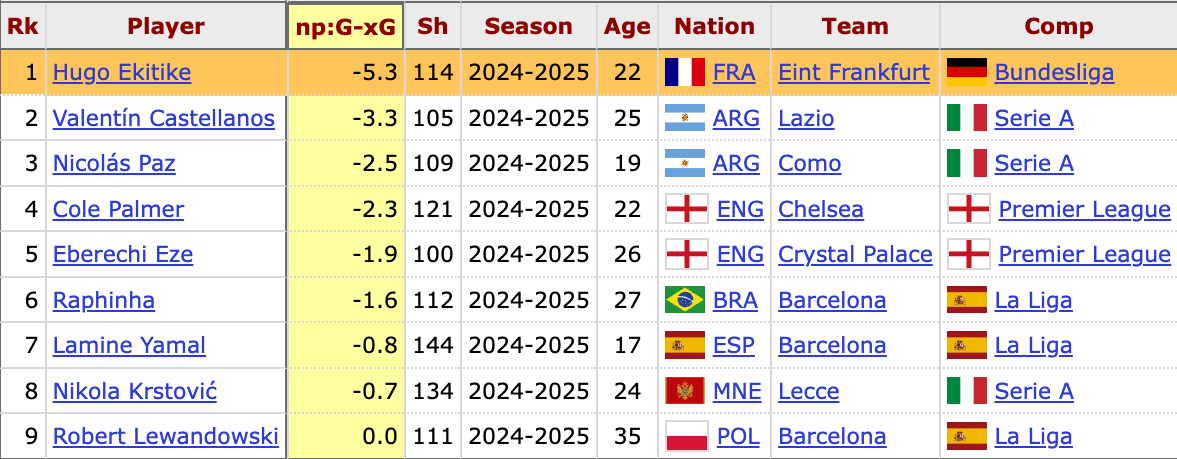
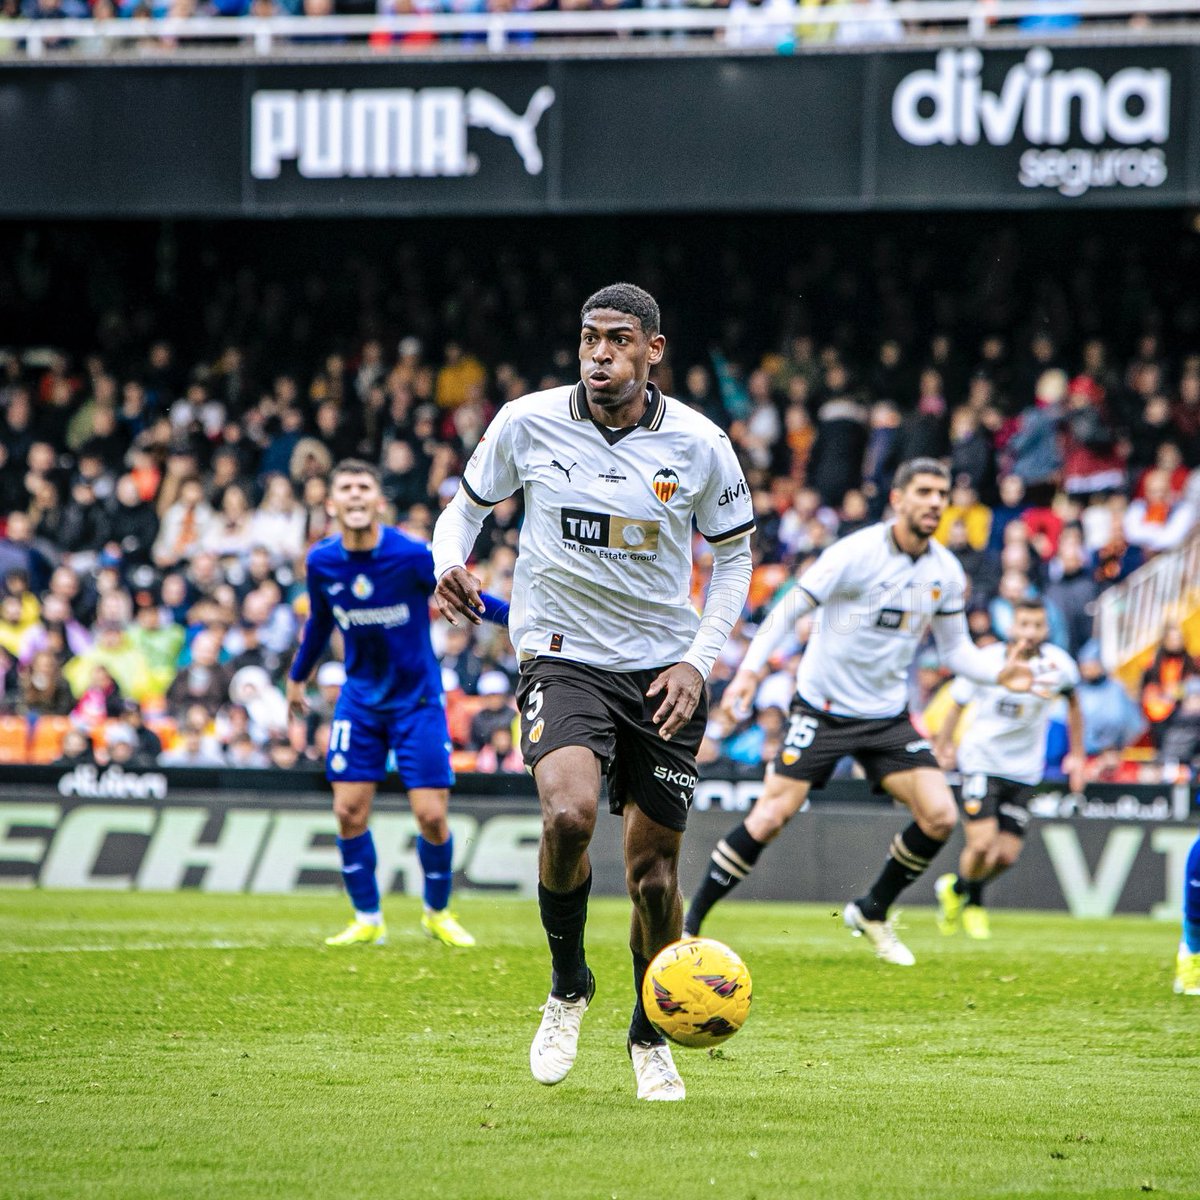
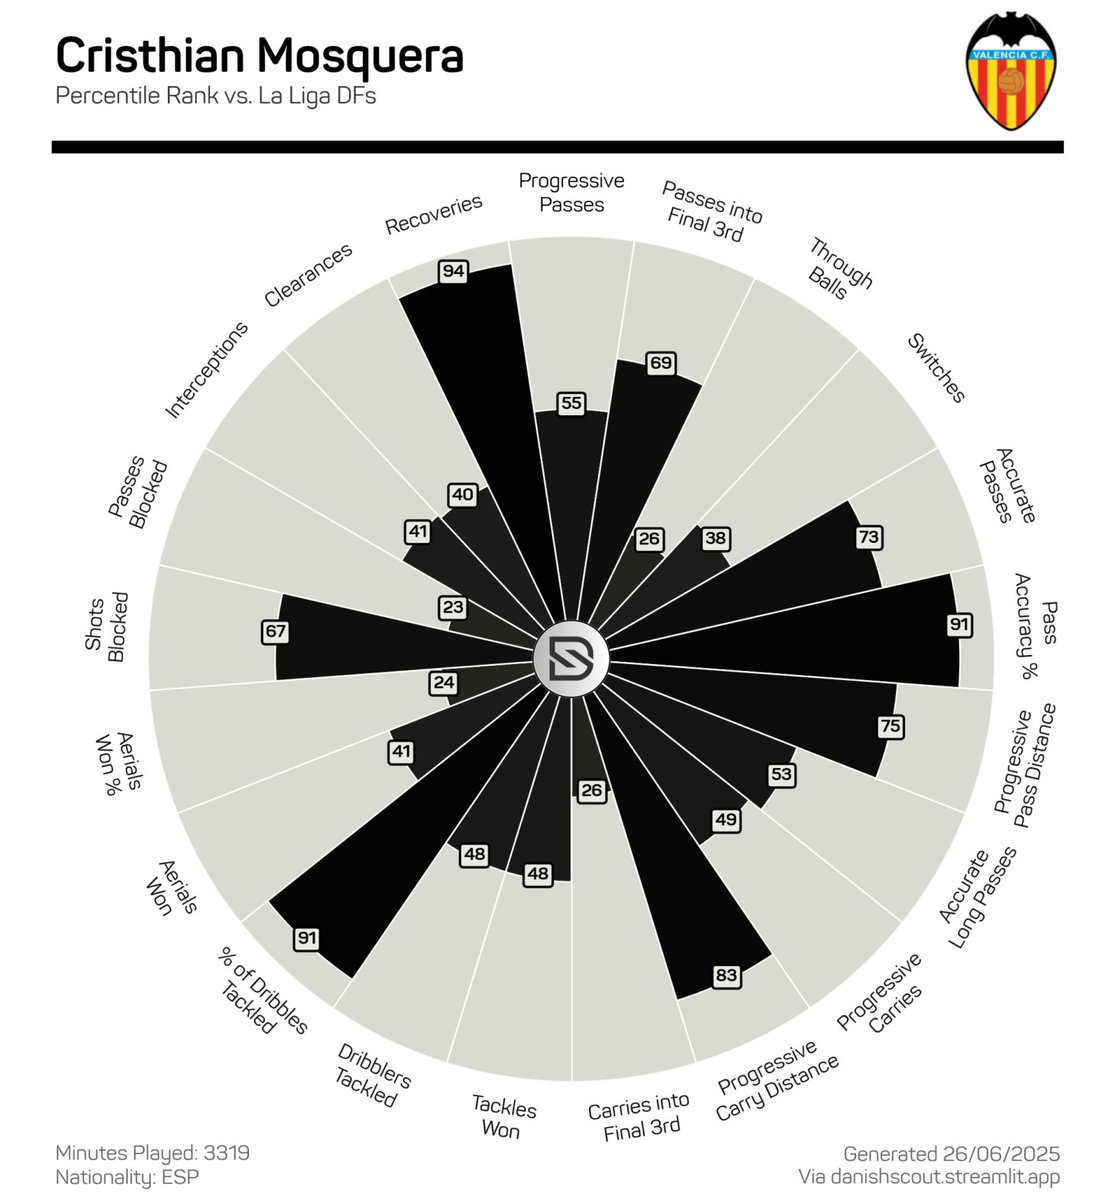
Cristhian Mosquera made a pretty considerable leap in terms of his ball playing from last season to this season.
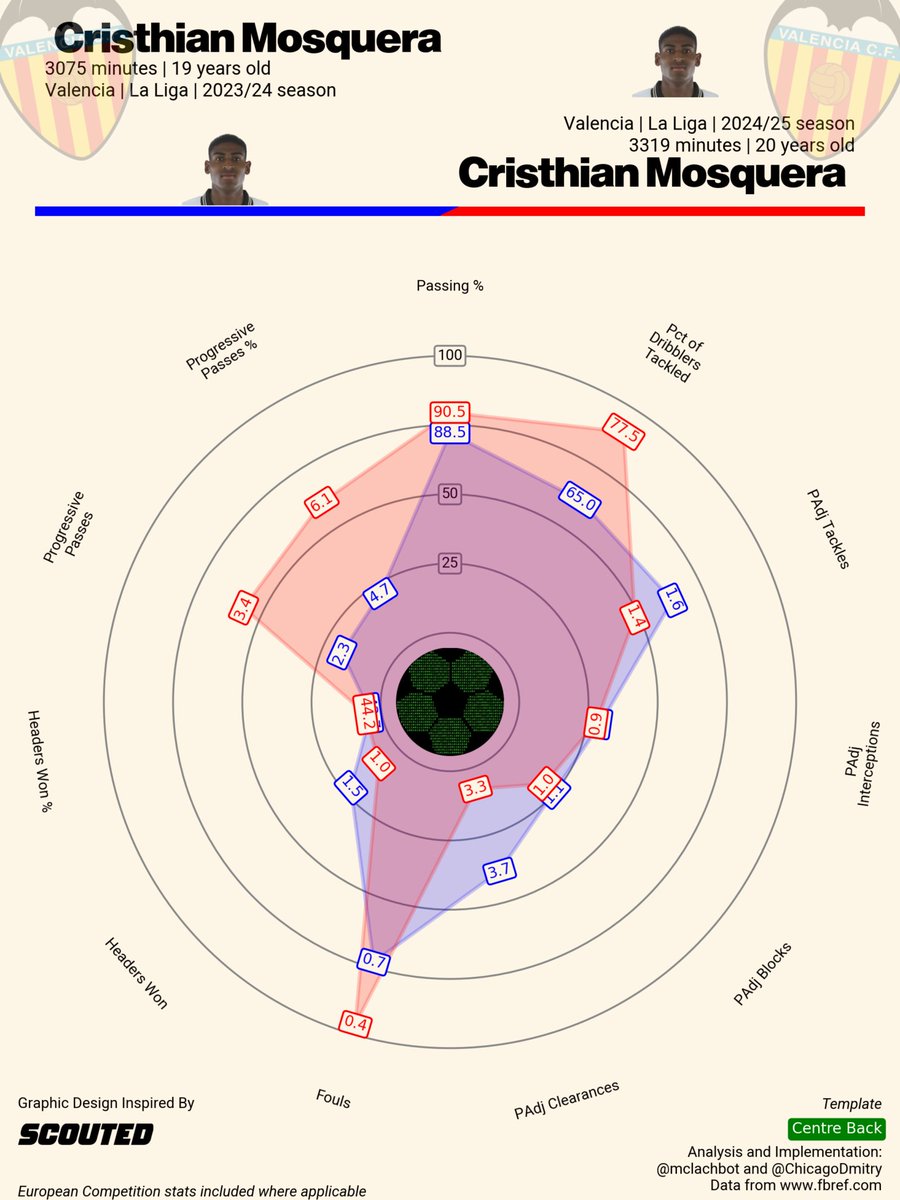
These are the types of improvements you want to see from a young CB... and keep in mind, today is his 21st birthday. He's still very young.

Plus, he (reportedly) initially favored basketball in his youth, then when he made the switch to football, it was futsal first. He had a bit later start to the game than most at the top levels, so his runway for improvement is even greater than it might seem.Image
Jun 19, 2025 9 tweets 8 min read
📸📊 Premier League: Carries with End Product

🧵 Thread. Image Context

I've always been interested to see the end results of carries, so very convenient I stumbled upon this Opta data. Keep in mind this is not possession adjusted, so players on teams like City and Liverpool will look especially productive.

Am I going to be doing this on other leagues? Yes - I've already done Ligue 1, and will do the other T5 leagues besides Serie A because as of writing, they don't have this data on the Opta website.

Don't see someone you expected to? Check out the filter criteria under the graph title.

Also, Opta defines carries as "the player moving the ball five meters or more."

Let's get into the groupings.Image
Jun 13, 2025 7 tweets 4 min read
📸📊 U23 Full Backs: In- and Out-of-Possession 1v1 Aptitude

🧵 Thread. Image Overview

At first I wanted to see if there was any correlation between dueling in and out of possession, and it doesn't seem to be the case, but still makes for an interesting graphic.

Each axis is the combined z-score of total duels p90 + success rate for defensive (x-axis) and take on (y-axis) actions.

This is a graph where top right = best, but best for a specific set of skills, not best all-around.

Team environment does of course impact both axes (possession being the primary influence).

Thoughts on the groupings ⬇️Image
Jun 12, 2025 9 tweets 6 min read
📸📊 U23 Midfielders: Progressive Passing Tendencies

"Conductors, Pioneers, and Recyclers"

🧵 Thread. Image Thread Overview

The idea of this thread is to isolate specific elements of young no. 6 and no. 8 profiles:

Do they prefer to progress or recycle the ball, and how aggressively do they do so?

To do this, I plotted all 112 T5 League CMs w/ 900+ minutes by their average distance per completed pass, and the percentage of total passing distance that is progressive.

Each grouping can be defined by the order in which they prioritize progression and retention:

- Pioneers: progression over retention
- Recyclers: retention over progression
- Conductors: don't give a fuck about retention, the only way is aggressively forward

Let's get into the groupings!Image
Jun 11, 2025 11 tweets 7 min read
🇭🇷 Martin Baturina

- Loves the left half space, but a playmaker the entire width of the pitch ↔️
- Willing and capable crosser 🪄
- Aggressive dribbler 🃏
- Stepping to the perfect project at Como📈

🧵 Thread. Image
Image
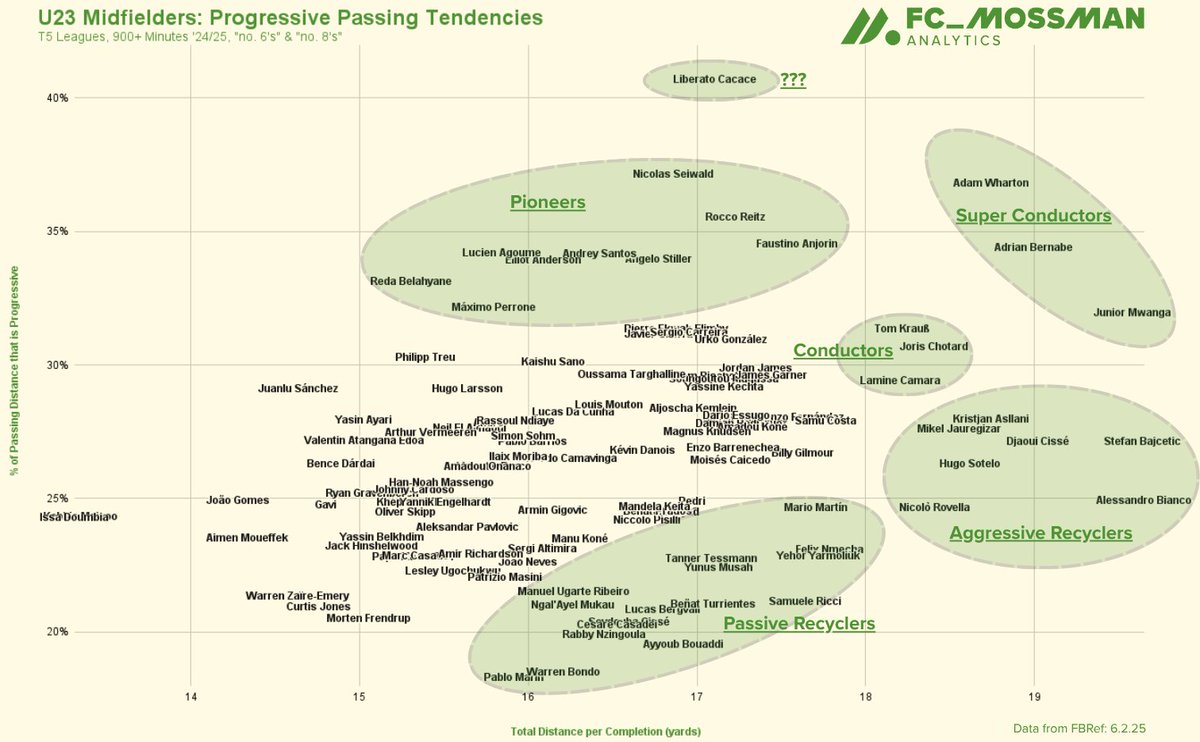
Martin Baturina: Overview
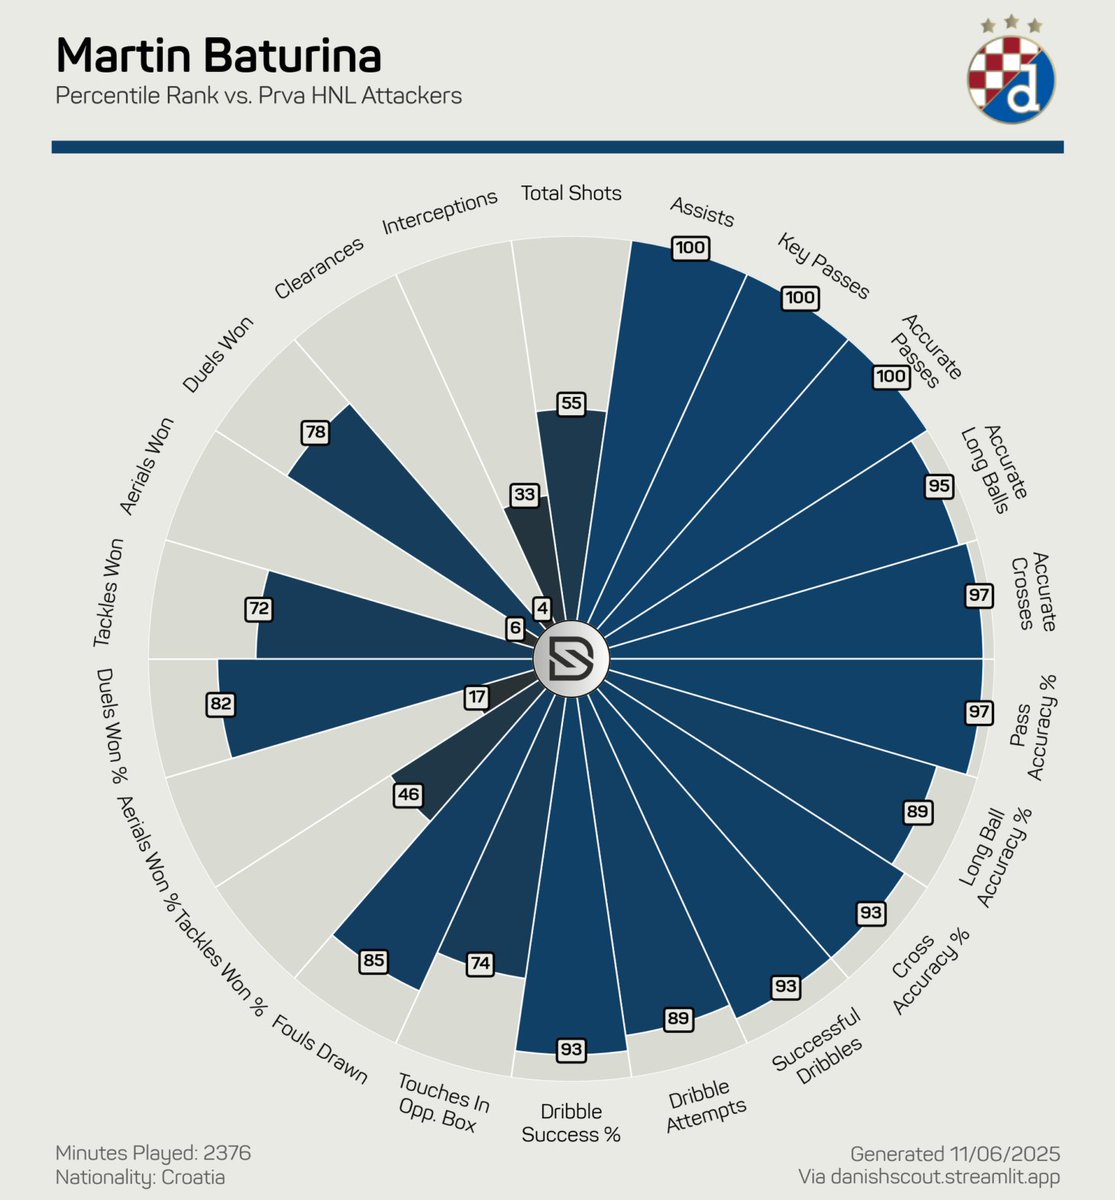
Kind of hard to discern in possession strengths when all the metrics go brrrrr, plus this data is from this past season in the Croatian HNL, which is a step or two down from Serie A, where he will be playing next season for Como.

From what I was able to discern, his strengths include general chance creation, ball carrying and take ons, as well as passing in build up phases.

His out of possession metrics could use some work, but this data is comparing him to midfielders, and he is more of an attacking midfielder/winger. Plus, they were accrued for Dinamo Zagreb, who had BY FAR the highest possession in the league with 60%, so take the general graph with a grain of salt.

Mostly just felt the need to share because of how crazy his in-possession numbers are - he could not be more ready to move beyond this league.Image
Jun 6, 2025 10 tweets 7 min read
🇸🇮 Benjamin Šeško

📉 Numbers
📈 Hype

What gives?

Look beyond goals and xG and you will find a sleeping juggernaut.

🧵📊 A detailed data thread. Image
Image
Overview

The idea behind this came from the radar chart in the first post of this thread; his numbers declined DRASTICALLY this season.

I set out to find out: did he hit a bit of a wall in his second Bundesliga season, or were there underlying reasons for his numbers to dip?

Plus, he's a pretty big domino in the CF landscape I haven't analyzed directly, so it felt like a good time take the plunge.

In this thread, I'll be generally comparing him to one of two groups:

- Broad sweeping peers: The 92 U21 forwards in T5 leagues w/ 900+ minutes in either of the past two seasons
- Bundesliga peers: The eight U24 Bundesliga center forwards w/ 7.0+ npxG this season (you'll see why this grouping in a bit)

To start though, I asked my followers what they thought of his performances this season relative to last. The results of the poll are below.

Before researching, I would've said regressed, but after the fact, I think the opposite 🪝

Let's get into it!Image
Jun 3, 2025 16 tweets 10 min read
📸📊 The GK Landscape

🧵 Mega thread. Image Thread Overview/Methodology

The GK market is quietly one of the most fascinating to follow this summer, and I don't put out much content on the position, so I feel this is long overdue.

Straight away: TOP RIGHT DOES NOT MEAN BEST.

No quadrant is better than the others... the players are grouped based on data similarity, not quality of numbers.

The GKs in the study were all keepers with a 5m+ Transfermarkt value at time of writing, that had meaningful advanced data.

To group the GKs, I ran a PCA analysis on their cumulative numbers from '21/22 - '24/25 in the following categories:

- Shot Stopping: PSxG-GA/Shot; Save %
- Distribution: Pass Value Efficiency; Launched Pass Completion %
- Cross Stopping: Cross Stop %
- Sweeping: Actions Outside the Penalty Area p90

The below is the result, where all keepers fell into one of the four FIFA chem style themed clusters (with the general theme of the grouping... not necessarily an exact description of each profile):

- Cat: shot and cross stoppers
- Wall: cross stopping and sweeping
- Glove: balanced
- Shield: distribution and sweeping

Let's get into some of my thoughts on the whole of the graph.Image
Jun 3, 2025 7 tweets 4 min read
G/xG over-performance: repeatable or isolated?

Re: Matheus Cunha and Bryan Mbeumo

🧵 Thread. To set the stage, I put out what was honestly a throwaway tweet from a quick idea I had while walking my dog about how Bryan Mbeumo and Matheus Cunha were the two highest G/xG out-performers in the PL this season. My feelings on the matter remain unchanged:

- Good players, good fits for Amorim's system, have value beyond a high goal tally.
- Their price is inflated because they outperformed xG... if they had 16 npG+A seasons like their xG+xAG suggests was fair, rather than the 21 and 22 they achieved, I think both the perceptions of the moves + the fees paid are lower. Textbook sell highs by Wolves and Brentford, but also not sure what else United could do if they wanted to the prime-aged forward market.

One of the replies got me thinking: how do players perform outside of spike G/xG seasons?
May 23, 2025 14 tweets 9 min read
🇩🇪 Florian Wirtz

"Paying for Game Breaking"

🧵📊 A detailed data thread. Image Thread Overview

Florian Wirtz is a super footballer. Is he worth the (alleged) €150m price tag? I'm still not 100% sure, but he does have several traits that make him uniquely dynamic and "game breaking".

In this thread, I'll be analyzing his data compared to the 117 other u23 advanced midfielders/wingers with 900+ minutes in T5 leagues this season.

Let's go!Image
May 18, 2025 12 tweets 7 min read
🇳🇱 Jeremie Frimpong: Arne Slot's New Rook ♟️🐦‍⬛

🧵 A detailed data thread. Image This thread contains the highlights, but if you're interested, I wrote 1,500 words on the subject in the below article.

medium.com/@fc_mossman/je…
Apr 29, 2025 8 tweets 6 min read
🇬🇷 Konstantinos Karetsas

🧵📊 A data scouting thread. Image Thread Overview

I wanted to put this out yesterday, but the Spanish gridlock had other plans.

There are tons of talented young attackers (specifically wingers and AMs) in non-T5 leagues that I don't know enough about, so I'm going to be doing a data deep dive on the ones that interest me most, comparing Opta data, where available, to the Opta data from FBRef for T5 leagues over the past two seasons.

I have a few names in mind I would like to analyze over the next couple of weeks, but if there's a player you'd like to see from a non-T5 league, reply with their name (provided they're in a large enough league for data collection).

I will be sticking to attacking midfielders and wingers, with the a selection of 10 data points to analyze ability, tendencies, archetype comps, and level of impact should they make a move to a major league.

All metrics, unless otherwise noted, are adjusted for league strength and possession, so this will offer a truer picture of where the player would translate in comparison to the numbers generated by players in stronger leagues.

In effect, the adjusted values should be looked at for what the player is now, and the unadjusted for what they could be if they reach their potential.

"Le mieux est l'ennemi du bien" - I know this is not the most comprehensive approach, and you should always watch the player to contextualize the data, but this analysis should provide an excellent baseline for the archetype + potential impact level of the player.

Let's get into it!Image
Apr 26, 2025 9 tweets 6 min read
🇦🇷 Claudio Echeverri

🧵📊 A data scouting thread. Image Thread Overview

There are tons of talented young attackers (specifically wingers and AMs) in non-T5 leagues that I don't know enough about, so I'm going to be doing a data deep dive on the ones that interest me most, comparing Opta data, where available, to the Opta data from FBRef for T5 leagues over the past two seasons.

I have a few names in mind I would like to analyze over the next couple of weeks, but if there's a player you'd like to see from a non-T5 league, reply with their name (provided they're in a large enough league for data collection).

I will be sticking to attacking midfielders and wingers, with the a selection of 10 data points to analyze ability, tendencies, archetype comps, and level of impact should they make a move to a major league.

All metrics, unless otherwise noted, are adjusted for league strength and possession, so this will offer a truer picture of where the player would translate in comparison to the numbers generated by players in stronger leagues.

In effect, the adjusted values should be looked at for what the player is now, and the unadjusted for what they could be if they reach their potential.

"Le mieux est l'ennemi du bien" - I know this is not the most comprehensive approach, and you should always watch the player to contextualize the data, but this analysis should provide an excellent baseline for the archetype + potential impact level of the player.

Let's get into it!Image
Apr 25, 2025 7 tweets 5 min read
🇦🇷 Franco Mastantuono

🧵📊 A data scouting thread. Image Thread Overview

There are tons of talented young attackers (specifically wingers and AMs) in non-T5 leagues that I don't know enough about, so I'm going to be doing a data deep dive on the ones that interest me most, comparing Opta data, where available, to the Opta data from FBRef for T5 leagues over the past two seasons.

I have a few names in mind I would like to analyze over the next couple of weeks, but if there's a player you'd like to see from a non-T5 league, reply with their name (provided they're in a large enough league for data collection).

I will be sticking to attacking midfielders and wingers, with the a selection of 10 data points to analyze ability, tendencies, archetype comps, and level of impact should they make a move to a major league.

All metrics, unless otherwise noted, are adjusted for league strength and possession, so this will offer a truer picture of where the player would translate in comparison to the numbers generated by players in stronger leagues.

In effect, the adjusted values should be looked at for what the player is now, and the unadjusted for what they could be if they reach their potential.

"Le mieux est l'ennemi du bien" - I know this is not the most comprehensive approach, and you should always watch the player to contextualize the data, but this analysis should provide an excellent baseline for the archetype + potential impact level of the player.

Let's get into it!Image
Apr 10, 2025 9 tweets 8 min read
📸📊 The 2025 Center Forward Landscape

🧵 A detailed data thread Image Methodology

I set out to make a "striker transfer market primer" of sorts.

The forwards included in the project are all strikers and second strikers that, according to Transfermarkt, have a current value of €15m+, are 27 or younger, and have a league season with at least 800 minutes in the past two seasons with available advanced data.

The aim was to bucket the forwards into categories based on similar profiles, including forwards that could likely be on the move for a large fee (the reason for the value and age constraint).

Yes, that means it includes players that will not be moving this summer like Haaland and Mbappé, but they are there for reference on other's positions. The majority of the analysis will be done on those that could be on the move this summer.

If you're interested in the details of how I bucketed the players, read on. If you just want to see the player analysis, jump to the next post.

Once I refined the list, I built scores for "abilities", which were weighted z-scores for the percentile rank of the forward's values for each ability from the most recent qualifying season. They were the below:

- Box Domination: equal parts npxG p90, team share of npxG, shots p90, team share of shots, attacking penalty area touches p90, team share of attacking penalty area touches
- Conversion: npG/npxG (for all league shots dating back to '21/22)
- Chance Creation: equal parts xA p90 and chances created p90
- Carrying: 3x Take Ons p90, 1x Take On %
- Pressing: 2x Tackles p90, 1x Recoveries p90
- Aerial: 3x Aerial Duels p90, 1x Aerial Duel %

I would have loved to included things like shot creating actions from take ons, or team share of the other advanced metrics, but some of the non-T5 leagues required heavy data cleaning from non-FBRef sources (primarily FotMob, since they and FBRef both use Opta data), and I am time constrained like everyone else.

Next, I took the Opta "Strongest Leagues" data to create a multiplier so the data collected in better leagues was weighted more favorably... it ultimately just lead to reductions for the lower-level leagues, not so much boosting the good ones.

From there, I ran a PCA to bucket the data based off of those six scores, and the below emerged.

Do not read into this fully as "top right is best, bottom left is worst", as this is a profiling exercise. That said, in looking at the graph, to me, it seems "Physical Disruptors" are the in-training version of the "Target Man"; same for "Second Striker" to "Modern CF".

Also, not every striker's grouping will match your perception of them perfectly. Some surprised me, like Darwin Núñez being a "second striker". While there is a heavy element of 'how the striker is used' that determines their grouping, not just their raw abilities, keep an open mind for ones you think don't make sense, and consider why that player's data so perfectly matches others in that grouping.

Finally, if this style of visualization looks familiar, it is because a good chunk of this was inspired by how @FootballEcon_ presents their data. I didn't set out to copy, but I would be remiss to not credit their work as an influence in how the graph was structured after I had the idea of what I wanted to do.

Let's get into the analysis of the groupings.Image
Apr 1, 2025 7 tweets 7 min read
📸📊 Attacking Penalty Area Dominance: "How" vs. "How Much"

🧵 A detailed data thread. Image Thread Overview

The graph is like 75% stylistic grouping and 25% ability indication, so don't automatically look to the top right and assume the best players should be there.

- X axis: how many of a player's attacking penalty area touches are initiated by them with a dribble (left = primarily receive in the penalty area, right = primarily carry into it).

- Y axis: % of team's attacking penalty area touches (APAT) they see (prorated to p90).

The X axis is purely stylistic, and the Y axis is kind of an ability indication as dominating your team's APAT is mostly "skill" in my opinion. However, the more forward a player is positioned, the higher their % will naturally be, so view this as a skill for CFs and advanced wingers, but don't penalize attacking midfielders that are lower on the graph.

This was purely born from the idea that I wanted to visualize player behavior around the box... nothing complex.

If you don't see someone you're looking for, they're probably buried in a cluster, don't play far enough forward, or didn't have 900+ league minutes heading into the most recent international break.

Let's go through the groupings.

(2/7)Image