Gautam Mazumdar Profile picture
Trader in stock market/ Technical Analysis Trainer / tweets educational/ https://t.co/NUKa5WSTnr https://t.co/CiufCdkXGt
Sakharam shinde Profile picture Dhananjay Rao Profile picture shiva vuyyuru Profile picture Anjan Pal Profile picture Prasanth Reddy Profile picture 13 subscribed
Sep 5, 2022 14 tweets 3 min read
A tweet of mine went viral over the weekend. I received scores of DM on how to improve trading and some guidance as the person concerned was not in good shape in trading. First an honest CONFESSION from my side. Since I am not aware of your financial status / commitment / temperament and liability, I cannot help you out.
Jun 27, 2020 18 tweets 5 min read
Weekend review of Nifty

The three trends analysis
Primary: Down
Intermediate term: Up. The trend will turn down only if lower high lower low sequence is formed in daily charts by close. As per the present setup, move below 9813 will terminate the ongoing uptrend....... This level may change in coming days if swing in market change. (This is as per Dow theory, whose major drawback is signal generated is too late)

Short term: Up: The short term is up and close below 13 SMA which is at 10130 will change the mood......
Jun 20, 2020 18 tweets 5 min read
Weekend review of Nifty

The three trends analysis
Primary: Down
Intermediate term: Up. The trend will turn down only if lower high lower low sequence is formed in daily charts by close. As per the present setup, move below 9813 will terminate the ongoing uptrend... .... This level may change in coming days if swing in market change. (This is as per Dow theory, whose major drawback is signal generated is too late)
Short term: Up : The short term is up and close below 13 SMA which is at 10029 will change the mood...
Jun 18, 2020 8 tweets 2 min read
Advance decline ratio (External Indicator)
Number of advancing stocks: Advance
Number of declining stocks: Decline
The ratio of the two is called advance/decline ratio or popularly A/D ratio. A day when markets move up, if it healthy advancing stocks are more than declining. The down days are just opposite i.e. declining stocks are more than advancing.
However there are some days when in spite of market moving up, advancing stocks are lesser in number. ...
Jun 6, 2020 20 tweets 5 min read
Weekend review of Nifty
Previous week I had expected upside move and that too strong because of short covering. It has been vindicated by the market. The three trends analysis
Primary: Down
Intermediate term: Up. The trend will turn down only if lower high lower low sequence is formed in daily charts by close
Short term: Up The trend will turn down if we have a close below 9944 or as time progresses we get next short term low.
May 31, 2020 10 tweets 3 min read
My weekend review of Nifty
Key observations
1.Instead of bar or candlestick chart if we have a look at line chart (close) of Nifty we can clearly see “higher high & higher low formation” on intermediate term time frame. However the primary trend remains down. 
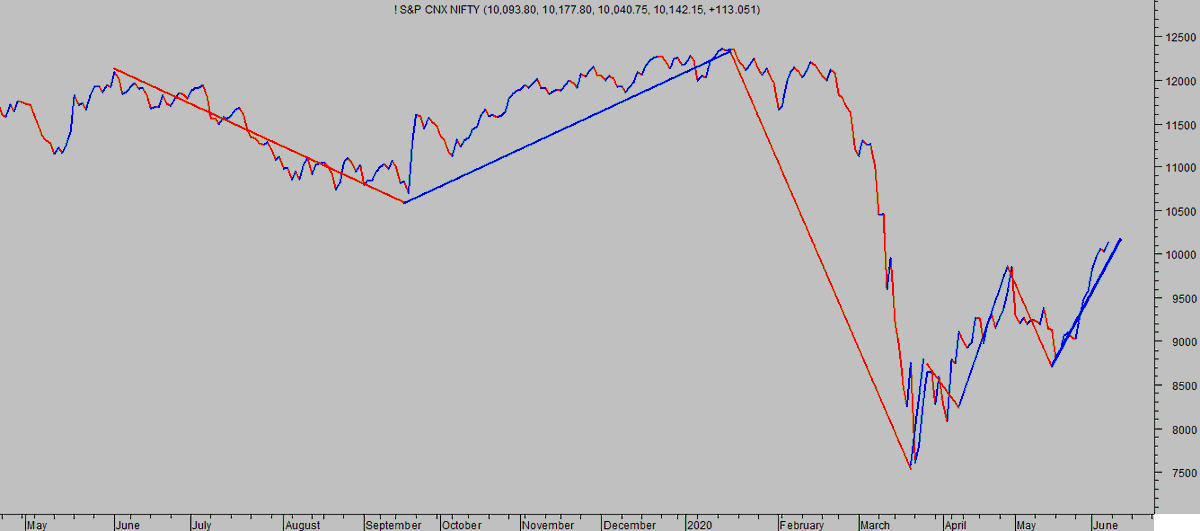
2. The index has crossed the 13 (red 9138) 30 (blue 9229) and 50 (green 8986) period SMA in the previous week.
3. A gap is visible at 9731 to 9533 which has been partially filled till date. Another gap lie at 10,000. On lower side at 9335 a small gap is exists.
May 24, 2020 9 tweets 2 min read
My weekend review of Nifty
Key observations
1.The 13 (red 9133 ) 30(blue 9174 ) and 50(green 9067 ) SMAs have clustered and are placed just above the price. 
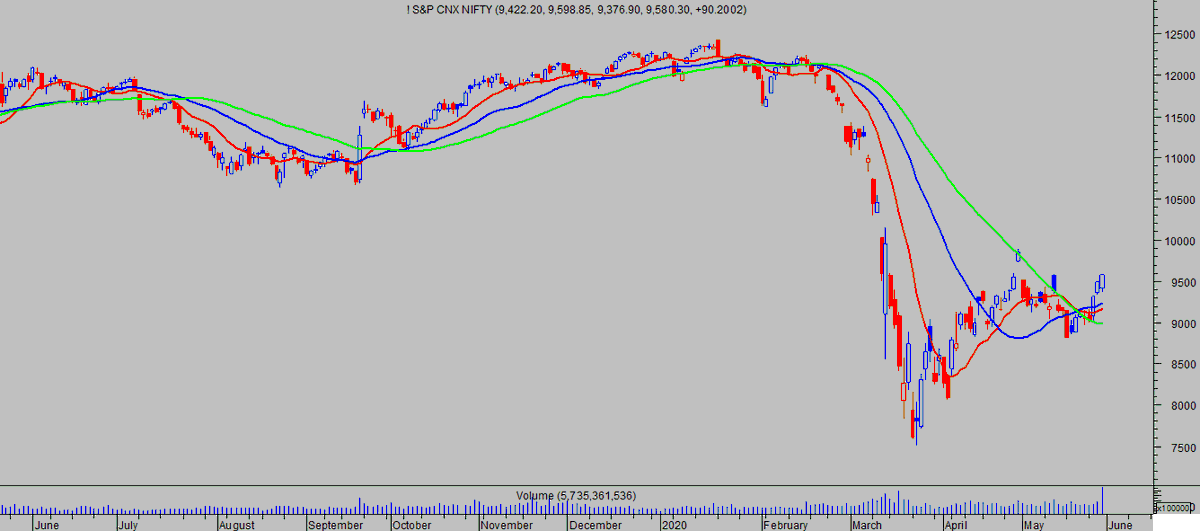
2.The RSI is just below the equilibrium line. The indicator is hovering in zone of 40 to 60 for more than a month. The next move will be crucial.
Mar 14, 2020 18 tweets 4 min read
Weekend review of Nifty.
It doesn’t make sense to go by normal technical analysis for the coming week. Instead today this thread will cover what happened on short term time frame after Nifty had hit Circuit filter. We need to understand how things unfolded in next ten to twenty odd trading sessions post the circuit filters were triggered.
Mar 7, 2020 15 tweets 5 min read
Weekend review of Nifty
Three gaps on downside in a span of two weeks. Beyond doubt, momentum is strong on the downside. Traders appear to be giving up hope of any meaningful bounce let alone upside reversal. Image On weekly time frame Nifty has broken below the all important 100 week SMA. This average had provided reliable support to the index
Since 2016 this is the second time it has violated the 100 week SMA out of seven times it tested. The 200 week SMA lies way below at around 10300. Image
Feb 29, 2020 12 tweets 3 min read
The horrible week that was: Nifty plummeted like nine pins and broke all supports like a karate expert breaking bricks made of fire clay. Finally it rested on the 100 week SMA. This is the seventh time this average has been tested. Out of six times in earlier cases only once it failed to hold on to it. Image
Feb 22, 2020 5 tweets 2 min read
In my last week’s review of Nifty I had mentioned that Nifty may face resistance at the 30 and 50 SMA. It did exactly that. I had also mentioned support for the index lies at 100 SMA. It rebounded from there. Image In coming week there is a high probability that the index may open downwards and try to test the 100 day SMA again.
A gap is also seen in Nifty from 12030 to 12042. This too may turn out a support zone.
Feb 21, 2020 17 tweets 6 min read
Theory of Gaps (A thread)

Gaps in technical charts are formed because of news flow after the market has closed and before it has opened. It is a no trading zone. A common myth associated with gap is that it is always filled. Waiting for gap to be filled can at time prove too costly for a trader.

Sensex had registered a gap from 12219 to 13479 ways back in the year 2009 which remains unfilled till date.
Feb 16, 2020 4 tweets 2 min read
The week that passed by was a tough one. A down day followed by two consecutive up days and thereafter two consecutive down days.
Nifty gained 15 points over the course of the week.
The index is currently at around the 30 and 50 day SMA. ImageImage 
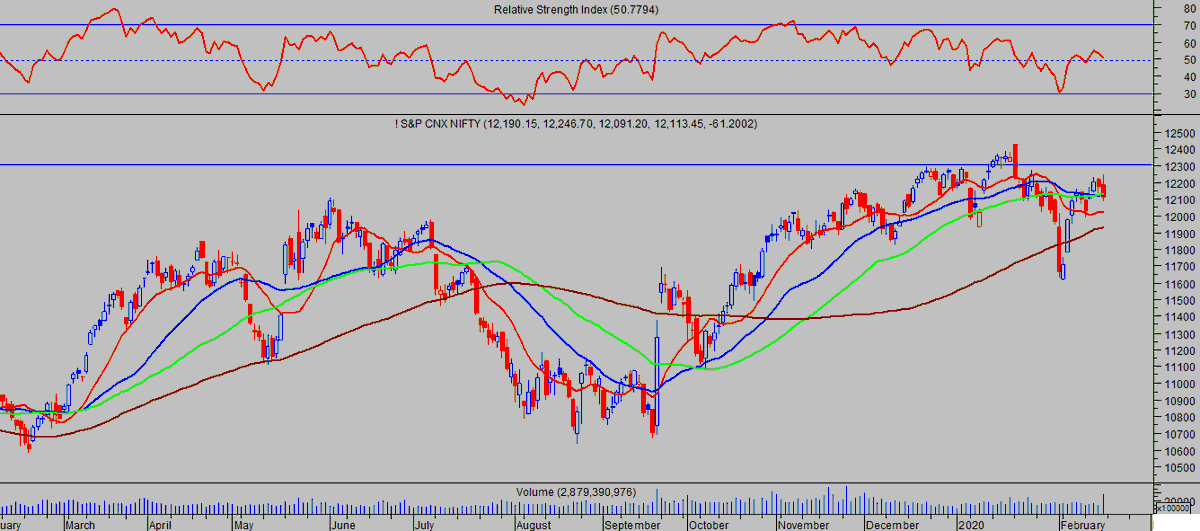
The RSI (14) continues to hover at the equilibrium zone. The sharpness of rise in RSI (14) a week before is indicating dips should be utilized to enter long. However no price confirmation is seen on the charts.
Dec 28, 2019 35 tweets 7 min read
Dow Jones from 1936 to 1945 (covering World War II). comments welcome.

I have provided the link of previous thread on Dow where I discussed “The Great Crash” and “The Great Depression” at the end of this thread.

30 (Blue) ,50(Green) 200(Black) SMAs plotted on chart. President Roosevelt second term’s beginning was not as rosy as the first. He had to back track. He had to cut back many of his spending to reduce national debt.
The economy again began to fare badly and depression resumed.
Dec 21, 2019 30 tweets 7 min read
USA 1929 to 1936 (A Thread) Comments welcome.
US economy was faltering at every stage, common people were unhappy jobs were few and far to be found and the products could not find consumers. The stock market defied gravity of the situation. It moved one way and that was up.
Market crashed from historic high of 386 to 195 in just two months. It was not the end. It was the beginning of “THE GREAT DEPRESSION”.
Dec 14, 2019 17 tweets 5 min read
The sequence of events which led to the 1929 crash in Wall Street. (Comments welcome)
1920—1928
For almost eight straight years stock market was rising and there was no upper limit. The dollar was king. This decade was also named as “Roaring Twenties”. New products and technologies included Automobiles, radios, cinema, sound movies, washing machines and Air conditioners.
Dec 7, 2019 11 tweets 4 min read
Trendline ( A thread)
Request you to retweet AND add post here of interesting trendlines you have come across.
In a rising market if a straight line is drawn from lowest point (or the next minor low) and successively joined to join minor lows a rising trendline is formed. (1/n) First two lows of the trendlines make it and the third point validates it. (2/n)
Nov 2, 2019 5 tweets 1 min read
Open interest explained in simple words.
Open interest is usually used as an indication of the strength of a price movement, but on its own it does not provide any indication of the direction of the price movement. Increasing open interest shows that there is strength behind the current price movement, and decreasing open interest shows that there is a weakening of the current price movement.