G Elliott Morris Profile picture
editorial director of data analytics @abc news/538. author of STRENGTH IN NUMBERS: how polls work and why we need them https://t.co/c8nxYdnpks.
Ken Tancrous Ⓥ 🌱 eDo Profile picture Marcelo Martinelli Profile picture Joshua Cypess Profile picture jimrothstein Profile picture 9 subscribed
Jan 25 19 tweets 5 min read
📊Today 538 is releasing an updated set of our popular pollster ratings for the 2024 general election! Our new interactive presents grades for 540 polling organizations based on their (1) empirical record of accuracy + (2) methodological transparency. 1/n abcnews.go.com/538/best-polls… There’s tons to say but I’ll hit a few main points. First, a methodological note. For these new ratings, we updated the way 538 measures both *empirical accuracy* and *methodological transparency.* Let me touch on each. (Methodology here: ) abcnews.go.com/538/538s-polls…
Image
Nov 21, 2023 4 tweets 2 min read
if you want to understand polling today, you have to consider *both* the results and the data-generating process behind them. this is not a controversial statement (or shouldn't be). factors like nonresponse and measurement error are very real concerns stat.columbia.edu/~gelman/resear… given the research on all the various ways error/bias can enter the DGP, if your defense against "polls show disproportionate shifts among X group. meh" are "well X group voted this way 20 years ago," i am going to weight that pretty low vs concerns about non-sampling error Image
Oct 14, 2023 6 tweets 2 min read
There is good stuff in this thread, and I’ve been making the first point too for some time. But remember a lot can change in a year, and some of the factors that look big now may not actually matter. Uncertainty is impossibly high this far out. I took a look yesterday at how much Dem state-lvl POTUS margins tends to change from year to year. It’s about 7pp in our current high-polarization era. That’s a lot! With 2020 as our starting point simulating correlated changes across states, you get p(Biden >= 270) around 60%.
May 19, 2023 4 tweets 1 min read
so, as they say... some personal news Lots to share, but for now I'll just say FiveThirtyEight was one of the outlets that inspired me to be a data journalist. Nate Silver did great work & the team he led changed political journalism for the better. We will be iterating on that, but we start with a strong foundation.
May 18, 2023 4 tweets 2 min read
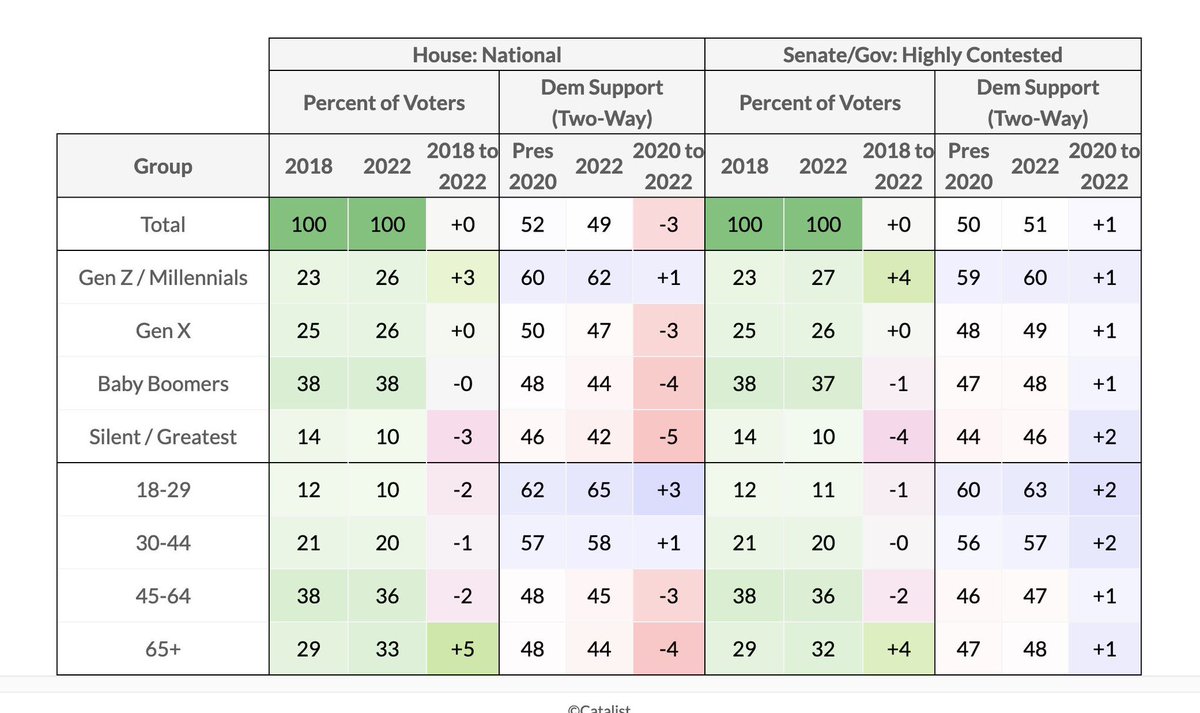
pretty bleak picture for the GOP 10-20 years from now, unless the party changes its policy endorsements and messaging to shrink the gap in Gen Z/Millennial voting behavior catalist.us/whathappened20… Image yes, however, rolling back convenience voting reforms for students is not going to be an effective voter suppression strategy when the average Gen Z voter is out of school (my back-of-envelope math says this should happen around 2028)
Apr 17, 2023 4 tweets 2 min read
Just one poll… But IMO pundits are currently running the risk of spinning the proverbial wheel too far against Ron DeSantis in terms of his electability value above Trump (which is declining or completely negated by recent news, according to some accounts) eg
Apr 1, 2023 6 tweets 3 min read
In the early 1900s millions of whites from former Confederate states moved north and west. Using newly digitized Census records, scholars mapped where they went—and found a significant conservative cultural shift in places the southern white diaspora moved
economist.com/graphic-detail… Counties with higher shares of Southern whites in the 1940 Census voted more for Trump and other 21st century Republican presidential candidates, all else being equal.

Impact or this effect increases with more Southern whites, consistent with models of cultural transmission
Dec 9, 2022 4 tweets 2 min read
well done Image fun for the whole family Image
Dec 7, 2022 21 tweets 5 min read
As always, given complexities with early v in-person votes and geographic variation in partisan loyalty, best to wait for a representative set of each to report before drawing conclusions about these GA numbers. Warnock up big in early vote ≠ victory For example, the raw partisan split of early votes in Fulton County look a few points better for Warnock than a benchmark for a tied race. But without knowing the election-day numbers in rural areas or urban Atlanta, that’s not enough to make any calls
Dec 6, 2022 6 tweets 1 min read
If I had to bet I’d say Warnock has the clear advantage going into tonight’s GA Senate runoff, but that the markets are a bit overconfident on him based on publicly available data. A +2 lead in Senate polls is roughly a 65/35 chance for the leading candidate. Long way from 100 Plenty of other indicators are bullish for Warnock. The same GE fundamentals (fundraising, candidate quality, incumbency) all suggest he ought to have an edge, & we may see the same patterns of GOP voter drop off as in the 2021 runoff. In fact I think that’s likelier than not!
Nov 17, 2022 6 tweets 2 min read
trafalgar group has the highest empirical bias relative to other pollster of over 500 firms we have data from. literally the most biased pollster in america. and we warned people that that bias could carry forward and mess with averages in a good year for polls. we were right!! if someone has a bad record, is opaque about their methods and then tells you they “want to be the elon musk of” that thing, that’s a 🚩 🚩
Nov 11, 2022 4 tweets 1 min read
Looking at these newest Senate results and tbh if I’m a news network decision desk, I’m probably getting pretty close to calling AZ for the Dems and honestly NV is looking good too, but it’s a lot closer and we don’t have super reliable data on the number of outstanding ballots in the counties around Las Vegas and Reno
Nov 10, 2022 4 tweets 2 min read
Polls just had one of their best elections ever. Based on our (preliminary) estimates, our averages in competitive states have an absolute error of just 2 points on margin — a little under half the expected error — with average *bias* undershooting Dems.

economist.com/united-states/… This chart shows bias in each state in 2022 vs 2020. Take out FL and there is a uniform decrease in bias across states. Good!
Though if you're looking for reasons to be anxious: much like 2018 there is still a positive slope here, indicating *some* persistent partisan nonresponse
Nov 10, 2022 4 tweets 2 min read
this is a completely useless exercise if you’re not imputing results in uncontested seats. you do not capture structural advantages when aggregate totals are missing like 50 seat observations! One issue is that the popular vote is much likelier to end up < R+1 than at R+2 or more. See here
Oct 30, 2022 5 tweets 2 min read
If you adjust for the percent of votes outstanding in each state in Brazil right now*, you get a result of 50.1 Lula - 49.9 Bolsonaro --
which is to say, it looks like Lula could still pull this off, but it's going to be another close round! The * here is that doing this assumes that state voting patterns will be constant as new votes come in, which is not true. So it's an estimate with a wide margin of error!
Oct 28, 2022 4 tweets 2 min read
gun to my head i would bet that polls are overestimating democrats again, rather than republicans. but such predictions don’t have a great historical track record…
still the clues here are mostly constant across polls and have helped anticipate recent errors (low n tho) remember, registered republicans were more likely than democrats to answer polls for much of 2020, including during the summer boost in response rates from Dem activists — so even well designed polls that stratify &/or weight by party don’t solve nonresponse by vote intention!
Oct 24, 2022 6 tweets 3 min read
How do we deal with partisan polls? Two options:

1) Let the polling aggregation models make adjustments for whether a poll was conducted for/released by a partisan client (this means subtracting ~3-5 pts on margin from that side)

2) Throw out partisan polls

Results attached: ImageImageImage So while the claim is that GOP partisan polls are pushing up Republican numbers in the averages, what we see from these two model runs is when you exclude those partisan polls from the averages Democrats actually end up _worse off_ in most states
Oct 24, 2022 4 tweets 2 min read
Really good polling journalism from @qdbui nytimes.com/interactive/20… Image The "true" interval is probably EVEN LARGER due to coverage error (that's when a population isn't represented by the sampling frame, such as "ppl with landlines" or "X online panel"), processing error (are the targets right? do they control for non-response?) or measurement error
Oct 20, 2022 24 tweets 6 min read
You may have noticed some peculiar Senate polls from a "nonpartisan" group called Center Street PAC this cycle. Polls like these, where Democrats are doing 10-20 points better than the averages.

I interviewed their pollster and got my hands on their data. Here is what I found:🧵 Here is the article if you want to skip the gory details:
economist.com/united-states/…

The first thing to do is establish whether CSP is an outlier. So we made a model that measures how far each pollster's data deviates from averages, accounting for partisan bias & a few other vars.
Oct 17, 2022 6 tweets 2 min read
hey siri what is the margin of error on a sample size of 77 people (and that’s not even taking non-sampling error into account)
Sep 16, 2022 4 tweets 2 min read
Bias in polls has not been predictable nationally (see 538)
But this ignores that _patterns in bias across states_ may be more predictable now (see tweets)
The Q is not so much "will polls be biased nationally" but "will polls be biased in the close states with key elections" Image FWIW I do not think that anyone will have a great record trying to predict the precise degree of bias in the polls (partly because of the small sample size of elections). But I do buy the theory that the probability of polls overestimating Dems is higher than overestimating Reps.