
Toxically materialistic Hoosier farmer. I love my truck, my tractor and the Midwest. I also write software and write about the ethics of writing software

 What this means is that the level of SARS-CoV-2 virus in the environment will be reported as the difference between current readings & the readings of a year ago
 Paradoxically, February of 2021 was the least deadly February of the last decade and a half for school-aged children
 Whenever the blue area is above the red area it represents deaths from disease above what is expected that are not officially COVID deaths

 This is the central campus of Indiana University.
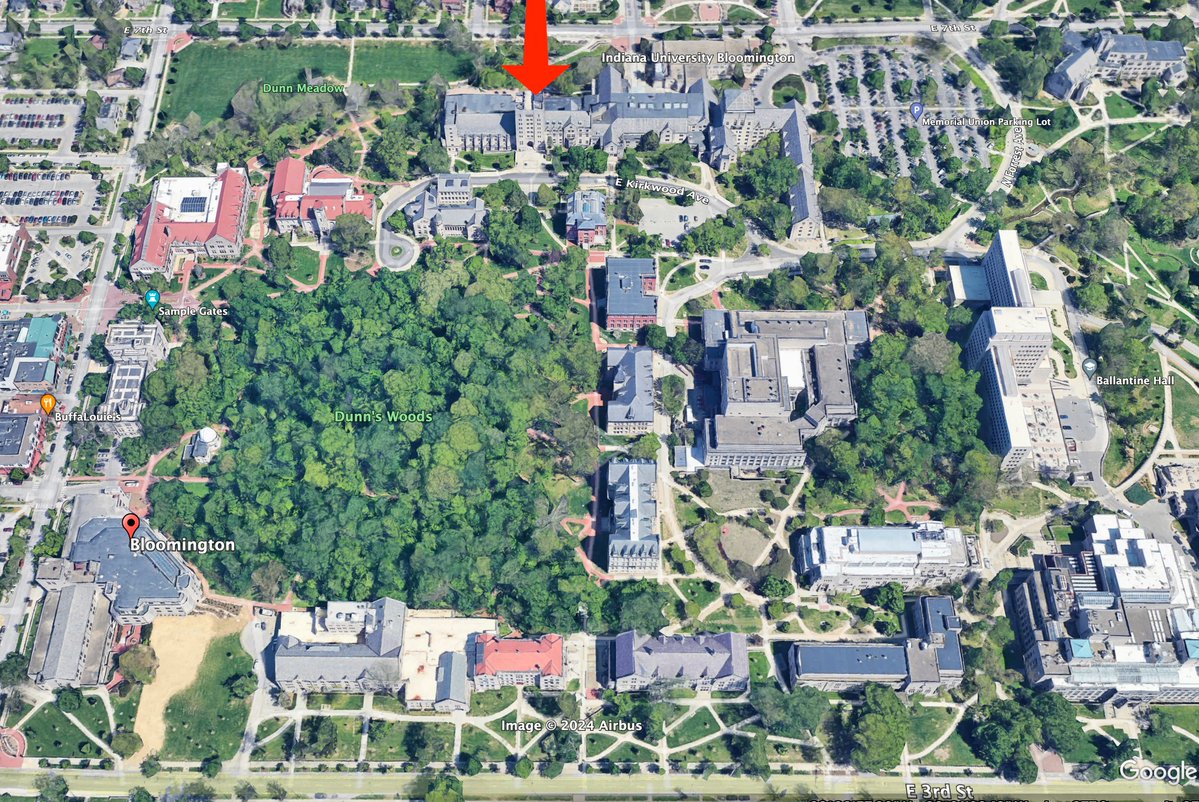


 They're killing them by triggering death from liver and kidney disease
 The minimizers did not like that I drew a causal inference between SARS-CoV-2 infections (COVID deaths) and excess deaths from disease
 Same chart except showing only the 18-44 year old demographic


 To understand the vast gulf between what comes out of UCSF and what the rest of us consider our lived experience, consider:
 Note that I do not use the statistical trick of "age adjusting" deaths
 Unfortunately, COVID for other age groups is not over
 As of July, the 18-44 demographic was experiencing a surge in deaths from disease with the preliminary incomplete data supporting an intensification of that surge

 Right now we're looking at total excess deaths for all age demographics. That produces a pretty cluttered picture as we saw.
 Here are HHS regions 1,2 and 3 (New England, New York, Mid Atlantic)


 In 2021 that changed
