
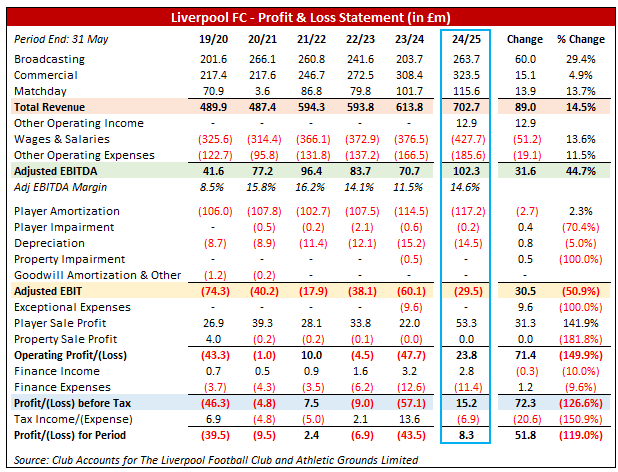
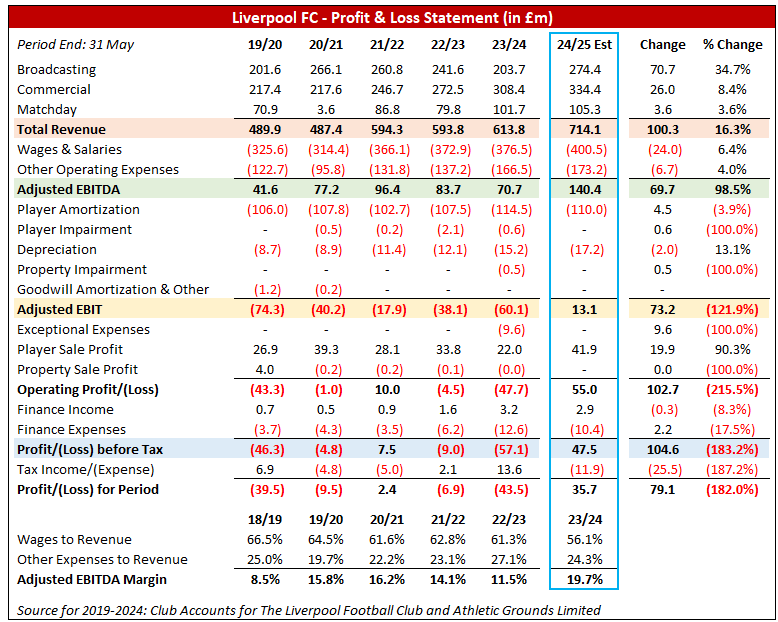
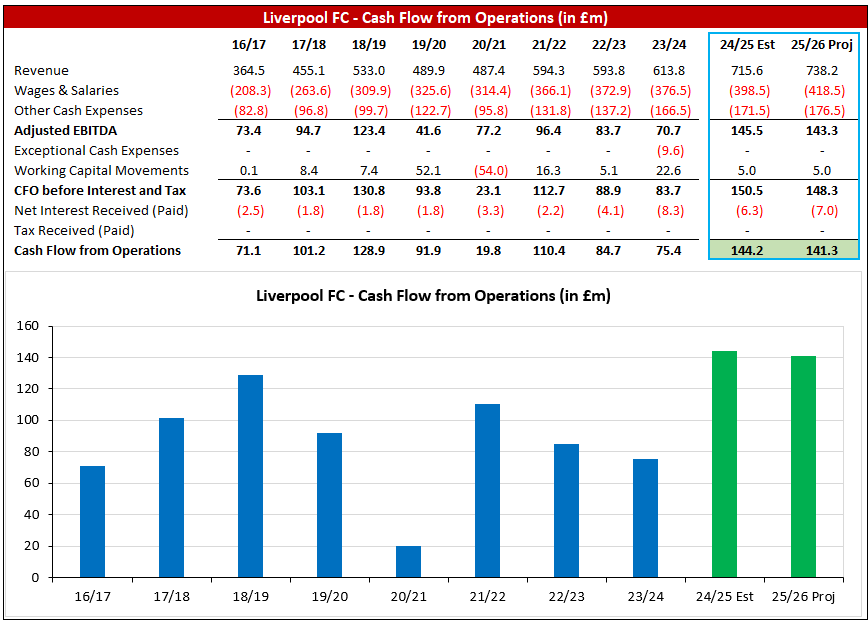
 Revenue increase YOY by £89m to £703m driven by growth in each segment:
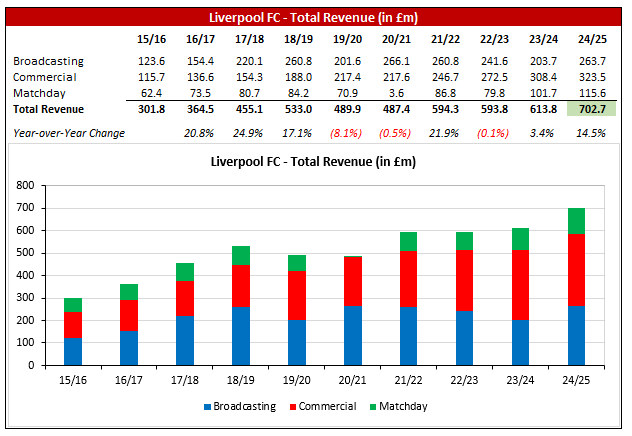
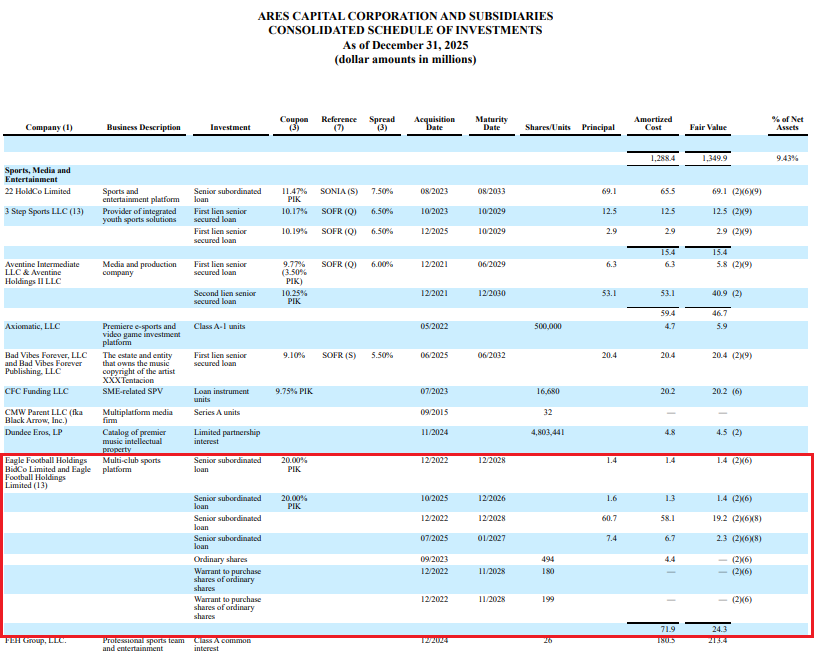 The EFH positions have exhibited a net unrealized decrease by $46m during FY25.
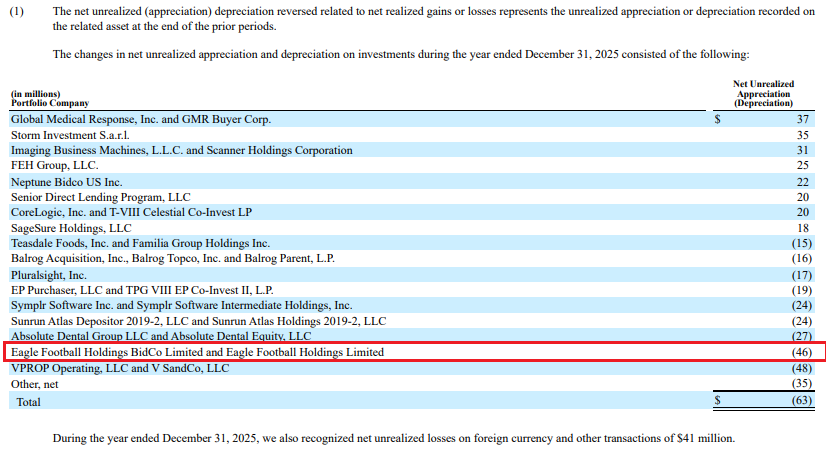
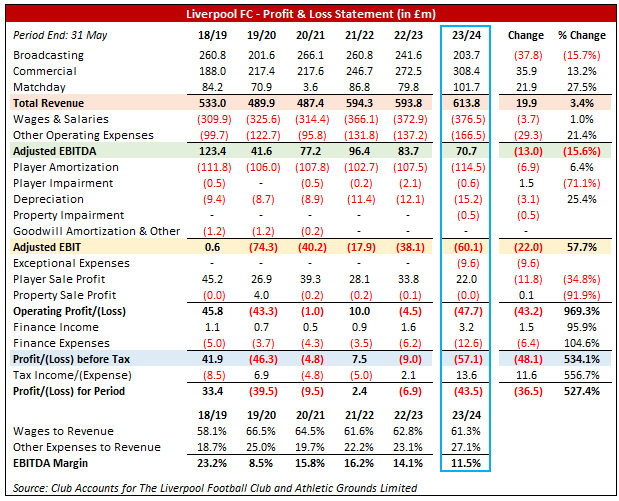
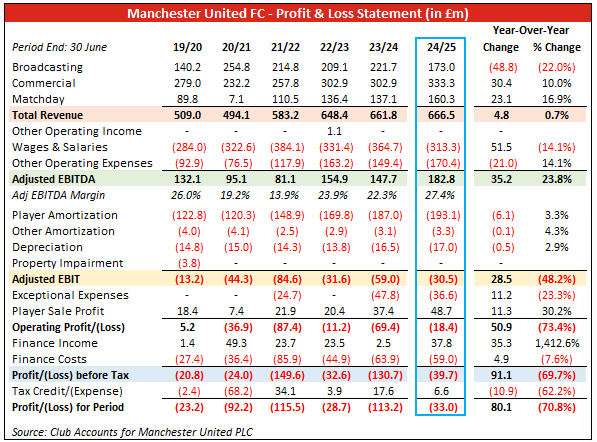 The total revenue increase of £5m (+0.7%) reflects the net impact of strong commercial and MD growth (comm: +£30m; MD: +£23m) versus a sizeable decrease in broadcast revenue (-£49m).
 Est rev incr of £100m reflects:
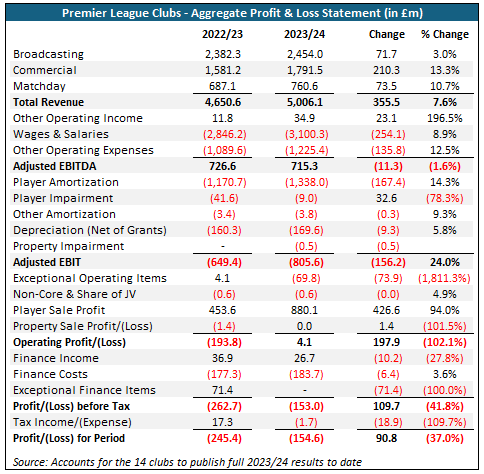 P&L figures by club are attached. Average pre-tax result a loss of £11m (median: loss of £13m). Note that data doesn’t include headline figures announced by Chelsea and Villa (waiting on full results to include in summary).
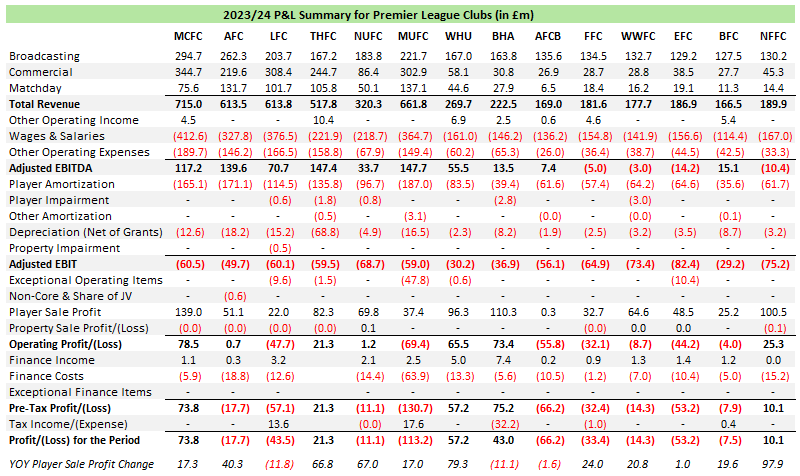
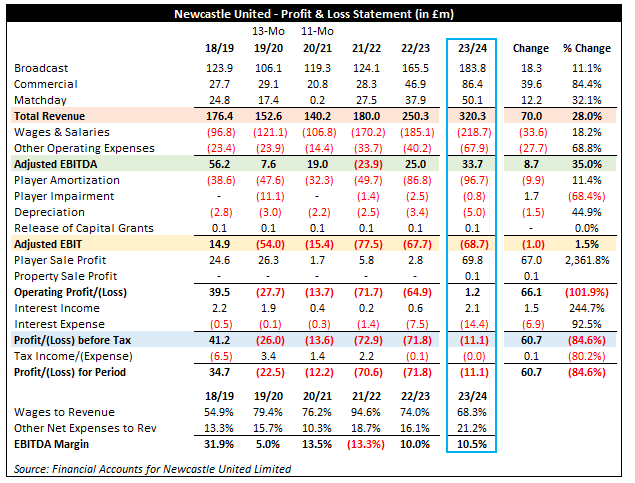 Strong total rev growth reflects robust in each core segment, w/ broadcast higher by 11.1% (+£18m reflecting UCL +£30m vs other -£12m), commercial rising 84.4% (+£40m; sponsor growth biggest driver), and MD up 32.1% (+£12m; same # home vs 2022/23 but higher demand mix w/ UCL).
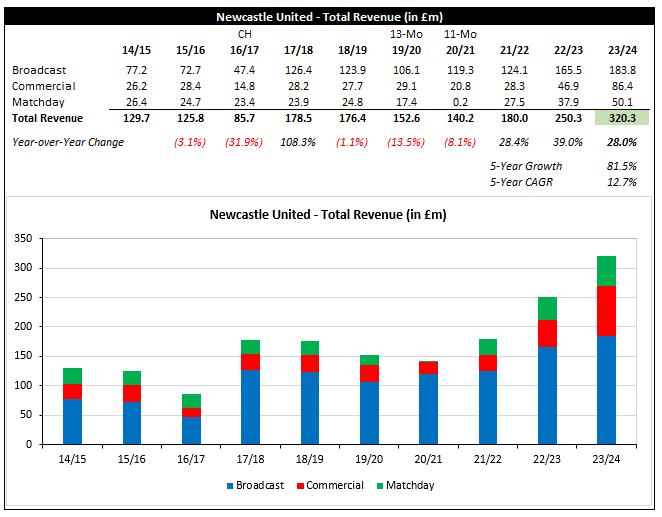
 Revenue increase by £20m reflects net impact of a £36m increase in commercial, £22m increase in MD, and £38m decrease in broadcast. Commercial comprised 50.2% of total revenue for the period (first time cresting 50%).
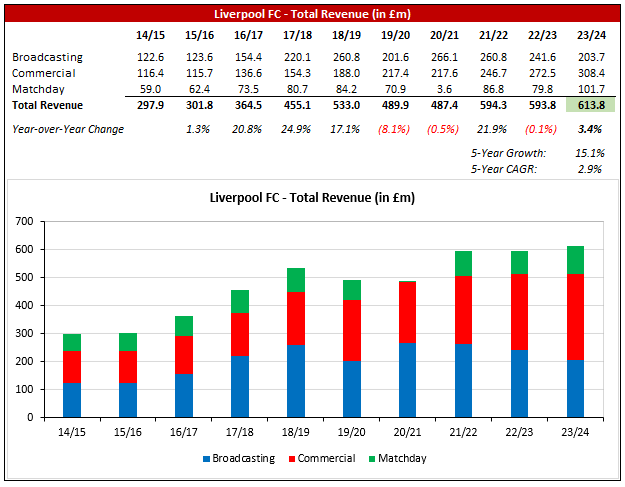
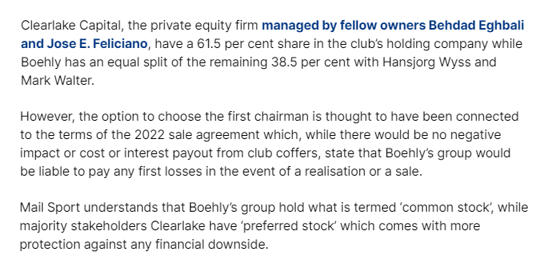 Attached is an ownership diagram based on filings (flows read bottom to top):
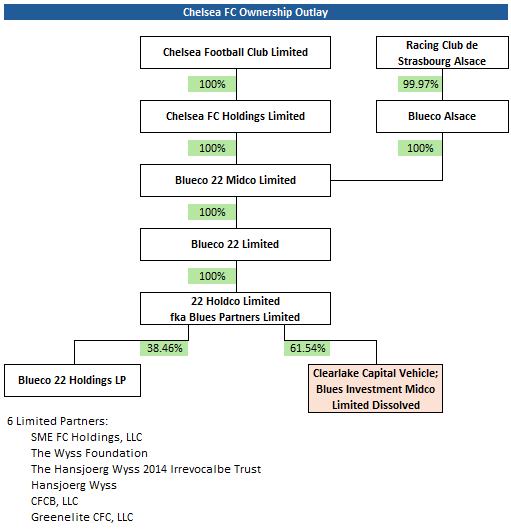
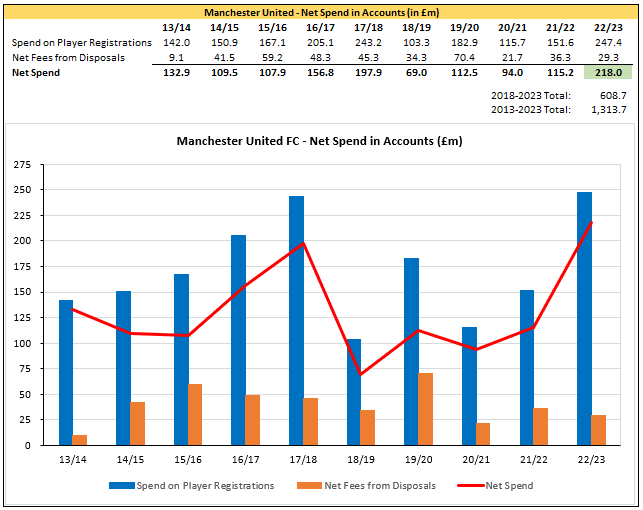 Some points of note on Net Spend in accounts:
 I wrote about this on Substack back in March after the £57m capital injection (link below). The write-up is based entirely on public information via filings on Companies House.